
Looking back over time there have been many stocks that have punished buyers on "failed" breakouts. We look at a handful of them today and help you build out a gameplan for identifying them going forwards.
If you have been around the Nasdaq Dorsey Wright platform for long enough, many of you will be familiar with our “anatomy of a collapse” series detailing a failing company on the technical front before the demise came to fruition on the fundamental side of things. We typically update this series in the aftermath of a large, well-known company goes belly-up, and new editions are the favorites of many of you who read our research from time to time. While today’s feature isn’t that, it is a new take on the same idea… what we will call an “anatomy of a failed breakout.” As many of you know, finding proper breakouts are more of a fine art than an exact science… one that even the analyst team can misread from time to time. Regardless, looking back at pitfalls the technicals can sometimes throw at us can help us sharpen our pencils for the next chart that comes across our desk.
A “breakout” will be different in everyone’s book. For many of us in the NDW office, one of the criteria of a possible breakout is when a stock (weak or strong) moves back into a positive trend. This typically marks a new page for a stock, one which we would hope ushers in sustained upside action as demand takes control. A trend break also brings with it the addition of a technical attribute… but it is worth noting that a stock in a positive trend can still earn a “weak” rating by NDW standards by failing its other relative tests. Not every positive trend break is created equal- some will quickly fall out of bed on their way to fresh lows- these are the ones we want to avoid if we want to protect our portfolio.
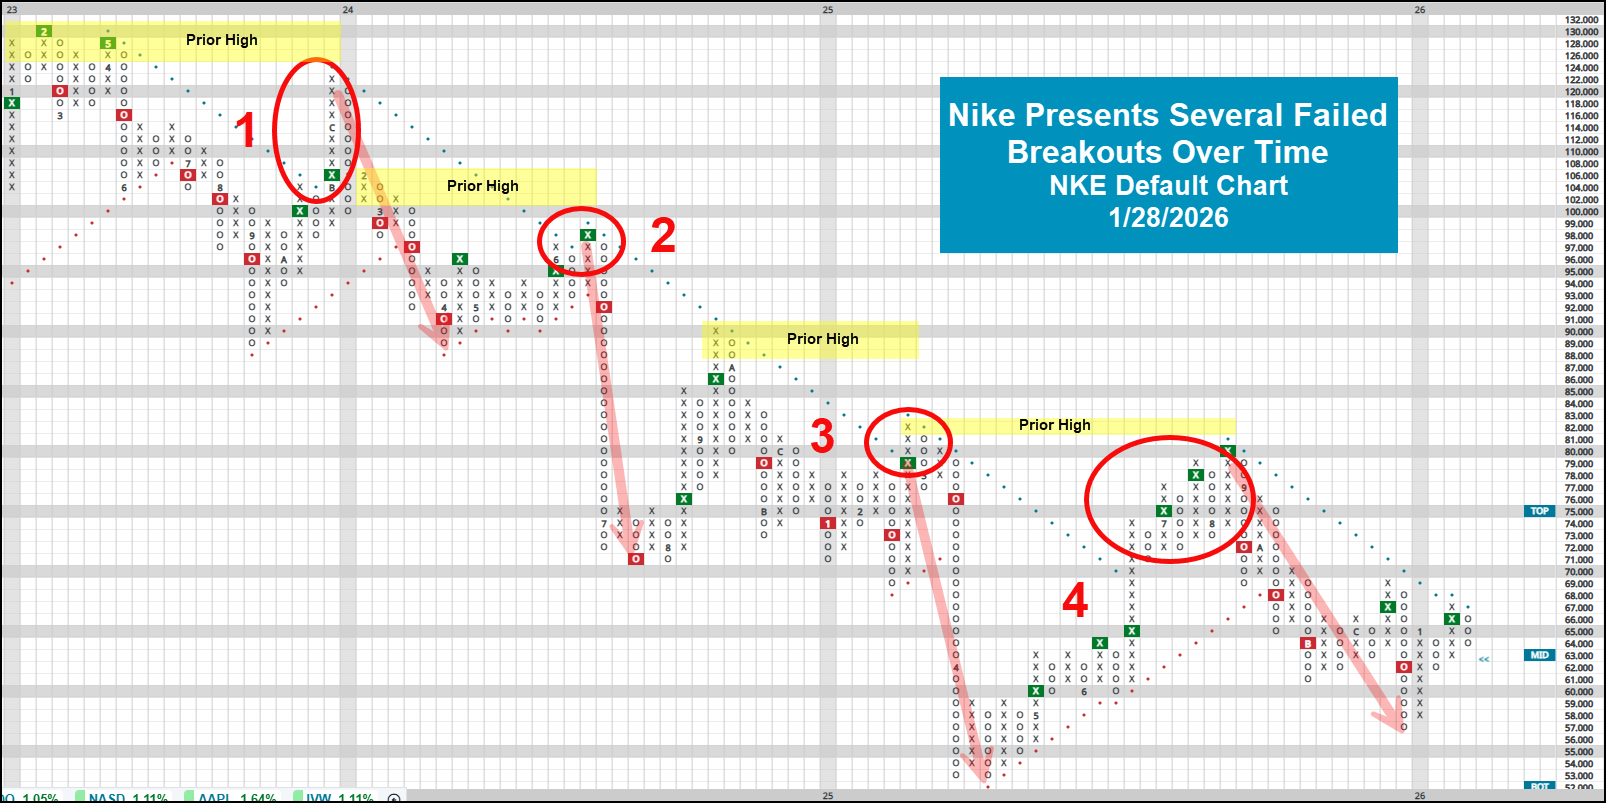
Before going further, its important to clarify the PnF charts today are admittedly cherrypicked. There are certainly charts out there that have the markings of what today’s feature will designate a “failed” breakout that will ultimately be quite successful, and vice versa. Regardless, during our search for historically significant failed breakouts…. One main feature was present: the break failed to reach/overcome a most recent high. Nike is a great initial example in the chart below. You’ll note that every trend break (of which there have been four since 2023) has failed to reach a previous, obvious price battleground despite the seemingly positive break. This makes complete sense- despite the break bulls were unable to overcome the overwhelming supply of sellers pushing price back down. Those astute to notice this lack of ability for the name to overcome this slew of then previous highs would have been rewarded handsomely for calling the bull’s bluff.
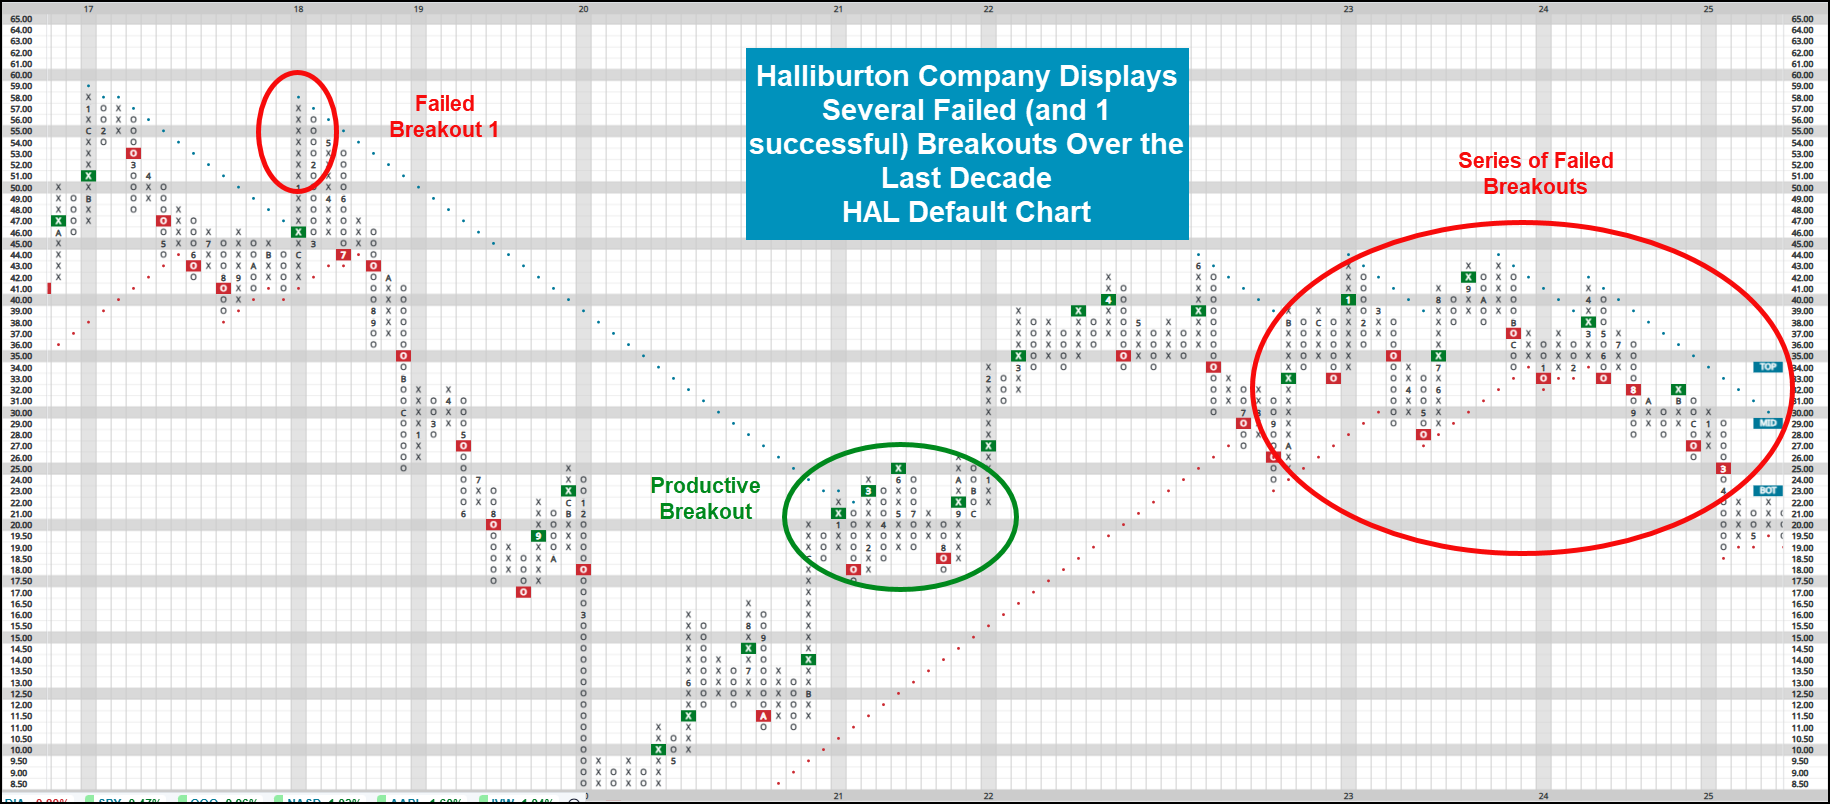
Halliburton Company (HAL) is another interesting picture that played out largely as you would have expected it to throughout the last decade. Note below the first “failed break” in early 2018, where price action failed to eclipse the most recent high at $58. Bears quickly took the wheel until the name ultimately bottomed around the Covid low. At that point, you’ll notice the markings of a productive breakout during which price was able to sustain itself around previous highs. That trend was ultimately in place (as price advanced) until we saw three more “failed” breakouts from 2023-2024 before ultimately falling out of bed and reaching new lows to open 2025. Those following the markings of today’s observations would again be rewarded for their keen eye for the ongoing battle between supply and demand.
To avoid laboring on, Chipotle Mexican Grill (CMG) (2025), Exxon Mobil (XOM) (2016-2019), Caterpillar (CAT) (2018-2020), UnitedHealth Group (UNH) (2025), and Meta Platforms META (2021-2022) all had markings consistent with our definition of a “failed breakout” at the time. Certainly check them out to provide more examples. Shifting gears to actionable ideas today, there are 27 low attribute stocks (<3) within the S&P 500 that have the markings of a current failed breakout in progress. The full list is included below, but a few highlighted names include the likes of SHW, CCI & BLDR.

We will wrap today’s piece with one final “mystery chart” (answer at the bottom of the article, so scroll down if you can’t figure it out…) highlighting the constant failed breakouts during a rather historic time for major markets. You’ll note at least five failed breakouts on the default chart, highlighting the heightened confusion and lack of upward price conviction over this 3.5-year stretch. Here’s a hint… it isn’t just single stocks that can fail to break out.
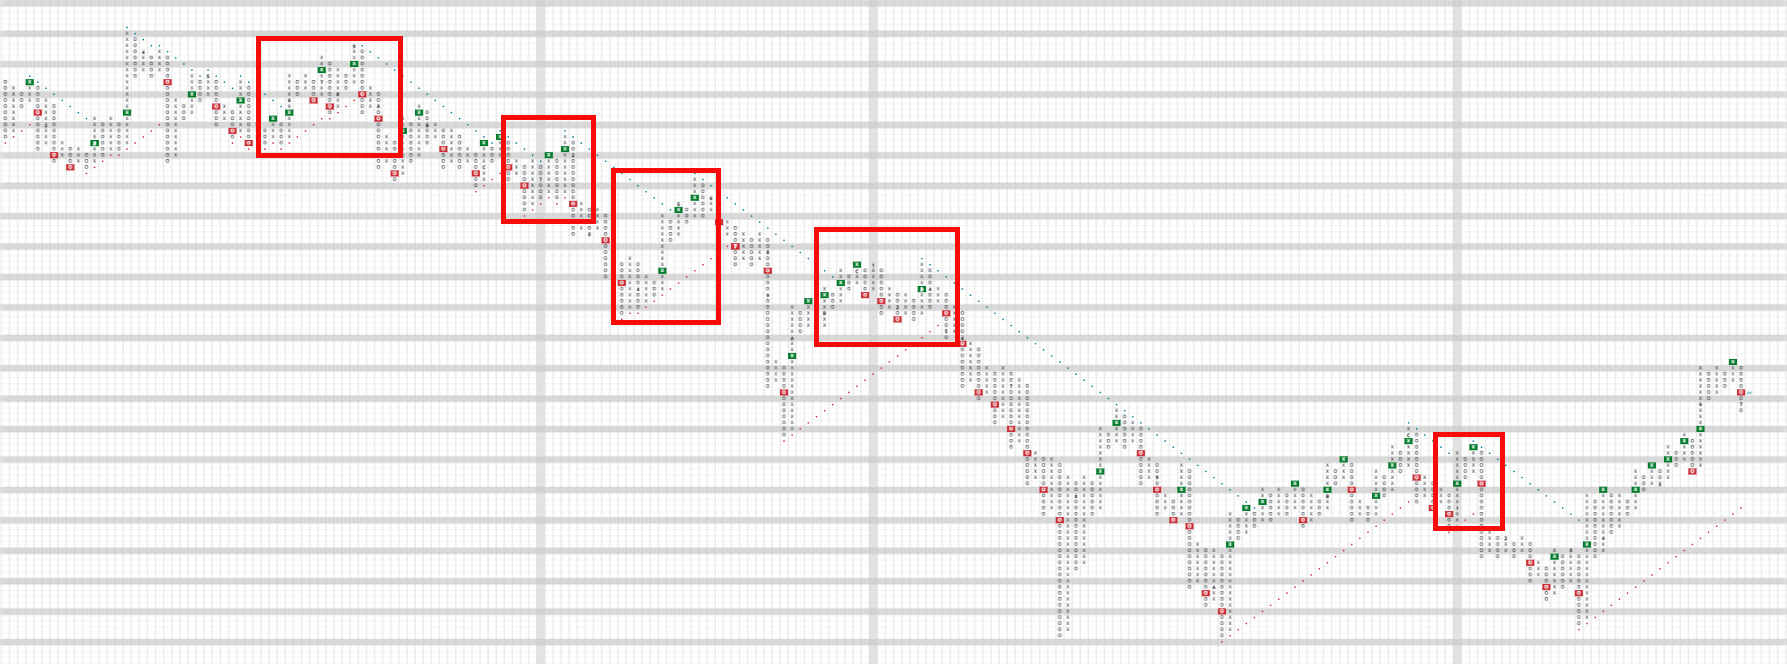
You’ll note that today’s piece didn’t reference the TA scoring system in our analysis, and for good reason. The goal of this piece is not to discredit the importance of following the attributes over time or ultimately seed doubt into the validity of positive trend breaks. That said, the goal is to provide another way to look at breakouts and ultimately find “confirmation” of strong stock movement, rather than chase headfakes unnecessary over time. (Mystery chart was SPX default chart from 12/31/1999-7/1/2003, highlighting the dotcom bubble.)
