Most Requested Symbols

The US Dollar Index ([DX/Y]) took out support to mark its fifth consecutive sell signal.
Looking back over time there have been many stocks that have punished buyers on "failed" breakouts. We look at a handful of them today and help you build out a gameplan for identifying them going forwards.
Weekly Rundown Video – Jan 21, 2026
Weekly rundown with NDW analyst team covering all major asset classes.
Weekly rundown with NDW analyst team covering all major asset classes.
The US Dollar Index (DX/Y) has been in a steady decline since early 2025 but had established a strong level of support going back to July. This support broke on Tuesday when DX/Y dropped below 96 to break a triple bottom and mark its fifth consecutive sell signal. On its longer-term one-point chart, DX/Y’s next area of support is 89-90, so there is a good amount of room to fall. While there are plenty of headlines about the US Dollar, it is now back to levels last seen in 2021 with the next big level of support dating back to 2021 as well. So, be wary of any words proclaiming a collapse. Nonetheless, the USD is in a clear downtrend and the path of least resistance is lower.

This is a green light for certain asset classes, particularly precious metals and ex-US assets which have done very well over the last year. While precious metals are very overbought just about any way one looks at them, a lower USD is still a tailwind on longer time frames. While precious metals may be inactionable in the short-term, international assets are in a better place although still overbought. Secondly, momentum and relative strength strategies have done well in the international space over the last few years, as we’ve talked about extensively (read more here). This has been most evident in developed markets, but emerging markets have been improving for momentum strategies. The image below shows the relative strength spread for both developed and emerging market equities with both lines exploding higher as high-momentum names are doing better than low-momentum names.


If you have been around the Nasdaq Dorsey Wright platform for long enough, many of you will be familiar with our “anatomy of a collapse” series detailing a failing company on the technical front before the demise came to fruition on the fundamental side of things. We typically update this series in the aftermath of a large, well-known company goes belly-up, and new editions are the favorites of many of you who read our research from time to time. While today’s feature isn’t that, it is a new take on the same idea… what we will call an “anatomy of a failed breakout.” As many of you know, finding proper breakouts are more of a fine art than an exact science… one that even the analyst team can misread from time to time. Regardless, looking back at pitfalls the technicals can sometimes throw at us can help us sharpen our pencils for the next chart that comes across our desk.
A “breakout” will be different in everyone’s book. For many of us in the NDW office, one of the criteria of a possible breakout is when a stock (weak or strong) moves back into a positive trend. This typically marks a new page for a stock, one which we would hope ushers in sustained upside action as demand takes control. A trend break also brings with it the addition of a technical attribute… but it is worth noting that a stock in a positive trend can still earn a “weak” rating by NDW standards by failing its other relative tests. Not every positive trend break is created equal- some will quickly fall out of bed on their way to fresh lows- these are the ones we want to avoid if we want to protect our portfolio.
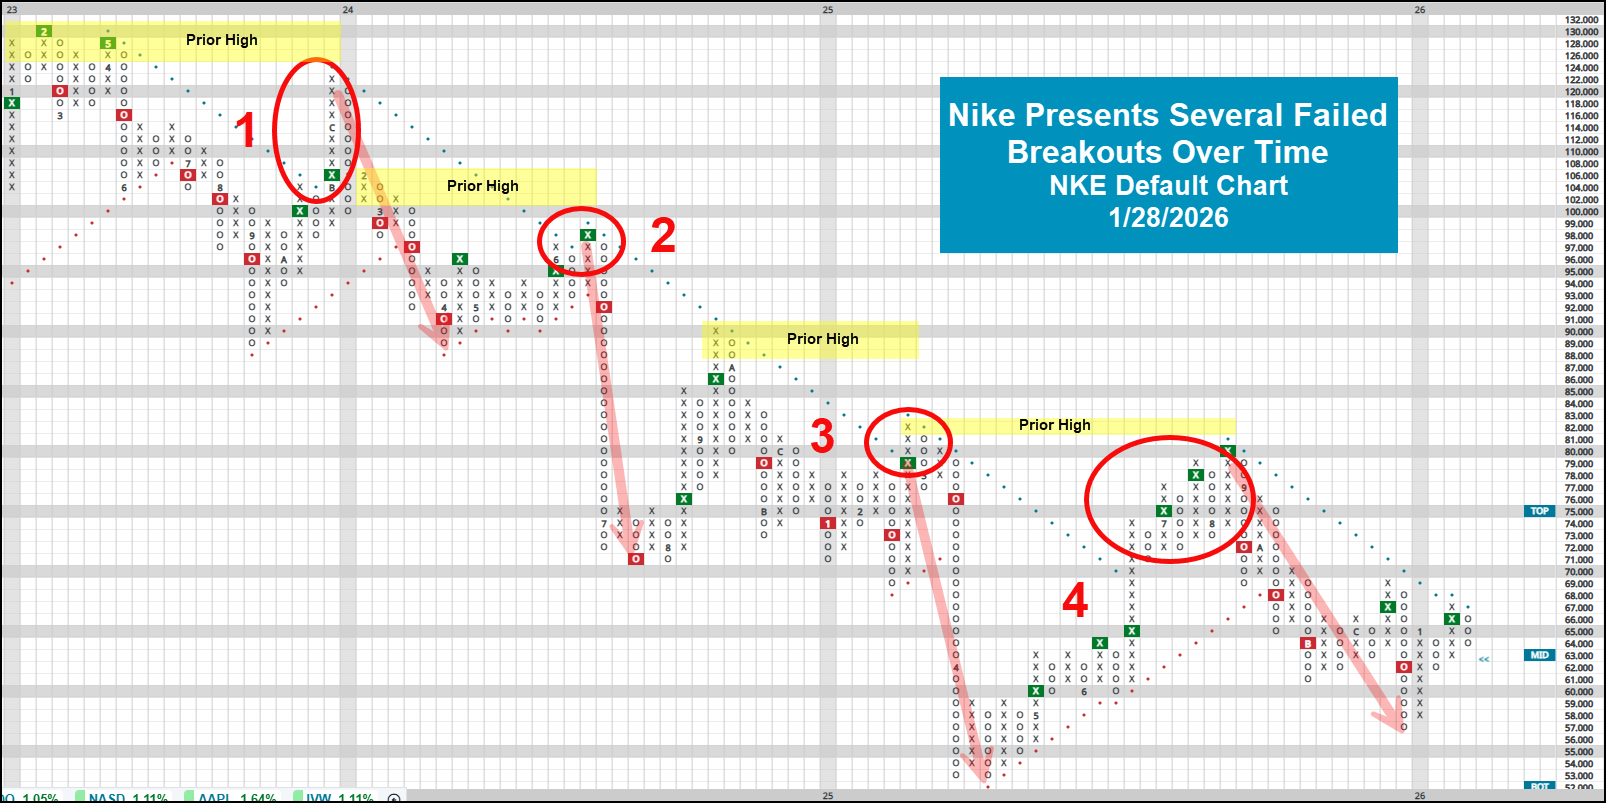
Before going further, its important to clarify the PnF charts today are admittedly cherrypicked. There are certainly charts out there that have the markings of what today’s feature will designate a “failed” breakout that will ultimately be quite successful, and vice versa. Regardless, during our search for historically significant failed breakouts…. One main feature was present: the break failed to reach/overcome a most recent high. Nike is a great initial example in the chart below. You’ll note that every trend break (of which there have been four since 2023) has failed to reach a previous, obvious price battleground despite the seemingly positive break. This makes complete sense- despite the break bulls were unable to overcome the overwhelming supply of sellers pushing price back down. Those astute to notice this lack of ability for the name to overcome this slew of then previous highs would have been rewarded handsomely for calling the bull’s bluff.
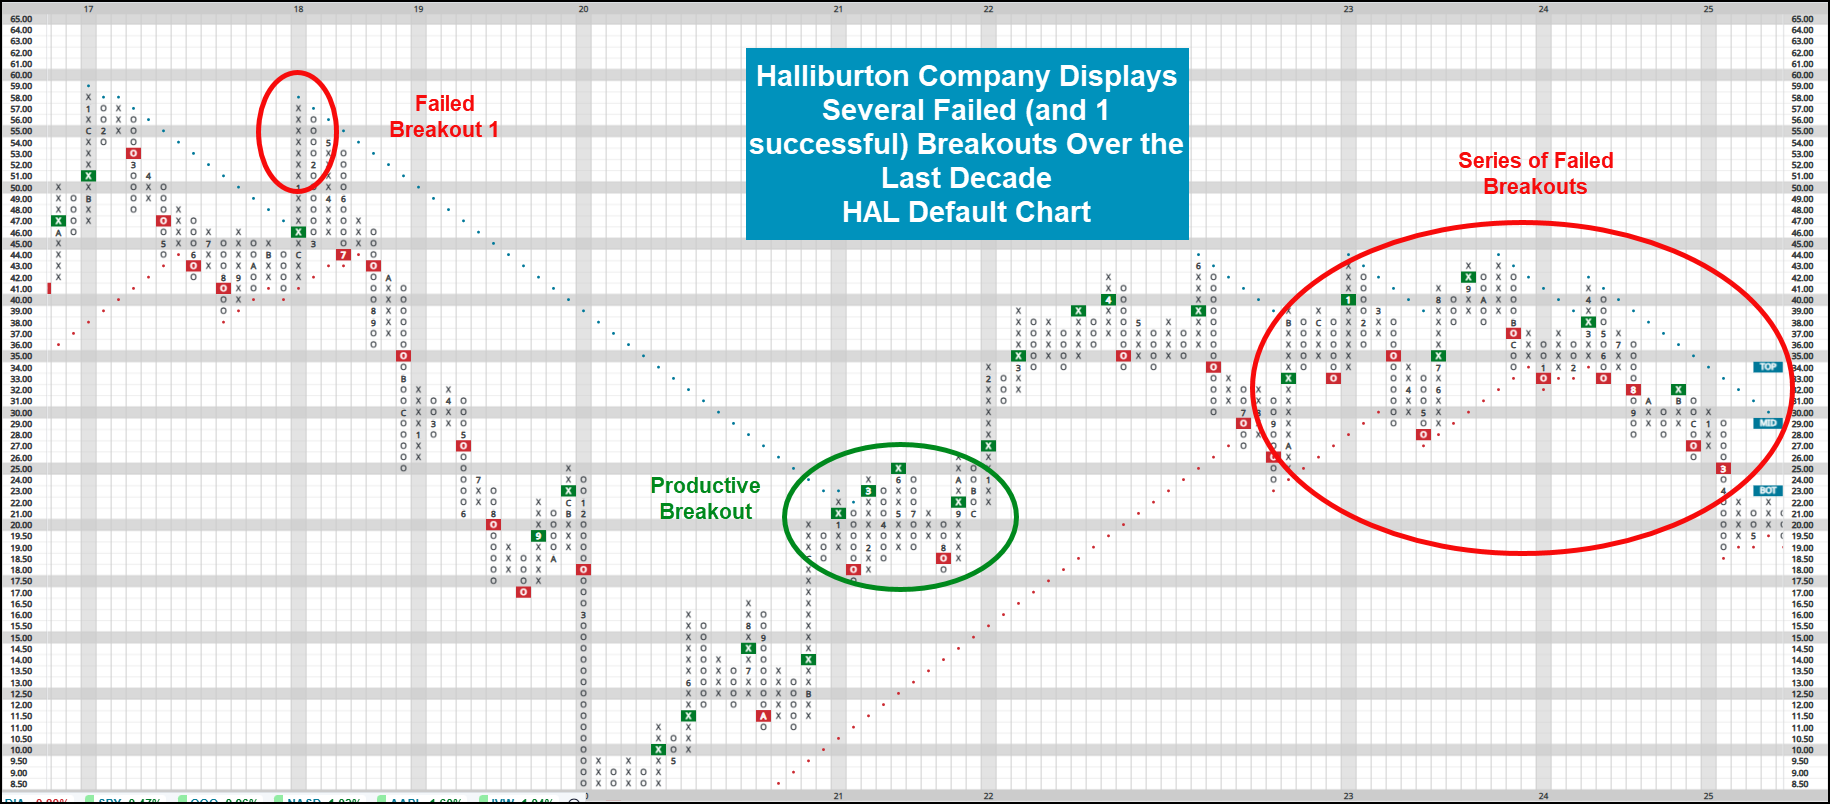
Halliburton Company (HAL) is another interesting picture that played out largely as you would have expected it to throughout the last decade. Note below the first “failed break” in early 2018, where price action failed to eclipse the most recent high at $58. Bears quickly took the wheel until the name ultimately bottomed around the Covid low. At that point, you’ll notice the markings of a productive breakout during which price was able to sustain itself around previous highs. That trend was ultimately in place (as price advanced) until we saw three more “failed” breakouts from 2023-2024 before ultimately falling out of bed and reaching new lows to open 2025. Those following the markings of today’s observations would again be rewarded for their keen eye for the ongoing battle between supply and demand.
To avoid laboring on, Chipotle Mexican Grill (CMG) (2025), Exxon Mobil (XOM) (2016-2019), Caterpillar (CAT) (2018-2020), UnitedHealth Group (UNH) (2025), and Meta Platforms META (2021-2022) all had markings consistent with our definition of a “failed breakout” at the time. Certainly check them out to provide more examples. Shifting gears to actionable ideas today, there are 27 low attribute stocks (<3) within the S&P 500 that have the markings of a current failed breakout in progress. The full list is included below, but a few highlighted names include the likes of SHW, CCI & BLDR.

We will wrap today’s piece with one final “mystery chart” (answer at the bottom of the article, so scroll down if you can’t figure it out…) highlighting the constant failed breakouts during a rather historic time for major markets. You’ll note at least five failed breakouts on the default chart, highlighting the heightened confusion and lack of upward price conviction over this 3.5-year stretch. Here’s a hint… it isn’t just single stocks that can fail to break out.
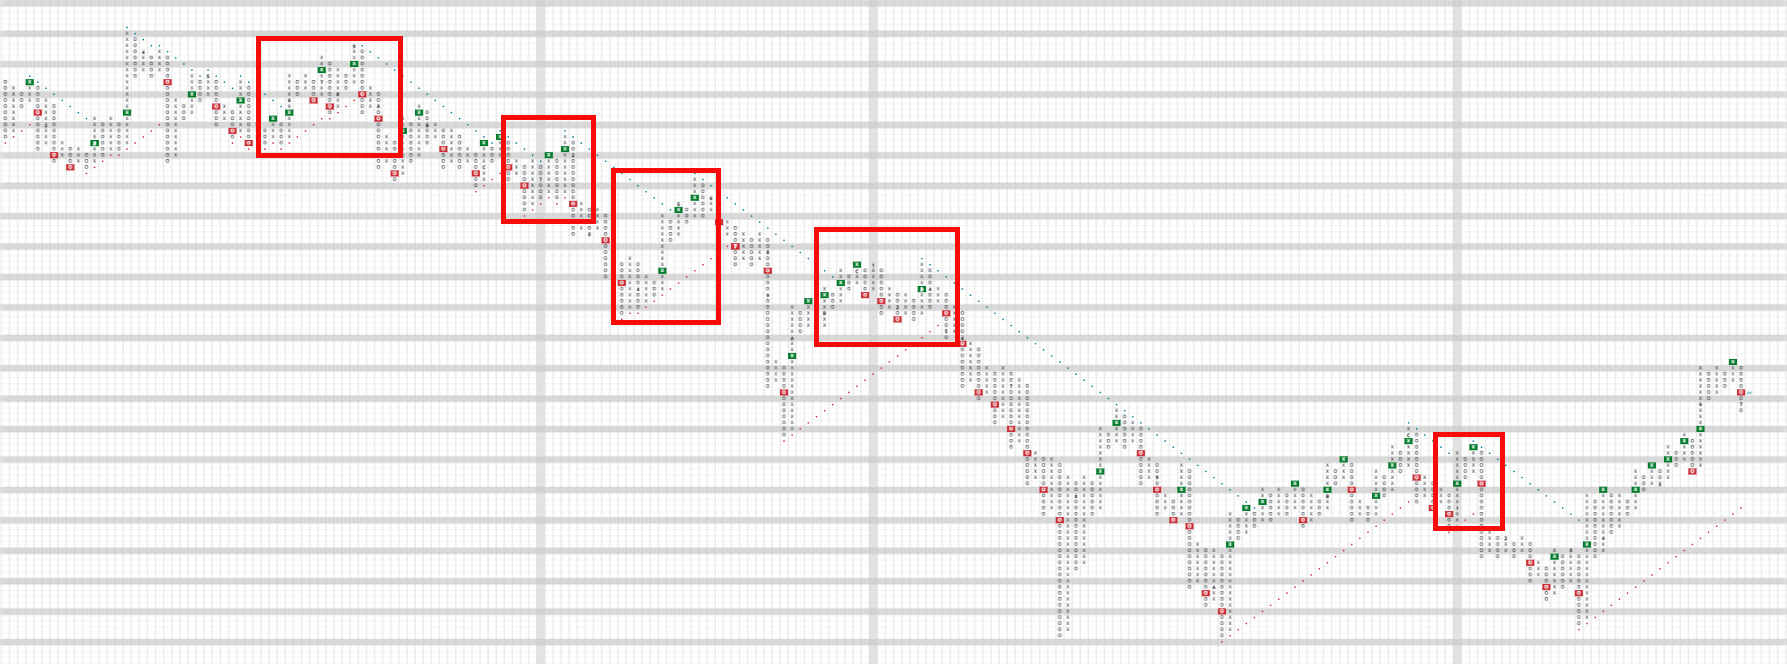
You’ll note that today’s piece didn’t reference the TA scoring system in our analysis, and for good reason. The goal of this piece is not to discredit the importance of following the attributes over time or ultimately seed doubt into the validity of positive trend breaks. That said, the goal is to provide another way to look at breakouts and ultimately find “confirmation” of strong stock movement, rather than chase headfakes unnecessary over time. (Mystery chart was SPX default chart from 12/31/1999-7/1/2003, highlighting the dotcom bubble.)
Each week the analysts at NDW review and comment on all major asset classes in the global markets. Shown below is the summary or snapshot of the primary technical indicators we follow for multiple areas. Should there be changes mid-week we will certainly bring these to your attention via the report.
| Universe | BP Col & Level (actual) | BP Rev Level | PT Col & Level (actual) | PT Rev Level | HiLo Col & Level (actual) | HiLo Rev Level | 10 Week Col & Level (actual) | 10 Week Rev Level | 30 Week Col & Level (actual) | 30 Week Rev Level |
|---|---|---|---|---|---|---|---|---|---|---|
| ALL |
|
42% |
|
38% |
|
74% |
|
54% |
|
48% |
| NYSE |
|
56% |
|
54% |
|
80% |
|
74% |
|
60% |
| OTC |
|
36% |
|
34% |
|
70% |
|
50% |
|
44% |
| World |
|
46% |
|
44% |
|
|
|
58% |
|
54% |

Remember, these are technical comments only. Just as you must be aware of fundamental data for the stocks we recommend based on technical criteria in the report, so too must you be aware of important data regarding delivery, market moving government releases, and other factors that may influence commodity pricing. We try to limit our technical comments to the most actively traded contracts in advance of delivery, but some contracts trade actively right up to delivery while others taper off well in advance. Be sure you check your dates before trading these contracts. For questions regarding this section or additional coverage of commodities email james.west@nasdaq.com.
Data represented in the table below is through 1/27/26:
| Symbol | Name | Price | PnF Trend | RS Signal | RS Col. | 200 Day MA | Weekly Mom |
|---|---|---|---|---|---|---|---|
| CL/ | Crude Oil Continuous | 62.39 | Negative | Sell | O | 62.17 | + 5W |
| DBLCIX | Deutsche Bank Liquid Commodities Index | 468.52 | Positive | Sell | O | 460.74 | - 29W |
| DWACOMMOD | NDW Continuous Commodity Index | 1127.59 | Positive | Buy | O | 1008.66 | + 2W |
| GC/ | Gold Continuous | 5082.60 | Positive | Buy | X | 3743.02 | + 4W |
| HG/ | Copper Continuous | 5.83 | Positive | Buy | X | 5.00 | - 1W |
| ZG/ | Corn (Electronic Day Session) Continuous | 426.50 | Positive | Sell | O | 427.60 | - 5W |

Average Level
50.43
| < - -100 | -100 - -80 | -80 - -60 | -60 - -40 | -40 - -20 | -20 - 0 | 0 - 20 | 20 - 40 | 40 - 60 | 60 - 80 | 80 - 100 | 100 - > |
|---|---|---|---|---|---|---|---|---|---|---|---|
|
Buy signalVOOV
|
Buy signalefa
|
||||||||||
|
Buy signalagg
|
Buy signaldia
|
Buy signalijr
|
Buy signalgsg
|
||||||||
|
Sell signallqd
|
Buy signalVOOG
|
Buy signalhyg
|
Buy signalEEM
|
||||||||
|
Buy signalXLG
|
Buy signalONEQ
|
Buy signalIJH
|
Buy signalfxe
|
||||||||
|
Buy signalshy
|
Buy signalQQQ
|
Buy signaliwm
|
Buy signaluso
|
Buy signalgcc
|
|||||||
|
Sell signaldx/y
|
Sell signalief
|
Sell signaltlt
|
Sell signalicf
|
Buy signalSPY
|
Buy signalrsp
|
Buy signaldvy
|
Buy signalGLD
|
||||
| < - -100 | -100 - -80 | -80 - -60 | -60 - -40 | -40 - -20 | -20 - 0 | 0 - 20 | 20 - 40 | 40 - 60 | 60 - 80 | 80 - 100 | 100 - > |
| AGG | iShares US Core Bond ETF |
| USO | United States Oil Fund |
| DIA | SPDR Dow Jones Industrial Average ETF |
| DVY | iShares Dow Jones Select Dividend Index ETF |
| DX/Y | NYCE U.S.Dollar Index Spot |
| EFA | iShares MSCI EAFE ETF |
| FXE | Invesco CurrencyShares Euro Trust |
| GLD | SPDR Gold Trust |
| GSG | iShares S&P GSCI Commodity-Indexed Trust |
| HYG | iShares iBoxx $ High Yield Corporate Bond ETF |
| ICF | iShares Cohen & Steers Realty ETF |
| IEF | iShares Barclays 7-10 Yr. Tres. Bond ETF |
| LQD | iShares iBoxx $ Investment Grade Corp. Bond ETF |
| IJH | iShares S&P 400 MidCap Index Fund |
| ONEQ | Fidelity Nasdaq Composite Index Track |
| QQQ | Invesco QQQ Trust |
| RSP | Invesco S&P 500 Equal Weight ETF |
| IWM | iShares Russell 2000 Index ETF |
| SHY | iShares Barclays 1-3 Year Tres. Bond ETF |
| IJR | iShares S&P 600 SmallCap Index Fund |
| SPY | SPDR S&P 500 Index ETF Trust |
| TLT | iShares Barclays 20+ Year Treasury Bond ETF |
| GCC | WisdomTree Continuous Commodity Index Fund |
| VOOG | Vanguard S&P 500 Growth ETF |
| VOOV | Vanguard S&P 500 Value ETF |
| EEM | iShares MSCI Emerging Markets ETF |
| XLG | Invesco S&P 500 Top 50 ETF |

| Symbol | Company | Sector | Current Price | Action Price | Target | Stop | Notes |
|---|---|---|---|---|---|---|---|
| LAMR | Lamar Advertising Company | Media | $128.17 | 120s - low 130s | 158 | 110 | 4 for 5'er, top half of MEDI sector matrix, LT pos peer & mkt RS, spread triple top 4.8% yield, Earn 2/20 |
| BCO | The Brink's Company | Protection Safety Equipment | $125.48 | mid 110s - low 120s | 152 | 104 | 5 for 5'er, top half of PROT sector matrix, LT pos peer & mkt RS, spread triple top, R-R>2.0, Earn. 2/25 |
| CBRE | CBRE Group, Inc. | Real Estate | $169.39 | hi 150s - lo 170s | 188 | 134 | 5 TA rating, top 10% of REAL sector matrix, LT RS buy, consec buy signals, Earn. 2/12 |
| IMAX | Imax Corporation | Media | $34.75 | 33 - hi 30s | 53 | 26 | 5 TA rating, top 20% of Media sector matrix, LT pos trend, consec buy signals, buy-on-pullback, Earn. 2/18 |
| FIX | Comfort Systems U.S.A. | Building | $1160.38 | 960 - mid 1100s | 1376 | 864 | 5 TA rating, top 10% of BUIL sector matrix, LT mkt RS buy, consec buy signals, Earn. 2/19 |
| WFC | Wells Fargo & Company | Banks | $88.71 | mid 80s - low 90s | 128 | 76 | 5 for 5'er, top 25% of BANK sector matrix, LT pos peer & mkt RS, buy on pullback, R-R~3.0 |
| JPM | J.P. Morgan Chase & Co. | Banks | $300.31 | lo 300s - mid 320s | 380 | 256 | 5 TA rating, top 25% of favored BANK sector matrix, LT RS buy, LT pos trend, buy-on-pullback |
| AER | AerCap Holdings NV | Aerospace Airline | $143.86 | mid 130 - mid 140 | 167 | 118 | 5/5'er since 4/25, LT pos. mkt and peer RS since '22, buy on pullback, Earn. 2/6 |
| ETR | Entergy Corporation | Utilities/Electricity | $96.58 | low-to-mid 90s | 107 | 86 | 5 for 5'er, top 20% of EUTI sector matrix, 2.7% yield Earn. 2/12 |
| BBW | Build-A-Bear Workshop, Inc. | Retailing | $60.91 | 61 - hi 60s | 101 | 50 | 5 TA rating, top 10% of RETA sector matrix, LT RS buy, recent pos trend, consec buy signals, buy on pullback |
| BWA | BorgWarner Inc. | Autos and Parts | $48.43 | mid-to-hi 40s | 83 | 40 | 4 for 5'er, top 20% of AUTO sector matrix, multiple buy signals, R-R>4.0, 1.4% yield, Earn. 2/11 |
| JLL | Jones Lang LaSalle Incorporated | Real Estate | $356.03 | 340s - 350s | 416 | 308 | 5 for 5'er, #2 of 121 in REAL sector matrix, LT pos peer & mkt RS, triple top, Earn. 2/18 |
| HWC | Hancock Whitney Corp | Banks | $67.44 | 64 - lo 70s | 90 | 54 | 5 TA rating, top half of BANK sector matrix, LT RS buy, consec buy signals, buy-on-pullback |
| STLD | Steel Dynamics Inc. | Steel/Iron | $175.65 | 170s - low 180s | 218 | 148 | 5 for 5'er, top half of favored STEE sector matrix, LT pos peer RS, buy on pullback |
| Symbol | Company | Sector | Current Price | Action Price | Target | Stop | Notes |
|---|
| Symbol | Company | Sector | Current Price | Action Price | Target | Stop | Notes |
|---|---|---|---|---|---|---|---|
| HLT | Hilton Worldwide Holdings Inc | Leisure | $296.17 | hi 260s - low 280s | 328 | 240 | Removed for earnings. Earn. 2/11 |
| Comment | |||||||
|---|---|---|---|---|---|---|---|
|
|
|||||||
STLD Steel Dynamics Inc. R ($173.85) - Steel/Iron - STLD is a 5 for 5'er that ranks in the top half of the favored steel/iron sector matrix and has been on a peer RS buy signal since 2014. After briefly falling to a sell signal, STLD rallied, returning to a buy signal in last week's trading with a double top break at $178 and continued higher to notch a new all-time high at $184. The stock has subsequently pulled back to near the middle of its trading band, two boxes above prior support, offering an entry point for long exposure. Positions may be added in the $170s to low $180s and we will set our initial stop at $148, which would take out multiple levels of support on STLD's chart. We will use the bullish price objective, $218, as our target price. STLD also carries a 1.2% yield.
| 26 | |||||||||||||||||||||||||||||
| 184.00 | X | 184.00 | |||||||||||||||||||||||||||
| 182.00 | X | O | 182.00 | ||||||||||||||||||||||||||
| 180.00 | X | O | 180.00 | ||||||||||||||||||||||||||
| 178.00 | X | X | O | 178.00 | |||||||||||||||||||||||||
| 176.00 | X | O | 1 | X | O | 176.00 | |||||||||||||||||||||||
| 174.00 | X | X | O | X | O | X | O | 174.00 | |||||||||||||||||||||
| 172.00 | X | X | O | X | O | X | O | X | O | 172.00 | |||||||||||||||||||
| 170.00 | C | O | X | O | X | O | O | X | Mid | 170.00 | |||||||||||||||||||
| 168.00 | X | O | X | O | X | O | • | 168.00 | |||||||||||||||||||||
| 166.00 | X | O | X | O | • | 166.00 | |||||||||||||||||||||||
| 164.00 | X | X | O | • | 164.00 | ||||||||||||||||||||||||
| 162.00 | X | O | X | • | 162.00 | ||||||||||||||||||||||||
| 160.00 | X | O | X | • | 160.00 | ||||||||||||||||||||||||
| 158.00 | X | O | X | X | • | 158.00 | |||||||||||||||||||||||
| 156.00 | X | X | O | X | O | X | • | 156.00 | |||||||||||||||||||||
| 154.00 | X | O | X | B | X | O | X | • | 154.00 | ||||||||||||||||||||
| 152.00 | X | O | X | O | O | • | 152.00 | ||||||||||||||||||||||
| 150.00 | X | O | • | 150.00 | |||||||||||||||||||||||||
| 148.00 | X | X | X | • | 148.00 | ||||||||||||||||||||||||
| 146.00 | X | O | X | O | X | • | Bot | 146.00 | |||||||||||||||||||||
| 144.00 | X | O | X | O | X | • | 144.00 | ||||||||||||||||||||||
| 142.00 | A | O | O | • | 142.00 | ||||||||||||||||||||||||
| 140.00 | X | • | 140.00 | ||||||||||||||||||||||||||
| 138.00 | X | • | 138.00 | ||||||||||||||||||||||||||
| 136.00 | • | X | X | X | • | 136.00 | |||||||||||||||||||||||
| 134.00 | X | • | X | O | X | O | X | • | 134.00 | ||||||||||||||||||||
| 132.00 | X | O | X | O | X | O | X | • | 132.00 | ||||||||||||||||||||
| 130.00 | X | O | X | O | O | • | 130.00 | ||||||||||||||||||||||
| 128.00 | X | 9 | • | • | 128.00 | ||||||||||||||||||||||||
| 126.00 | X | • | 126.00 | ||||||||||||||||||||||||||
| 124.00 | X | • | 124.00 | ||||||||||||||||||||||||||
| 122.00 | X | • | 122.00 | ||||||||||||||||||||||||||
| 26 |
| CVNA Carvana Company ($407.66) - Autos and Parts - CVNA reversed into Os and broke a double bottom at $424 as shares fell to $376, returning the stock to a sell signal and violating additional levels of support. While the stock will still maintain a 5 TA rating, the market and peer RS charts will now reside within one box of reversing into Os. From here, support now lies at $348, the bullish support line. |
| GD General Dynamics Corporation ($356.42) - Aerospace Airline - GD slipped on their most recent earnings call as investors were largely disappointed by bottom line forecasts. The 3/5'er is still up 5%+ so far this year and the move brings it back down to a range of support.... so the technical picture is far from "weak" as we wrap up January. From here, the reversal lower identifies some now resistance at $368. |
| GEV GE Vernova Inc. ($712.45) - Utilities/Electricity - GEV broke a quadruple top at $704 to return to a buy signal as shares rallied to $720. The stock is a 5 for 5'er that ranks within the top quintile of the Electric Utilities sector matrix. Okay to consider here on the breakout or on a pullback to the upper $600 range. Initial support lies at $648, while additional can be found in the $608 to $624 range on the default chart. |
| MAR Marriott International, Inc. ($312.00) - Leisure - MAR broke a double bottom at $312 to initiate a shakeout pattern. The stock is a 5 for 5'er that ranks within the top half of the Leisure sector matrix. The action point for the shakeout pattern occurs with the reversal back into Xs, currently at $324, while the pattern would be complete upon the triple top break at $332. Initial support lies at $248, while the bullish support line sits at $280. |
| SHEL Shell PLC Sponsored ADR ($75.77) - Oil - SHEL returned to a buy signal Wednesday when it broke a double top at $76. The move adds to an already positive technical picture as SHEL is a 4 for 5'er that ranks in the top half of the oil sector matrix. From here, the next level of resistance sits at $77. Meanwhile, support can be found at $69. SHEL is expected to report earnings on 2/5. |
| VSAT Viasat Inc ($46.89) - Telephone - VSAT moved higher Wednesday to break a double top at $47 before reaching a hew multi-year high at $48 intraday. This marks the fourth consecutive buy signal for this 5 for 5 TA stock that has been in a positive trend since last June. The long-term technical picture remains strong and the near-term picture has shown consistent improvement. However, VSAT is nearing overbought territory. Initial support is seen at $41 with further support at $38. Note that earnings are expected on 2/5. |
| Name | Option Symbol | Action | Stop Loss |
|---|---|---|---|
| The TJX Companies, Inc. - $147.35 | O: 26D145.00D17 | Buy the April 145.00 calls at 8.45 | 134.00 |
| Name | Option | Action |
|---|---|---|
| Corning Incorporated ( GLW) | Feb. 87.50 Calls | Stopped at 19.95 (CP: 16.40) |
| CME Group, Inc. ( CME) | Mar. 270.00 Calls | Raise the option stop loss to 16.30 (CP: 18.30) |
| Name | Option Symbol | Action | Stop Loss |
|---|---|---|---|
| Kimberly-Clark Corporation - $99.29 | O: 26P100.00D17 | Buy the April 100.00 puts at 5.20 | 112.00 |
| Name | Option | Action |
|---|---|---|
| Paypal Holdings Inc ( PYPL) | Mar. 60.00 Puts | Raise the option stop loss to 4.75 (CP: 6.75) |
| EOG Resources, Inc. ( EOG) | Mar. 110.00 Puts | Stopped at 5.20 (CP: 4.20) |
| Name | Option Sym. | Call to Sell | Call Price | Investment for 500 Shares | Annual Called Rtn. | Annual Static Rtn. | Downside Protection |
|---|---|---|---|---|---|---|---|
| Alcoa Inc. $ 59.66 | O: 26C60.00D20 | Mar. 60.00 | 4.90 | $ 27,965.40 | 44.37% | 44.37% | 7.06% |
| Name | Action |
|---|---|
| Dexcom Inc. ( DXCM) - 73.67 | Sell the February 70.00 Calls. |
| Semtech Corporation ( SMTC) - 79.49 | Sell the February 80.00 Calls. |
| Alphabet Inc. Class A ( GOOGL) - 334.55 | Sell the May 335.00 Calls. |
| Carnival Corporation ( CCL) - 28.69 | Sell the April 29.00 Calls. |
| Name | Covered Write |
|---|---|
| On Semiconductor Corp. ( ON - 62.63 ) | March 60.00 covered write. |
| Dollar Tree, Inc. ( DLTR - 121.84 ) | March 125.00 covered write. |
Daily Equity & Market Analysis
NDW MORNING UPDATE
Jan 28, 2026
Loading, Please Wait...
