Most Requested Symbols

Today we find a handful of lower attribute stocks that may be points of emerging strength as we open 2026.
With 2025 almost wrapped up, how has this year lived up to or defied expectations, and what could we expect from the market next year?
The open of the new year will undoubtedly bring with it the desire for many of your clients to put new money to work. While you can try your hardest to tell them that the turn of a calendar doesn’t automatically bring with it a complete change in leadership, you’d be best suited to have at least a couple of ideas for your end of year client conversations that aren’t Google or Nvidia. Today’s pulse will attempt to slice stock selection in a slightly different manner…. By looking underneath the hood of the S&P 500 to determine what “lower” attribute stocks have interesting technical pictures as we open 2026. While it goes without saying that we will still will prioritize long exposure to those names that earn higher technical attribute scores (4 or 5), use today’s list as the starting point for building out a list of names to watch in the new year.
As a starting point, we will detail our criteria for today’s screen before highlighting a select few. Utilizing the S&P 500 as our starting universe, we then screened for 1, 2 & 3 TA score stocks that broke back to a positive trend in the last 30 days. From there, we focused on those names that have posted a pair of buy signals on their default chart and aren’t in “heavily overbought territory” (Weekly OBOS reading of <70%.) This yields a total of 14 names, the entirety of which is below. No stock on this list has been a super high flier in 2025 (as you would expect), but the previously mentioned screen helps weed out those lower RS names that might be gaining favor…. The entire point of this endeavor.
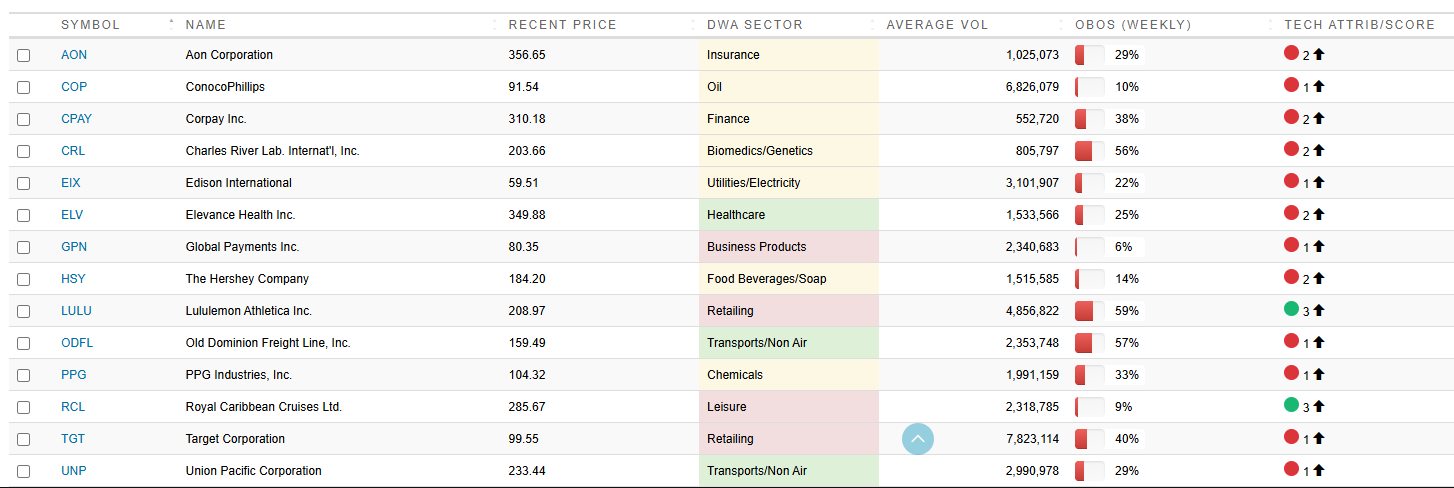
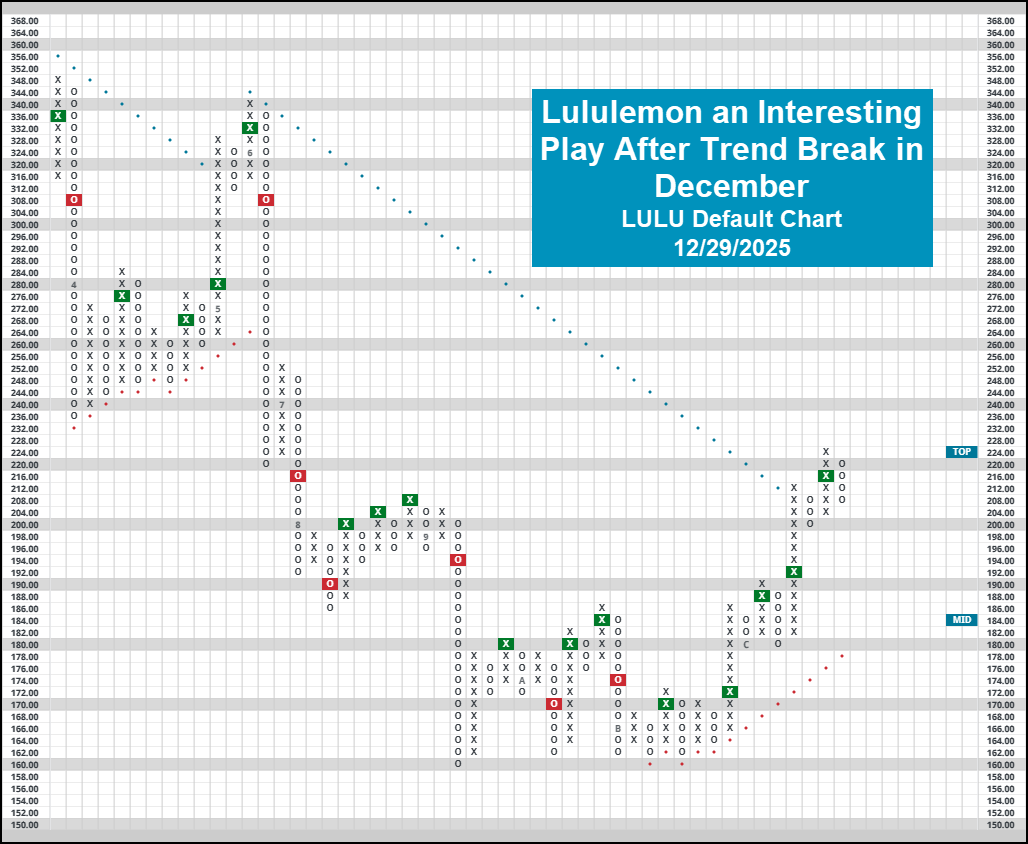
The worst performing name on the list in 2025 has perhaps the most compelling technical picture of the bunch. Lululemon (LULU) has gotten cut roughly in half in 2025, falling 45% throughout the year. Despite this, the now 3/5’er has rattled off a string of five consecutive buy signals on its default chart, earning near term strength against the market and its peer group in the process. Having pulled back into O’s after breaking back into a positive trend on 12/12, the athleisure giant now has support offered just below current levels at $200. Chart action is sparce between here and the ~$250’s, a point not out of the question if the name can find a way to rebound in 2026.
Healthcare has also improved quite notably in the past few months, seeing the sector score strongly across the Asset Class Group Scores page. With that said, you could look for focused exposure to Charles River Lab Intl. (CRL), which recently broke out to new 2025 highs in December. Recent action leaves support just below current levels at $192, confirming the positive trend break from the start of December. From here, a journey up above the top of the current trading band ($216+) would bring it to levels seen to close out 2024.

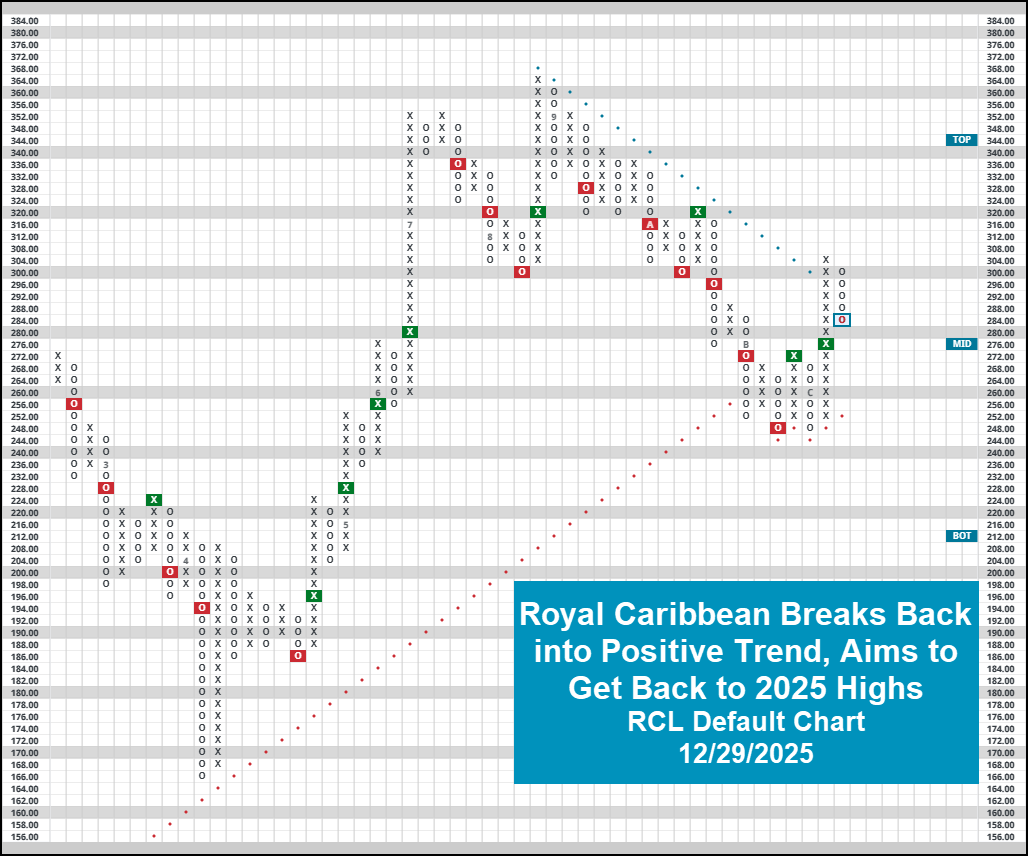
Finally, we will highlight another 3/5’er, the only of the 14 from our screen to actually beat the S&P 500 YTD. Despite trading well off 2025 highs, Royal Caribbean RCL broke back into a positive trend just before Christmas, posting a pair of buy signals in the process. The cruise liner seems to have found some strong support around $250. It earns 3/5 technical attribute points and trades just one box above the middle of its trading band. From here, a trip back to 2025 highs at $364 is certainly within reason. A move to those levels would represent a roughly 28% gain offering an attractive risk/reward profile with support just 12% away from the current price.
Remember, our long-term preference will always prioritize those names which earn further technical favor than the ones discussed today. The bulk of your portfolio should consist of high RS options, those that earn 4 or 5 technical attributes. However, that doesn’t mean that you shouldn’t continue to look for options that may be gaining relative strength, especially as we turn the page into the new year.

When making predictions about the market, it’s easy to get caught thinking that it will move closely around its average, with year-ahead analyst estimates for the S&P 500 usually ranging closely around 10% from current levels. However, for better or for worse, the market rarely tends to do what most people expect it to. Going back to 1950, the S&P 500 has gained a “normal” return between 5% and 15% in only 18% of calendar years. Put differently, the market has an “abnormal” year 82% of the time, meaning that we should expect the unexpected more often than not as investors. In fact, the last time we saw a “normal year” from the market was 2016 in which SPX gained 12%. With this year almost wrapped up, how has 2025 lived up to or defied expectations, and what could we expect from the market next year?
Despite some early year jitters in the market, such as the DeepSeek announcement and Liberation Day, it’s been another solid year for the S&P 500. Specifically, the index has gained 19.32% on a total return basis, which is better than roughly two-thirds of years for the index. 2025 now marks the third consecutive year with at least an 18% gain in the S&P 500 and the sixth such year to occur in the last seven years.

While the S&P 500 once again had a great year, it was by no means the only index to rise on the year. Growth stocks continue to be some of the strongest areas within Domestic Equities, seeing the Nasdaq-100 gain 22.9% YTD. Meanwhile, small caps also had a solid year, with the Russell 2000 gaining 15.1% as it returned to new all-time highs. Comparing this year’s return to the indices’ rolling one-year returns (not just calendar year) since 1950 or their respective inceptions, the S&P 500 performed the best of the three relative to its previous years. SPX’s 2025 return was better than 66.1% of other one-year periods for S&P 500, while NDX and RUT were better than roughly 56% of previous one-year periods. Overall, domestic equity indices have been solid this year, but their returns weren’t extremely abnormal, unlike some other areas of the market

Several groups did have more eyepopping numbers in 2025, with both international equities and precious metals outshining US Stocks. ACWX gained more than 33% for its best year since 2009, in addition to being in the 94th percentile one-year returns for the fund. Additionally, gold has seen a herculean YTD rise of 72.48%, placing the last twelve months in the 98% percentile of 1Y returns for gold. Said differently, a year this good for gold has only come around once every fifty years.

While investors love to see returns, the unfortunate reality of investing is that volatility is the price we pay for gains. Historically, there's a ~21% chance the SPX ends the year lower on a total return basis. Meanwhile, the index falls by at least 9.2% in roughly 10% of years, with some of those instances like 2022 seeing even further downside. Additionally, the market often dips before returning back to all-time highs. Despite the median year for SPX seeing the index gain 13.5%, the market still sees a 10% correction in roughly half of all years. Even this year, SPX was able to gain nearly 20% despite seeing a drawdown (peak-to-trough decline) in April of 18.7%. Understanding the potential and likelihood of those dips before they occur can help prepare investors—advisors and individuals alike—for those inevitable pauses in upside.

Asset classes differ not only in their returns but also in the severity of their declines. Fixed income has been a laggard over the last several years, but the group is historically the least prone to movement—both to the downside and upside—making them a less risky bet than the other assets in the table. Conversely, the Nasdaq-100 averaged the highest returns by a wide margin, but the group is also more prone to sharp one-year drawdowns. NDX and RUT are more than four times as likely to see a 35% drawdown in a year relative to SPX. In no way are we predicting a decline of that magnitude in 2026, but it does demonstrate the higher magnitude of movement for the two indices.
History can provide us with a baseline of what outcomes are possible in the coming year, while relative strength can provide insight into which of those outcomes is more likely. Domestic equities continue to hold the most long-term relative strength of any asset class, with international equities and precious metals continuing to look strong as well. All three groups look primed to for a solid 2026 if they’re able to maintain their strength. Meanwhile, risk-on areas like technology and growth stocks continue to lead the way to the upside. While anything could happen to the market next year, especially with investor anxiety over AI expenditure and elevated valuations, the weight of the technical evidence continues to signal a green light for the broader market entering the new year.
Average Level
11.64
| < - -100 | -100 - -80 | -80 - -60 | -60 - -40 | -40 - -20 | -20 - 0 | 0 - 20 | 20 - 40 | 40 - 60 | 60 - 80 | 80 - 100 | 100 - > |
|---|---|---|---|---|---|---|---|---|---|---|---|
|
Buy signaliwm
|
|||||||||||
|
Buy signalXLG
|
|||||||||||
|
Buy signalVOOG
|
|||||||||||
|
Buy signalijr
|
|||||||||||
|
Buy signalhyg
|
Buy signalefa
|
||||||||||
|
Buy signalshy
|
Buy signalgsg
|
Buy signalSPY
|
|||||||||
|
Sell signalicf
|
Buy signalEEM
|
Buy signalIJH
|
|||||||||
|
Sell signaluso
|
Buy signaldvy
|
Buy signalrsp
|
|||||||||
|
Sell signaltlt
|
Buy signalagg
|
Buy signalQQQ
|
Buy signalVOOV
|
Buy signalgcc
|
|||||||
|
Sell signaldx/y
|
Sell signalief
|
Sell signallqd
|
Buy signalONEQ
|
Buy signaldia
|
Buy signalfxe
|
Buy signalGLD
|
|||||
| < - -100 | -100 - -80 | -80 - -60 | -60 - -40 | -40 - -20 | -20 - 0 | 0 - 20 | 20 - 40 | 40 - 60 | 60 - 80 | 80 - 100 | 100 - > |
| AGG | iShares US Core Bond ETF |
| USO | United States Oil Fund |
| DIA | SPDR Dow Jones Industrial Average ETF |
| DVY | iShares Dow Jones Select Dividend Index ETF |
| DX/Y | NYCE U.S.Dollar Index Spot |
| EFA | iShares MSCI EAFE ETF |
| FXE | Invesco CurrencyShares Euro Trust |
| GLD | SPDR Gold Trust |
| GSG | iShares S&P GSCI Commodity-Indexed Trust |
| HYG | iShares iBoxx $ High Yield Corporate Bond ETF |
| ICF | iShares Cohen & Steers Realty ETF |
| IEF | iShares Barclays 7-10 Yr. Tres. Bond ETF |
| LQD | iShares iBoxx $ Investment Grade Corp. Bond ETF |
| IJH | iShares S&P 400 MidCap Index Fund |
| ONEQ | Fidelity Nasdaq Composite Index Track |
| QQQ | Invesco QQQ Trust |
| RSP | Invesco S&P 500 Equal Weight ETF |
| IWM | iShares Russell 2000 Index ETF |
| SHY | iShares Barclays 1-3 Year Tres. Bond ETF |
| IJR | iShares S&P 600 SmallCap Index Fund |
| SPY | SPDR S&P 500 Index ETF Trust |
| TLT | iShares Barclays 20+ Year Treasury Bond ETF |
| GCC | WisdomTree Continuous Commodity Index Fund |
| VOOG | Vanguard S&P 500 Growth ETF |
| VOOV | Vanguard S&P 500 Value ETF |
| EEM | iShares MSCI Emerging Markets ETF |
| XLG | Invesco S&P 500 Top 50 ETF |

| Symbol | Company | Sector | Current Price | Action Price | Target | Stop | Notes |
|---|---|---|---|---|---|---|---|
| AIT | Applied Industrial Technologies, Inc. | Machinery and Tools | $264.78 | mid 240s - ow 260s | 316 | 208 | 5 for 5'er, top half of favored MACH sector matrix, LT pos peer & mkt RS, pos trend flip |
| BAC | Bank of America | Banks | $56.17 | 49 - 54 | 67 | 44 | 4 for 5'er, top 25% of favored BANK sector matrix, LT pos peer RS, bullish catapult, 2.1% yield, Earn. 1/14 |
| CME | CME Group, Inc. | Wall Street | $276.73 | 260s - 270s | 312 | 224 | 4 for 5'er, middle of WALL sector matrix, triple top breakout, 1.8% yield |
| AFL | AFLAC Incorporated | Insurance | $109.90 | 108 - 115 | 143 | 95 | 4 for 5'er, top half of INSU sector matrix, LT pos peer & mkt RS, spread triple top, 2% yield |
| GFI | Gold Fields Limited (South Africa) ADR | Precious Metals | $46.56 | 40 - 44 | 58 | 35 | 4 for 5'er, top third of PREC sector matrix, LT pos peer & mkt RS, good R-R, 1.8% yield |
| CINF | Cincinnati Financial Corporation | Insurance | $164.79 | mid 150s - hi 160s | 206 | 134 | 4 TA rating, top 33% of INSU sector matrix, LT mkt RS buy, yield > 2%, pos momentum, buy-on-pullback |
| LAMR | Lamar Advertising Company | Media | $126.55 | 120s - low 130s | 158 | 110 | 4 for 5'er, top half of MEDI sector matrix, LT pos peer & mkt RS, spread triple top 4.8% yield |
| ABCB | Ameris Bancorp | Banks | $76.00 | 70s | 92 | 77 | 5 for 5'er, top 25% of BANK sector matrix, LT pos peer RS, spread quintuple top, 1.1% yield |
| ORI | Old Republic International | Insurance | $46.58 | lo-mid 40s | 76 | 384 | 4 TA rating, top 20% of insurance sector RS matrix, consec buy signals, recent RS buy, R-R > 4, Earn. 1/22 |
| LAZ | Lazard Inc. | Wall Street | $50.04 | hi 40s - low 50s | 69 | 41 | 5 for 5'er, middle of WALL sector matrix, LT pos peer & mkt RS, triple top, buy on pullback, good R-R |
| HLT | Hilton Worldwide Holdings Inc | Leisure | $293.48 | hi 260s - low 280s | 328 | 240 | 5 for 5'er, top half of LEIS sector matrix LT pos peer & mkt RS, quintuple top |
| HCA | HCA Healthcare Inc. | Healthcare | $477.13 | 450s - lo 500s | 588 | 384 | 5 TA rating, top 20% of HEAL sector matrix, LT RS buy, LT peer RS buy, consec buy signals, buy-on-pullback, Earn. 1/23 |
| LECO | Lincoln Electric Holdings, Inc. | Machinery and Tools | $246.47 | 240s | 320 | 196 | 5 for 5'er, top third of favored MACH sector matrix, LT pos peer & mkt RS, triple top, 1.3% yield |
| PII | Polaris Inc. | Leisure | $66.25 | mid-to-hi 60s | 77 | 59 | 4 for 5'er, top 10% of LEIS sector matrix, bullish catapult, pos trend flip, 3.8% yield |
| THC | Tenet Healthcare Corporation | Healthcare | $200.60 | 190 - mid 200s | 286 | 170 | 5 TA rating, top 50% of HEAL sector matrix, LT RS buy, buy-on-pullback |
| AU | AngloGold Ashanti Limited (South Africa) ADR | Precious Metals | $91.25 | low-to-mid 80s | 101 | 71 | 5 for 5'er, 4th of 30 in PREC sector matrix, LT pos peer & mkt RS, triple top, 3% yield |
| FLS | Flowserve Corporation | Machinery and Tools | $71.03 | hi 60s - lo 70s | 91 | 54 | 5 TA rating, top 10% of MACH sector matrix, LT RS buy, buy-on-pullback |
| BPOP | Popular, Inc. | Banks | $126.02 | 120s | 154 | 108 | 5 for 5'er, top third of favored BANK sector matrix, LT pos mkt & peer RS, 2.4% yield |
| BCO | The Brink's Company | Protection Safety Equipment | $119.63 | mid 110s - low 120s | 152 | 104 | 5 for 5'er, top half of PROT sector matrix, LT pos peer & mkt RS, spread triple top, R-R>2.0 |
| GOOGL | Alphabet Inc. Class A | Internet | $313.51 | 300 - hi 320s | 428 | 268 | 5 TA rating, top of INET sector matrix, LT RS buy, buy-on-pullback |
| CUBI | Customers Bancorp Inc | Banks | $75.67 | low-to-mid 70s | 89 | 63 | 4 for 5'er, top 20% of favored BANK sector matrix, RS buy signal, spread quad top, Earn. 1/22 |
| ENS | EnerSys | Electronics | $150.99 | mid 140s - low 150s | 190 | 126 | 4 for 5'er, top 20% of ELEC sector matrix, one box from RS buy signal, quadruple top |
| AAPL | Apple Inc. | Computers | $273.40 | 260s - 270s | 380 | 224 | 5 for 5'er, top 20% of COMP sector matrix, LT pos mkt RS, buy on pullback |
| Symbol | Company | Sector | Current Price | Action Price | Target | Stop | Notes |
|---|
| Comment | |||||||
|---|---|---|---|---|---|---|---|
|
|
|||||||
AAPL Apple Inc. R ($273.22) - Computers - AAPL is a 5 for 5'er that ranks sixth out of 36 names in the computers sector matrix and has been on a market RS buy signals since 2004. On its default chart, AAPL has completed five consecutive buy signals and reached a new all-time high earlier this month. The stock has subsequently pulled back to the middle of its trading band, offering an entry point for long exposure. Positions may be added in the $260s to $270s and we will set our initial stop at $224, which would take out two levels of support on AAPL's chart. Using a modified vertical price objective based on the most recent buy signal, we will set our target price at $380.
| 288.00 | X | 288.00 | |||||||||||||||||||||||||||
| 284.00 | C | O | 284.00 | ||||||||||||||||||||||||||
| 280.00 | B | O | 280.00 | ||||||||||||||||||||||||||
| 276.00 | X | O | 276.00 | ||||||||||||||||||||||||||
| 272.00 | X | O | Mid | 272.00 | |||||||||||||||||||||||||
| 268.00 | X | O | 268.00 | ||||||||||||||||||||||||||
| 264.00 | X | 264.00 | |||||||||||||||||||||||||||
| 260.00 | X | 260.00 | |||||||||||||||||||||||||||
| 256.00 | • | X | X | 256.00 | |||||||||||||||||||||||||
| 252.00 | • | • | X | O | X | 252.00 | |||||||||||||||||||||||
| 248.00 | X | • | • | X | O | X | Bot | 248.00 | |||||||||||||||||||||
| 244.00 | X | X | O | 3 | • | X | A | 244.00 | |||||||||||||||||||||
| 240.00 | X | O | X | O | X | O | • | X | X | 240.00 | |||||||||||||||||||
| 236.00 | X | O | X | O | X | O | • | 9 | O | X | 236.00 | ||||||||||||||||||
| 232.00 | X | 2 | X | O | O | • | X | O | X | 232.00 | |||||||||||||||||||
| 228.00 | X | O | O | • | X | O | 228.00 | ||||||||||||||||||||||
| 224.00 | X | O | X | • | X | 224.00 | |||||||||||||||||||||||
| 220.00 | O | X | O | • | X | 220.00 | |||||||||||||||||||||||
| 216.00 | O | X | O | • | • | X | X | 216.00 | |||||||||||||||||||||
| 212.00 | O | 4 | X | X | • | X | • | X | O | X | 212.00 | ||||||||||||||||||
| 208.00 | O | X | O | X | O | X | O | • | 7 | O | X | • | 208.00 | ||||||||||||||||
| 204.00 | • | O | X | O | X | O | X | O | 6 | • | X | 8 | • | 204.00 | |||||||||||||||
| 200.00 | • | O | X | X | O | X | 5 | X | O | X | O | X | • | 200.00 | |||||||||||||||
| 198.00 | • | O | X | O | X | O | X | O | X | O | X | O | X | • | 198.00 | ||||||||||||||
| 196.00 | • | O | X | O | X | O | X | O | X | O | X | O | • | 196.00 | |||||||||||||||
| 194.00 | • | O | X | O | X | O | X | O | O | • | 194.00 | ||||||||||||||||||
| 192.00 | • | O | X | O | X | O | X | • | 192.00 | ||||||||||||||||||||
| 190.00 | • | O | X | O | X | O | • | 190.00 | |||||||||||||||||||||
| 188.00 | O | X | O | X | • | 188.00 | |||||||||||||||||||||||
| 186.00 | O | X | O | X | • | 186.00 | |||||||||||||||||||||||
| 184.00 | O | X | O | • | 184.00 | ||||||||||||||||||||||||
| 182.00 | O | X | • | 182.00 | |||||||||||||||||||||||||
| 180.00 | O | X | • | 180.00 | |||||||||||||||||||||||||
| 178.00 | O | X | • | 178.00 | |||||||||||||||||||||||||
| 176.00 | O | X | • | 176.00 | |||||||||||||||||||||||||
| 174.00 | O | X | • | 174.00 | |||||||||||||||||||||||||
| 172.00 | O | X | • | 172.00 | |||||||||||||||||||||||||
| 170.00 | O | • | 170.00 |
| ALB Albemarle Corp ($144.80) - Chemicals - ALB gave an initial sell signal Monday when it broke a double bottom at $142. The outlook for the stock remains decidedly favorable, however, as ALB is a 5 for 5'er that ranks first out of 44 names in the chemicals sector matrix. From here, the stock shows no further support on its default chart until $118. |
| BOOT Boot Barn Holdings Inc ($179.39) - Retailing - BOOT reversed into Os and broke a double bottom at $182 for a third sell signal as shares fell to $178. The move also violates the bullish support line, which will drop the stock down to a 4 for 5'er trading in a negative trend. BOOT continues to maintain positive near and long-term relative strength against the market and peer group, while continuing to rank within the top half of the Retailing sector matrix. From here, support lies at $170, while additional can be found in the $162 to $164 range. |
| EBAY eBay Inc. ($87.46) - Retailing - Nice hold of the trendline for EBAY with the return to a PnF buy signal at $86.. The stock remains a technically acceptable 3/5'er at the time of this writing. Offensive minded players should take todays action as a sign of strength, looking towards the top of the trading band and all time highs at $100 as a possible price target. More defensive participants should wait and see until the name gets above $90, a point of stuff support from earlier this year. A rejection of this point would be a near-term negative. |
| IDR Idaho Strategic Resources Inc ($43.69) - Precious Metals - IDR fell to a sell signal Monday when it broke a double bottom at $44 amid a broad sell-off in precious metals. The outlook for the stock remains favorable as IDR is a 4 for 5'er that ranks fifth out of 30 names in the favored precious metals sector matrix. From here, the next level of support on IDR's chart sits at $42. |
| PPTA Perpetua Resources Corp. ($25.02) - Precious Metals - PPTA fell to a sell signal Monday when it broke a double bottom at $25 amid a sector wide sell-off. The technical picture remains modestly positive as PPTA is a 3 for 5'er. From here, the next level of support can be found at $21, where PPTA's bullish support line also currently sits. |

| Name | Option Symbol | Action | Stop Loss |
|---|---|---|---|
| Monster Beverage Corp. - $77.94 | O: 26C77.50D20 | Buy the March 77.50 calls at 4.50 | 72.00 |
| Name | Option | Action |
|---|---|---|
| J.P. Morgan Chase & Co. ( JPM) | Mar. 320.00 Calls | Stopped at 15.55 (CP: 13.80) |
| NVIDIA Corporation ( NVDA) | Mar. 180.00 Calls | Stopped at 16.55 (CP: 15.60) |
| Name | Option Symbol | Action | Stop Loss |
|---|---|---|---|
| Bunge Limited - $89.08 | O: 26P90.00D17 | Buy the April 90.00 puts at 5.55 | 95.00 |
| Name | Option | Action |
|---|---|---|
|
|
||
| Name | Option Sym. | Call to Sell | Call Price | Investment for 500 Shares | Annual Called Rtn. | Annual Static Rtn. | Downside Protection |
|---|---|---|---|---|---|---|---|
| Estee Lauder Companies $ 107.65 | O: 26C110.00D20 | Mar. 110.00 | 6.45 | $ 50,604.90 | 34.39% | 23.69% | 4.99% |
| Name | Action |
|---|---|
| SoFi Technologies Inc. ( SOFI) - 27.07 | Sell the March 30.00 Calls. |
| Amphenol Corporation ( APH) - 137.43 | Sell the March 140.00 Calls. |
| Wayfair Inc. ( W) - 102.22 | Sell the January 100.00 Calls. |
| Micron Technology, Inc. ( MU) - 284.79 | Sell the March 260.00 Calls. |
| Fortinet Inc. ( FTNT) - 81.56 | Sell the March 85.00 Calls. |
| APA Corp ( APA) - 24.18 | Sell the March 25.00 Calls. |
| Lemonade Inc ( LMND) - 74.69 | Sell the March 80.00 Calls. |
| Intel Corporation ( INTC) - 36.20 | Sell the March 37.00 Calls. |
| Name | Covered Write |
|---|---|
| Las Vegas Sands Corp. ( LVS - 66.20 ) | March 67.50 covered write. |
| Hewlett Packard Enterprise Company ( HPE - 24.49 ) | March 25.00 covered write. |
Daily Equity & Market Analysis
NDW MORNING UPDATE
Dec 29, 2025
Loading, Please Wait...
