Most Requested Symbols

Basic Materials sit just outside of a technical overweight according to the DALI sector rankings.... but XLB still technically scores below a 3.0. Today we talk through this disagreement and steps you can take to realize what is truly leading the way.
How does 2025 stack up to other positive years, and which sectors are most sensitive to the market direction heading into 2026?
Weekly Rundown Video – Dec 17, 2025
Weekly rundown with NDW analyst team covering all major asset classes.
Weekly rundown with NDW analyst team covering all major asset classes.
Basic materials has moved impressively higher according to our broad asset ranking tools like DALI or the Asset Class Group Scores pages. For those of us looking to take advantage of this development, we might journey over to the chart page of XLB…. Only to be met with a sub optimal 1.83 fund score. This probably happens frequently for many of you, somewhat frequently finding scores/rankings that disagree with each other and make either seem useless for the purpose of putting money to work. While this can certainly induce analysis paralysis at first glance, it is important to step back and ask yourself: “What is this data point telling me that I can take advantage of?”
When other advisors see that basic materials are improving, they will blindly go and pick up exposure via XLB or in an equal weight fashion via RSPM. This is our first opportunity to go out and differ ourselves from “the other advisors.” In 2025 alone, the top tracked performer in XLB advanced 172%, a stark contrast to the worst performer which lost more than 42%. What if we could maximize exposure to the strong stocks and avoid allocation towards weak names? To test this idea, we took the tracked holdings of XLB and applied a simple overlay in the custom modeler: Only buy stocks that are “acceptable” by NDW standards, those that earn a TA score of 3 or above. This model, largely due in part to a large Q4 rally, has nearly doubled the performance of broader XLB in 2025 and demonstrates how valuable it can be for you to only focus on those stocks that demonstrate relative strength while others are forced to focus on the entire group. (note: for demonstration purposes we only focused on 2025 in our “backtest”. Note that this strategy decreases diversification and therefore increases observed risk metrics. Selecting fewer stocks may not fit the investment goals for every client.)

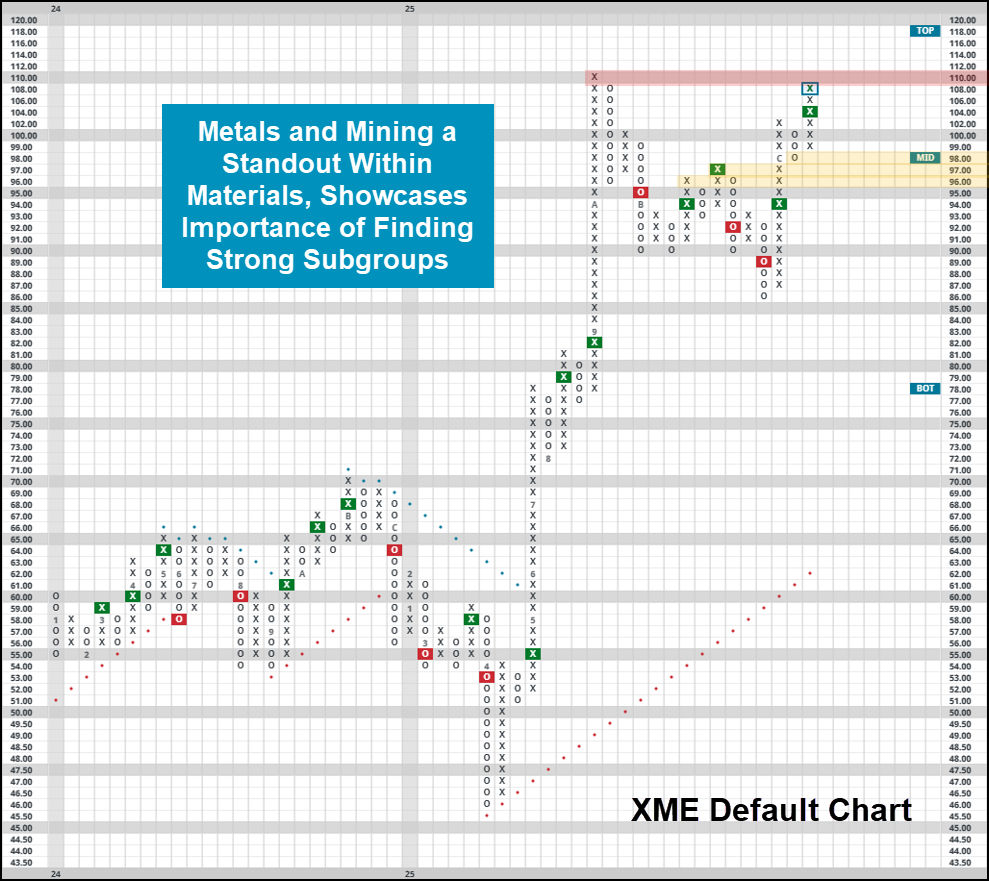
Of course, going out and focusing on a smaller subset of stocks won’t work in every scenario. In others, going out and finding the strong options is just a few clicks away. If basic materials are improving but broader funds like XLB aren’t showing a vast improvement in overall fund score, then the logical deduction is that a smaller subset of top performers must be driving the overall gain in strength. Specifically with basic materials, we know the strength to have come from metals, evidenced by Metals & Mining ETF (XME). It holds a 5.65 fund score, nearly 4 points better than XLB. Point being, by taking just an extra 5 minutes of poking around different subsectors, you can utilize NDW’s fund score system to find out where price is on your side… while others are stuck focusing on broad funds that are dragged down by a select few points of weakness.
Remember, today’s process won’t be prudent in every situation. Sometimes, like in healthcare, points of strength can drastically change the risk profile. Ditching exposure to more traditional drug providers in exchange for high octane biotech names can get dicey quickly. Keep this in mind when considering options outside of your run of the mill sector exposure, and as always keep an eye on the charts to be notified when price changes materially.

As investors and advisors, whether we get a positive or negative year from the market can significantly impact portfolio outcomes. With the advantage of hindsight, we know that 2025 has been a positive year for markets. Unfortunately, as we look ahead to the new year, we can’t have the same confidence in whether the S&P 500 will have its fourth consecutive positive year or not. With all that in mind, how does 2025 stack up to other positive years, and which sectors are most sensitive to the market direction heading into 2026?
While the S&P 500 has averaged a 10% return since 1992, it usually performs far better during a positive year. Specifically, if the S&P 500 is positive, it averages a gain of more than 18%. That means that despite the index gaining 16.2% this year, 2025 has been below average for a positive year! The S&P 500 is arguably the most important index, but most advisors allocate beyond broad market exposure. While indices are sensitive to up or down markets, sectors can be more dependent on the direction of the market. Given many investors' tactical allocation, how have the major sectors performed in 2025 relative to other positive years, and how heavily are they impacted by the market’s performance?
While this year has been positive, market leadership has been dominated by technology, as the iShares U.S. Tech. ETF (IYW) is up 25.2%, which is the most of the major sector iShares funds. However, IYW has historically averaged a gain of 31.6% when the S&P 500 is positive, meaning that even tech has underwhelmed compared to other positive years. Looking at the lineup of other iShares major sector funds, in addition to the Fidelity Communications Services ETF (FCOM), technology was not alone in its subdued performance. In fact, only three of the eleven major sectors—communication services, basic materials (IYM), and utilities (IDU)—have exceeded their historical averages in past years SPX was positive.

More broadly, there’s several sectors that stand out as outperformers in positive years, many of which have had a strong 2025. Specifically, the tech, communications, consumer discretionary, and industrials sectors (in that order) average the highest return in positive years—all more than the S&P 500 as well. As a result, investors optimistic about market strength may consider overweighting these higher-beta sectors. Meanwhile, it would be a risk-on sign to see those sectors round out the top of DALI or Asset Class Group Scores’ sector rankings. With Tech, Communications, and Industrials currently sitting at the top of DALI, those sectors should continue being points of emphasis while also signaling greater confidence in the strength of the broader market.
So far, we have been focusing on what the market will do assuming it moves higher. While we’d like to see the market rise each year, that’s not an assumption we can make, unfortunately. When the S&P 500 has declined in a year, it’s usually done so by a decent margin, falling 12.6% on average since 1992. Meanwhile, the previously mentioned risk-on sectors take a larger hit, especially tech and communications, which lose 17.8% and 22.2%, respectively. Technology and communications exhibit the greatest sensitivity to market direction, with performance swings of nearly 50% and 43% between positive and negative SPX years.

On the other hand, Healthcare is the only sector not to decline on average when the S&P 500 falls, averaging a negligible 0.01% gain. Additionally, the energy, utilities, and consumer staples sectors see declines of less than 5%, positioning them as other defensive options during market downturns. Meanwhile, high rankings for these sectors in DALI or ACGS would reflect a defensive posture and signal a potential lack of strength in the market. One exception might be the energy sector, which is often driven more by movement in energy commodities than the overall market. The sector’s annual return has a correlation with the market of only 0.32. Utilities and real estate are the next closest with correlations in the low 0.50s, followed by healthcare and materials in the 0.60s. Conversely, most of the risk-on sectors carry the highest correlation with overall market performance.

Next year’s direction remains uncertain, but the market’s sensitivity to up or down movement can at least provide context on our current environment, offering insight into what next year might have in store. With risk-on sectors continuing to sit in the driver’s seat of the market, those groups should be areas of focus entering the new year, especially as they hold onto the top spots in DALI. However, areas like healthcare, staples, utilities, and energy could be groups to monitor for those cautious of a decline given the sectors’ greater isolation from the market.
Average Level
-2.57
| < - -100 | -100 - -80 | -80 - -60 | -60 - -40 | -40 - -20 | -20 - 0 | 0 - 20 | 20 - 40 | 40 - 60 | 60 - 80 | 80 - 100 | 100 - > |
|---|---|---|---|---|---|---|---|---|---|---|---|
|
Buy signaldvy
|
|||||||||||
|
Buy signalQQQ
|
Buy signaliwm
|
||||||||||
|
Buy signalVOOG
|
Buy signalijr
|
||||||||||
|
Buy signalXLG
|
Buy signaldia
|
||||||||||
|
Sell signalicf
|
Buy signalONEQ
|
Buy signalIJH
|
|||||||||
|
Sell signallqd
|
Buy signalshy
|
Buy signalEEM
|
Buy signalgcc
|
Buy signalrsp
|
|||||||
|
Buy signalagg
|
Sell signaluso
|
Buy signalhyg
|
Buy signalefa
|
Buy signalVOOV
|
|||||||
|
Sell signaltlt
|
Buy signalief
|
Sell signaldx/y
|
Buy signalgsg
|
Buy signalSPY
|
Buy signalfxe
|
Buy signalGLD
|
|||||
| < - -100 | -100 - -80 | -80 - -60 | -60 - -40 | -40 - -20 | -20 - 0 | 0 - 20 | 20 - 40 | 40 - 60 | 60 - 80 | 80 - 100 | 100 - > |
| AGG | iShares US Core Bond ETF |
| USO | United States Oil Fund |
| DIA | SPDR Dow Jones Industrial Average ETF |
| DVY | iShares Dow Jones Select Dividend Index ETF |
| DX/Y | NYCE U.S.Dollar Index Spot |
| EFA | iShares MSCI EAFE ETF |
| FXE | Invesco CurrencyShares Euro Trust |
| GLD | SPDR Gold Trust |
| GSG | iShares S&P GSCI Commodity-Indexed Trust |
| HYG | iShares iBoxx $ High Yield Corporate Bond ETF |
| ICF | iShares Cohen & Steers Realty ETF |
| IEF | iShares Barclays 7-10 Yr. Tres. Bond ETF |
| LQD | iShares iBoxx $ Investment Grade Corp. Bond ETF |
| IJH | iShares S&P 400 MidCap Index Fund |
| ONEQ | Fidelity Nasdaq Composite Index Track |
| QQQ | Invesco QQQ Trust |
| RSP | Invesco S&P 500 Equal Weight ETF |
| IWM | iShares Russell 2000 Index ETF |
| SHY | iShares Barclays 1-3 Year Tres. Bond ETF |
| IJR | iShares S&P 600 SmallCap Index Fund |
| SPY | SPDR S&P 500 Index ETF Trust |
| TLT | iShares Barclays 20+ Year Treasury Bond ETF |
| GCC | WisdomTree Continuous Commodity Index Fund |
| VOOG | Vanguard S&P 500 Growth ETF |
| VOOV | Vanguard S&P 500 Value ETF |
| EEM | iShares MSCI Emerging Markets ETF |
| XLG | Invesco S&P 500 Top 50 ETF |

| Symbol | Company | Sector | Current Price | Action Price | Target | Stop | Notes |
|---|---|---|---|---|---|---|---|
| AIT | Applied Industrial Technologies, Inc. | Machinery and Tools | $262.41 | mid 240s - ow 260s | 316 | 208 | 5 for 5'er, top half of favored MACH sector matrix, LT pos peer & mkt RS, pos trend flip |
| BAC | Bank of America | Banks | $55.27 | 49 - 54 | 67 | 44 | 4 for 5'er, top 25% of favored BANK sector matrix, LT pos peer RS, bullish catapult, 2.1% yield, Earn. 1/14 |
| CME | CME Group, Inc. | Wall Street | $269.09 | 260s - 270s | 312 | 224 | 4 for 5'er, middle of WALL sector matrix, triple top breakout, 1.8% yield |
| AFL | AFLAC Incorporated | Insurance | $110.36 | 108 - 115 | 143 | 95 | 4 for 5'er, top half of INSU sector matrix, LT pos peer & mkt RS, spread triple top, 2% yield |
| GFI | Gold Fields Limited (South Africa) ADR | Precious Metals | $45.16 | 40 - 44 | 58 | 35 | 4 for 5'er, top third of PREC sector matrix, LT pos peer & mkt RS, good R-R, 1.8% yield |
| CINF | Cincinnati Financial Corporation | Insurance | $167.34 | mid 150s - hi 160s | 206 | 134 | 4 TA rating, top 33% of INSU sector matrix, LT mkt RS buy, yield > 2%, pos momentum, buy-on-pullback |
| LAMR | Lamar Advertising Company | Media | $127.20 | 120s - low 130s | 158 | 110 | 4 for 5'er, top half of MEDI sector matrix, LT pos peer & mkt RS, spread triple top 4.8% yield |
| ABCB | Ameris Bancorp | Banks | $77.54 | 70s | 92 | 77 | 5 for 5'er, top 25% of BANK sector matrix, LT pos peer RS, spread quintuple top, 1.1% yield |
| ORI | Old Republic International | Insurance | $45.51 | lo-mid 40s | 76 | 384 | 4 TA rating, top 20% of insurance sector RS matrix, consec buy signals, recent RS buy, R-R > 4 |
| LAZ | Lazard Inc. | Wall Street | $49.68 | hi 40s - low 50s | 69 | 41 | 5 for 5'er, middle of WALL sector matrix, LT pos peer & mkt RS, triple top, buy on pullback, good R-R |
| HLT | Hilton Worldwide Holdings Inc | Leisure | $292.25 | hi 260s - low 280s | 328 | 240 | 5 for 5'er, top half of LEIS sector matrix LT pos peer & mkt RS, quintuple top |
| HCA | HCA Healthcare Inc. | Healthcare | $472.98 | 450s - lo 500s | 588 | 384 | 5 TA rating, top 20% of HEAL sector matrix, LT RS buy, LT peer RS buy, consec buy signals, buy-on-pullback |
| LECO | Lincoln Electric Holdings, Inc. | Machinery and Tools | $243.27 | 240s | 320 | 196 | 5 for 5'er, top third of favored MACH sector matrix, LT pos peer & mkt RS, triple top, 1.3% yield |
| PII | Polaris Inc. | Leisure | $69.57 | mid-to-hi 60s | 77 | 59 | 4 for 5'er, top 10% of LEIS sector matrix, bullish catapult, pos trend flip, 3.8% yield |
| THC | Tenet Healthcare Corporation | Healthcare | $196.33 | 190 - mid 200s | 286 | 170 | 5 TA rating, top 50% of HEAL sector matrix, LT RS buy, buy-on-pullback |
| AU | AngloGold Ashanti Limited (South Africa) ADR | Precious Metals | $86.20 | low-to-mid 80s | 101 | 71 | 5 for 5'er, 4th of 30 in PREC sector matrix, LT pos peer & mkt RS, triple top, 3% yield |
| FLS | Flowserve Corporation | Machinery and Tools | $71.06 | hi 60s - lo 70s | 91 | 54 | 5 TA rating, top 10% of MACH sector matrix, LT RS buy, buy-on-pullback |
| BPOP | Popular, Inc. | Banks | $124.98 | 120s | 154 | 108 | 5 for 5'er, top third of favored BANK sector matrix, LT pos mkt & peer RS, 2.4% yield |
| BCO | The Brink's Company | Protection Safety Equipment | $118.95 | mid 110s - low 120s | 152 | 104 | 5 for 5'er, top half of PROT sector matrix, LT pos peer & mkt RS, spread triple top, R-R>2.0 |
| Symbol | Company | Sector | Current Price | Action Price | Target | Stop | Notes |
|---|
| Comment | |||||||
|---|---|---|---|---|---|---|---|
|
|
|||||||
BCO The Brink's Company R ($119.77) - Protection Safety Equipment - BCO is a 5 for 5'er that ranks in the top half of the protection safety equipment sector matrix and has been on peer and market RS buy signals since 2020 and 2023, respectively. After falling to a sell signal in November, BCO rallied, returning to a buy signal with a double top break at $116 and continued higher, breaking a spread triple top at $118 and reaching a new all-time high at $122. Long exposure may be added in the mid $110s to low $120s and we will set our initial stop at $104, which would take out two levels of support on BCO's chart. We will use the bullish price objective, $152, as our target price, giving us a reward-to-risk ratio north of 2.0.
| 122.00 | X | 122.00 | |||||||||||||||||||||||||||
| 120.00 | X | 120.00 | |||||||||||||||||||||||||||
| 118.00 | A | X | 118.00 | ||||||||||||||||||||||||||
| 116.00 | 9 | O | X | X | C | 116.00 | |||||||||||||||||||||||
| 114.00 | X | O | X | O | X | O | X | X | Mid | 114.00 | |||||||||||||||||||
| 112.00 | X | O | X | O | X | O | X | O | X | 112.00 | |||||||||||||||||||
| 110.00 | X | O | O | X | O | X | O | X | 110.00 | ||||||||||||||||||||
| 108.00 | X | B | X | O | O | 108.00 | |||||||||||||||||||||||
| 106.00 | X | O | 106.00 | ||||||||||||||||||||||||||
| 104.00 | X | 104.00 | |||||||||||||||||||||||||||
| 102.00 | X | 102.00 | |||||||||||||||||||||||||||
| 100.00 | X | 100.00 | |||||||||||||||||||||||||||
| 99.00 | X | 99.00 | |||||||||||||||||||||||||||
| 98.00 | X | 98.00 | |||||||||||||||||||||||||||
| 97.00 | • | X | Bot | 97.00 | |||||||||||||||||||||||||
| 96.00 | • | • | • | X | 96.00 | ||||||||||||||||||||||||
| 95.00 | • | X | • | X | • | • | X | 95.00 | |||||||||||||||||||||
| 94.00 | • | X | O | • | X | O | X | • | X | 94.00 | |||||||||||||||||||
| 93.00 | • | X | X | O | • | X | O | X | O | X | • | 93.00 | |||||||||||||||||
| 92.00 | • | X | O | X | O | X | O | X | O | X | • | 92.00 | |||||||||||||||||
| 91.00 | • | X | O | 5 | O | 7 | O | O | X | • | 91.00 | ||||||||||||||||||
| 90.00 | X | X | O | X | O | X | O | X | • | 90.00 | |||||||||||||||||||
| 89.00 | O | 4 | O | X | X | O | X | O | X | O | X | • | 89.00 | ||||||||||||||||
| 88.00 | O | X | O | X | O | X | O | O | X | X | O | X | • | 88.00 | |||||||||||||||
| 87.00 | O | X | X | O | X | O | X | O | X | O | X | O | X | • | 87.00 | ||||||||||||||
| 86.00 | O | X | O | X | O | X | O | X | O | X | O | X | 8 | X | • | 86.00 | |||||||||||||
| 85.00 | O | X | O | X | O | X | O | X | O | X | O | • | O | • | 85.00 | ||||||||||||||
| 84.00 | O | O | X | O | X | O | X | • | O | X | • | • | 84.00 | ||||||||||||||||
| 83.00 | O | O | X | O | X | • | O | X | • | 83.00 | |||||||||||||||||||
| 82.00 | O | X | O | • | O | X | • | 82.00 | |||||||||||||||||||||
| 81.00 | O | • | • | 6 | • | 81.00 |
| BG Bunge Limited ($89.79) - Food Beverages/Soap - Shares of BG broke down, completing its fourth consecutive sell signal. Today's action saw the stock flip its trend back to negative, bringing it down to a 2 for 5'er. Those with exposure could look to sell here. Initial support is far away at $80 and $77, with resistance in the mid $80s potentially serving as another potential bounce point. |
| CCJ Cameco Corporation ($92.09) - Metals Non Ferrous - After successfully testing its bullish support line, CCJ returned to a buy signal Monday with a double top break at $94. The move adds to a modestly positive technical picture as CCJ is a 3 for 5'er. From here, the next level of overhead resistance sits at $96, while support can be found at $85. |
| FSLR First Solar, Inc. ($283.80) - Electronics - FSLR pushed higher Monday to break a spread triple top at $280 before reaching a new 52-week high at $284. This 4 for 5'er moved to a positive trend in July and sits in the top decile of the electronics sector RS matrix. The weight of the technical evidence is favorable and continues to improve. Initial support can be seen at $252, which is the current location of the bullish support line. |
| GE GE Aerospace ($316.26) - Aerospace Airline - GE pushed higher today, returning to a buy signal on its default chart at $312. The stock remains a high attribute name and can be added to around current levels. Those looing to play a bit more defensive should wait and see how the 5/5'er reacts around all time highs... perhaps set an alert for new all-time chart highs at $320. Support is now offered at $292 and $280. |
| IONS Ionis Pharmaceuticals Inc. ($81.86) - Drugs - IONS reversed back into a column of Xs and broke a double top at $82. The 5 for 5'er moved up from a 3 in September after reversing back to a buy signal against both the market and its peers. Additionally, the stock ranks in the top quintile of the drugs sector matrix. Initial support is at $77, with additional support at $69. Initial resistance is at $83, it's previous all-time high. |
| MAR Marriott International, Inc. ($314.11) - Leisure - MAR broke a double top at $312 for a fifth buy signal since April and to mark a new all-time high. The stock has been a 5 for 5'er since May of this year, trading in a positive trend since that time and maintaining positive market and peer RS since October 2023. Okay to consider here on the breakout or on a pullback below $300. Initial support lies at $284, while additional lies at $268, the bullish support line. |
| NXT Nextpower Inc. Class A ($93.60) - Oil Service - NXT returned to a buy signal and a positive trend Monday when it broke a double top at $92. The positive trend change will promote the stock to an acceptable 3 for 5'er. NXT also ranks in the top half of the favored oil service sector matrix. From here, NXT shows no additional resistance until $108; meanwhile, support can be found at $88. |
| PM Philip Morris International Inc. ($159.70) - Food Beverages/Soap - Shares of PM broke a triple top at $160, ending its streak of four consecutive sell signals. The stock lost near-term market strength in July but remains a solid 4 for 5'er given its long-term strength. From here, resistance lies at $160, $168, and $174. |

| Name | Option Symbol | Action | Stop Loss |
|---|---|---|---|
| Estee Lauder Companies - $108.70 | O: 26C105.00D20 | Buy the March 105.00 calls at 10.75 | 100.00 |
| Name | Option | Action |
|---|---|---|
| British American Tobacco Sp-Adr (United Kingdom) ADR ( BTI) | Mar. 50.00 Calls | Stopped at 7.10 (CP: 6.90) |
| Bank of America ( BAC) | Mar. 52.50 Calls | Raise the option stop loss to 2.90 (CP: 4.90) |
| Johnson Controls International PLC ( JCI) | Feb. 115.00 Calls | Raise the option stop loss to 6.40 (CP: 8.40) |
| Citigroup, Inc. ( C) | Mar. 100.00 Calls | Raise the option stop loss to 17.80 (CP: 19.80) |
| Cardinal Health, Inc. ( CAH) | Mar. 195.00 Calls | Raise the option stop loss to 14.10 (CP: 16.10) |
| Alphabet Inc. Class A ( GOOGL) | Mar. 300.00 Calls | Raise the option stop loss to 24.70 (CP: 26.70) |
| Name | Option Symbol | Action | Stop Loss |
|---|---|---|---|
| Alibaba Group Holding Ltd (China) ADR - $150.95 | O: 26N150.00D20 | Buy the February 150.00 puts at 7.95 | 166.00 |
| Name | Option | Action |
|---|---|---|
| NIKE, Inc. ( NKE) | Feb. 67.50 Puts | Raise the option stop loss to 8.15 (CP: 10.15) |
| Name | Option Sym. | Call to Sell | Call Price | Investment for 500 Shares | Annual Called Rtn. | Annual Static Rtn. | Downside Protection |
|---|---|---|---|---|---|---|---|
| Fortinet Inc. $ 80.24 | O: 26C85.00D20 | Mar. 85.00 | 4.65 | $ 38,865.85 | 34.43% | 20.21% | 4.65% |
| Name | Action |
|---|---|
| SoFi Technologies Inc. ( SOFI) - 27.24 | Sell the February 30.00 Calls. |
| Amphenol Corporation ( APH) - 135.29 | Sell the March 140.00 Calls. |
| Las Vegas Sands Corp. ( LVS) - 66.95 | Sell the February 67.50 Calls. |
| Tapestry Inc. ( TPR) - 125.42 | Sell the February 125.00 Calls. |
| Wayfair Inc. ( W) - 101.70 | Sell the January 100.00 Calls. |
| Micron Technology, Inc. ( MU) - 265.92 | Sell the March 260.00 Calls. |
| Hewlett Packard Enterprise Company ( HPE) - 24.43 | Sell the February 25.00 Calls. |
| Name | Covered Write |
|---|---|
| Tesla Inc. ( TSLA - 481.20 ) | February 450.00 covered write. |
Daily Equity & Market Analysis
NDW MORNING UPDATE
Dec 26, 2025
Loading, Please Wait...
