
Today we find a handful of lower attribute stocks that may be points of emerging strength as we open 2026.
The open of the new year will undoubtedly bring with it the desire for many of your clients to put new money to work. While you can try your hardest to tell them that the turn of a calendar doesn’t automatically bring with it a complete change in leadership, you’d be best suited to have at least a couple of ideas for your end of year client conversations that aren’t Google or Nvidia. Today’s pulse will attempt to slice stock selection in a slightly different manner…. By looking underneath the hood of the S&P 500 to determine what “lower” attribute stocks have interesting technical pictures as we open 2026. While it goes without saying that we will still will prioritize long exposure to those names that earn higher technical attribute scores (4 or 5), use today’s list as the starting point for building out a list of names to watch in the new year.
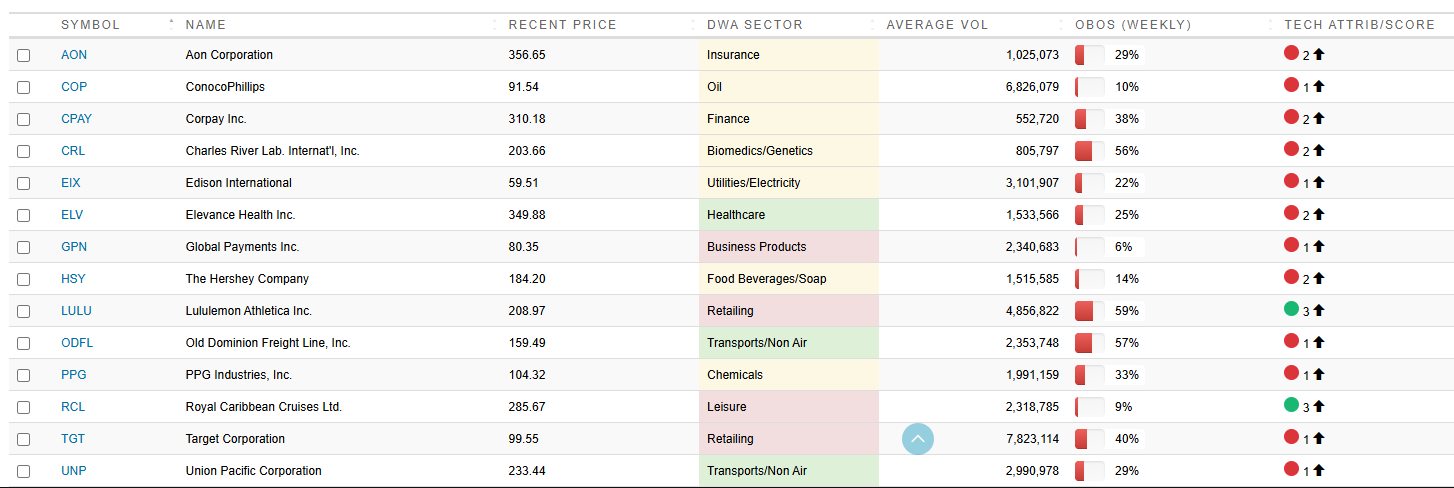
As a starting point, we will detail our criteria for today’s screen before highlighting a select few. Utilizing the S&P 500 as our starting universe, we then screened for 1, 2 & 3 TA score stocks that broke back to a positive trend in the last 30 days. From there, we focused on those names that have posted a pair of buy signals on their default chart and aren’t in “heavily overbought territory” (Weekly OBOS reading of <70%.) This yields a total of 14 names, the entirety of which is below. No stock on this list has been a super high flier in 2025 (as you would expect), but the previously mentioned screen helps weed out those lower RS names that might be gaining favor…. The entire point of this endeavor.
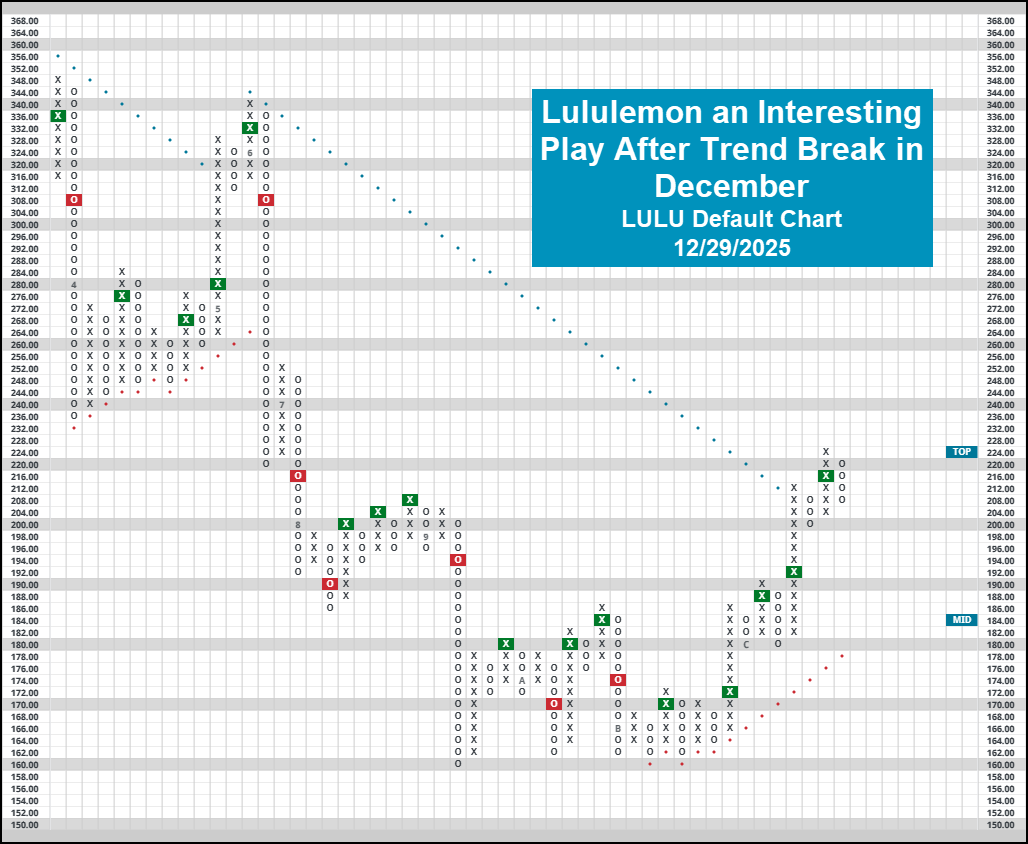
The worst performing name on the list in 2025 has perhaps the most compelling technical picture of the bunch. Lululemon (LULU) has gotten cut roughly in half in 2025, falling 45% throughout the year. Despite this, the now 3/5’er has rattled off a string of five consecutive buy signals on its default chart, earning near term strength against the market and its peer group in the process. Having pulled back into O’s after breaking back into a positive trend on 12/12, the athleisure giant now has support offered just below current levels at $200. Chart action is sparce between here and the ~$250’s, a point not out of the question if the name can find a way to rebound in 2026.
Healthcare has also improved quite notably in the past few months, seeing the sector score strongly across the Asset Class Group Scores page. With that said, you could look for focused exposure to Charles River Lab Intl. (CRL), which recently broke out to new 2025 highs in December. Recent action leaves support just below current levels at $192, confirming the positive trend break from the start of December. From here, a journey up above the top of the current trading band ($216+) would bring it to levels seen to close out 2024.

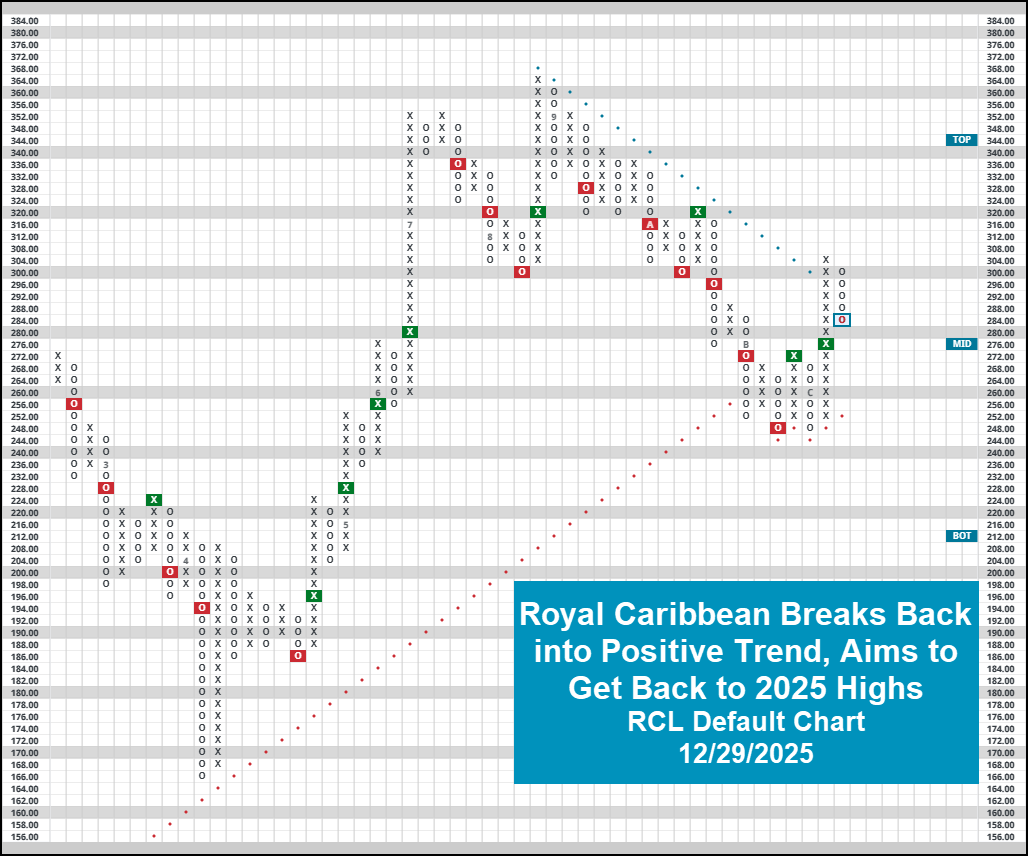
Finally, we will highlight another 3/5’er, the only of the 14 from our screen to actually beat the S&P 500 YTD. Despite trading well off 2025 highs, Royal Caribbean RCL broke back into a positive trend just before Christmas, posting a pair of buy signals in the process. The cruise liner seems to have found some strong support around $250. It earns 3/5 technical attribute points and trades just one box above the middle of its trading band. From here, a trip back to 2025 highs at $364 is certainly within reason. A move to those levels would represent a roughly 28% gain offering an attractive risk/reward profile with support just 12% away from the current price.
Remember, our long-term preference will always prioritize those names which earn further technical favor than the ones discussed today. The bulk of your portfolio should consist of high RS options, those that earn 4 or 5 technical attributes. However, that doesn’t mean that you shouldn’t continue to look for options that may be gaining relative strength, especially as we turn the page into the new year.
