Most Requested Symbols

The curve has an average reading of 12.00%.
Today's featured stock is California Resources Corporation (CRC).
Comments include: BBY, BLK, CELH, DG, FL, HSY, OLED, PLNT, SHOO, and SKX.
Call: Lyft Inc (LYFT); Put: Apple Inc (AAPL); Covered Write: The Gap, Inc (GPS).
NDW Morning Update Video - April 15, 2024
NDW Morning Update Video – April 15, 2024.
Click here to download MP3
The S&P 500 Index SPX closed lower for the second consecutive week, having fallen about 2% from its all-time closing high of 5,254 on March 28 to around 5,150 at the time of this writing Friday (4/12). This has not even been enough of a decline to cause the default chart of the index to reverse down into a column of Os, which would come with a potential move south of 5,100. While losses are never ideal, seeing the broad market benchmark consolidate is a perfectly normal occurrence, and can often be healthy for future growth. However, seeing lower prices naturally brings concerns around how long the declines will persist. Today, we will examine notable support levels for SPX to keep on the radar as reference points, hopefully alleviating fears of eminent weakness on the horizon.
The current technical picture for the S&P 500 has seen consistent improvement, with the default chart giving six consecutive buy signals. That movement started at the beginning of November last year, when we saw the sharp reversal from the October correction led SPX to continue higher in a single column of 32 Xs, notching one of the largest single columns we have ever seen. When the market was on such a significant stem, we did not have any recognizable support levels to look toward if things had turned around. Luckily that was not necessary, as the consistent demand continued throughout the first quarter of 2024. The more recent action has left a healthier chart, with recognizable support levels that have stemmed from brief pullbacks before further appreciation. Initial support on the default chart for SPX sits at 4,940, which would be a decline of about 6% from the all-time high at 5,250. Further support from there can be seen at 4,860, which would be a decline of about 7.5%. We have not seen a 5% pullback in SPX since September 21, 2023, which is 204 calendar days. This is almost twice as long as the average days between 5% pullbacks historically since 1928. Furthermore, the typical 5% pullback sees a decline of about 2.74%, on average, after the 5% threshold is breached. So, if we did see further consolidation down to the initial support levels, that would be consistent with normal market pullbacks over the last century.
Further support from those levels can be seen in the 4,720 to 4,700 level, which would be about 10% off the March all-time highs. We are certainly not saying that we are expecting the S&P 500 to trade down to that threshold in the near-future, or even that we are going to trade down to the initial support levels mentioned above. Instead, we are merely pointing out that the consistent support offered provides a sounder technical backdrop for the improvement so far this year.


Real Estate is still a hot topic on Main Street. Anecdotes about home prices, mortgage rates, bidding wars, and home equity are still frequent dinnertime conversations. Almost by default, if someone says they bought a house (or any property) a few years ago the internal response is, “Wow, that must have been a great investment.” However, if someone on Wall Street says they bought Real Estate stocks a few years ago, the internal response is not the same; in fact, the thoughts are probably opposite.
Since the S&P 500 bottomed in October 2022, the Real Estate Select Sector SPDR Fund (XLRE) has produced a total return of about 15%...which is pretty dismal given the S&P 500 is up about 45% over the same timeframe. To make matters worse, Technology (XLK) and Communication Services gained 70% over the same period and Industrials (XLI) are up north of 40%.
Admittedly October 2022 is a relatively short lookback period, but the story is the same over the past five years. From April 2019 to April 2024 XLRE has gained 22% including dividends…that is the worst return of the 11 major SPDR sector funds by far. For reference, the S&P 500 is up almost 100% since April 2019. So, you could argue that there is a significant bifurcation in Real Estate “sentiment” between Main Street and Wall Street.
Not coincidentally, the Real Estate sector has scored below 4.0 on our Asset Class Group Scores page consistently since November 2019. The low technical score simply reveals that most Real Estate ETFs and Mutual Funds have not performed well on an absolute or relative basis.

We could end our piece with the chart above, but that would not be most helpful. We could also try and extensively explain why this has been the case (interest rates, demographics, COVID, etc.) but that is not the intended takeaway either.
Avoiding technically weak sectors for prolonged periods is extremely important, but we also recognize that many portfolio managers have strategic sector diversification mandates. Furthermore, with interest rates ticking higher this week and rate cut expectations dwindling, some investors may want high-yielding Real Estate stocks due to bond prices treading water (if not outright falling). So, let’s look at some technically plausible options.
Perhaps not surprisingly, Residential REITS are currently one of the stronger subgroups. As of yesterday (4/11), 70% of names traded above their 50-day moving average (^TWECRESIREIT), and nearly 60% sat on a Point & Figure buy signal (^BPECRESIREIT). Another subgroup with strong stocks is Leisure. As of Thursday, 62% of names traded above their bullish support line (^PTECLEISREIT), and 56% sat on Point & Figure buy signals (^BPECLEISREIT).
To locate these strong citizens, consider using the detailed subsector search tool within the security screener. We found the below stocks through this process:
| Symbol | Name | Price | Tech Attrib/Score | DWA Sector | Overbought/Oversold | ||
|---|---|---|---|---|---|---|---|
| AMH | American Homes 4 Rent | 36.09 |
|
Real Estate |
|
||
| AVB | AvalonBay Communities, Inc. | 185.95 |
|
Real Estate |
|
||
| BHM | Bluerock Homes Trust, Inc. Class A | 16.35 |
|
Real Estate |
|
||
| BOWFF | Boardwalk REIT | 53.44 |
|
Real Estate |
|
||
| HST | Host Hotels & Resorts Inc. | 20.33 |
|
Leisure |
|
||
| INVH | Invitation Homes Inc | 34.61 |
|
Real Estate |
|
||
| PEB | Pebblebrook Hotel Trust | 15.68 |
|
Real Estate |
|
||
| RHP | Ryman Hospitality Properties | 112.73 |
|
Real Estate |
|
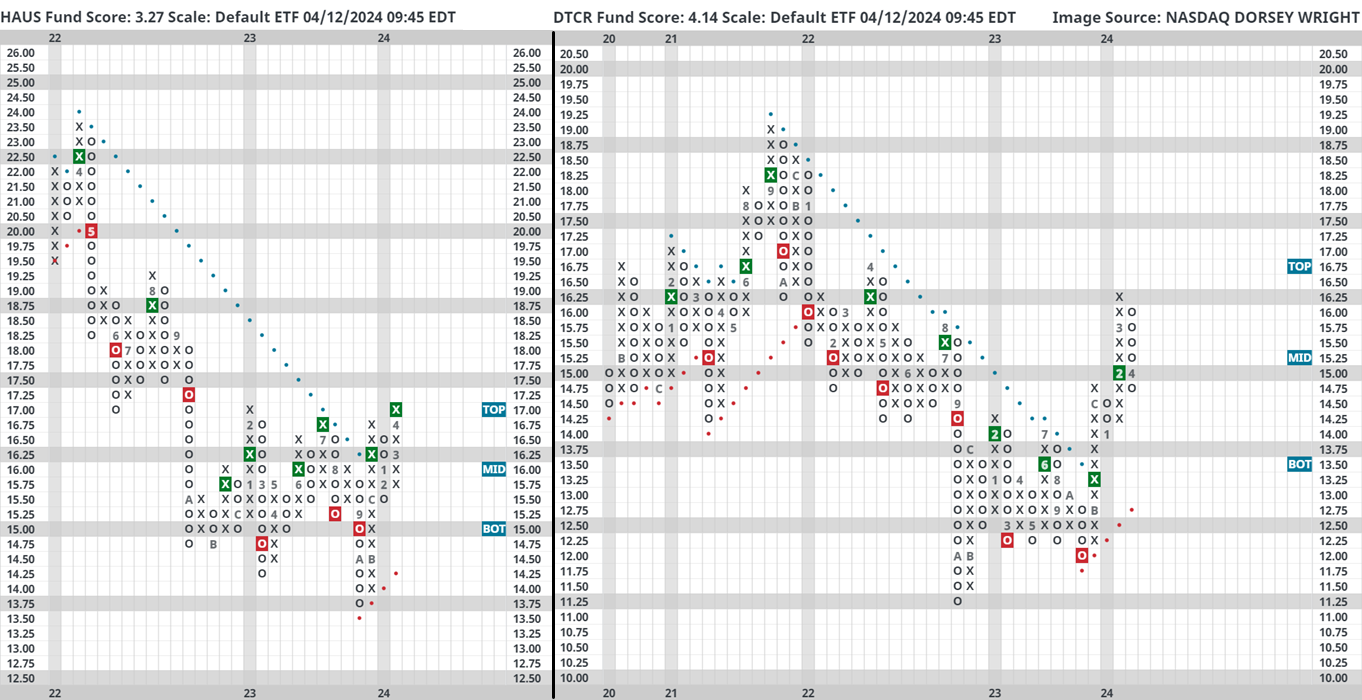
Those who prefer to use funds also have a couple of good options. In the Residential camp there is the Residential REIT ETF (HAUS). The ETF currently carries a fund score above 3.0 and recently (on Tuesday) matched its chart highs from February 2023. Although overextended at the moment, the weight of the technical evidence is positive and a breakout to $17.25 would provide additional bullish confirmation.
Another technically sound idea is the Global X Data Center & Digital Infrastructure ETF (DTCR). The fund carries a score above 4.0 and recently pulled back to the middle of its ten-week trading band, offering an attractive entry point. For what it’s worth, notice that DTCR was in a multiyear downtrend (traded below its bearish resistance line) until November 2023 before breaking out to the upside.
There are usually strong stocks/funds in weak sectors, it just takes more patience and diligence to seek them out. By definition, this is where and when active management (i.e., not passively owning everything) can really add value.
| Symbol | Name | Price | Yield | PnF Trend | RS Signal | RS Col. | Fund Score | 200 Day MA | Weekly Mom |
|---|---|---|---|---|---|---|---|---|---|
| DIA | SPDR Dow Jones Industrial Average ETF Trust | 384.54 | 1.73 | Positive | Sell | X | 3.74 | 361.14 | - 14W |
| EEM | iShares MSCI Emerging Markets ETF | 41.48 | 2.57 | Positive | Sell | O | 2.74 | 39.42 | - 3W |
| EFA | iShares MSCI EAFE ETF | 78.51 | 2.81 | Positive | Sell | X | 3.89 | 73.15 | - 2W |
| FM | iShares Frontier and Select EM ETF | 28.30 | 3.31 | Positive | Sell | O | 3.36 | 26.70 | + 7W |
| IJH | iShares S&P MidCap 400 Index Fund | 58.81 | 1.28 | Positive | Buy | O | 4.55 | 53.47 | - 2W |
| IJR | iShares S&P SmallCap 600 Index Fund | 106.11 | 1.28 | Positive | Sell | O | 2.77 | 101.03 | - 2W |
| QQQ | Invesco QQQ Trust | 445.37 | 0.59 | Positive | Buy | X | 5.67 | 394.32 | - 8W |
| RSP | Invesco S&P 500 Equal Weight ETF | 164.59 | 1.52 | Positive | Sell | O | 3.12 | 152.24 | - 2W |
| SPY | SPDR S&P 500 ETF Trust | 518.00 | 1.28 | Positive | Sell | X | 4.45 | 464.35 | - 6W |
| XLG | Invesco S&P 500 Top 50 ETF | 42.19 | 0.85 | Positive | Buy | X | 5.79 | 37.16 | - 6W |

Featured Chart: Invesco S&P 500 Equal Weight ETF (RSP)
This week’s declines saw several funds reverse down into O’s on their default charts. While the overall technical posture of said funds is still strong, perhaps the most important area to monitor as we journey into the second quarter is equal-weighted assets. Small-caps have struggled recently, so a major battleground for increased domestic participation could come from the “average stock.” Take for instance Invesco S&P 500 Equal Weight ETF (RSP), which reversed down into O’s with today’s action. Now at the middle of the trading band, bulls will look for a reversal back into X’s to act as a confirmation of positive action and establish near-term support. Past this, old resistance could come into play as new support around $154.
A number of other funds moved lower over the last week. Namely, DIA and IJH reversed back into O’s. QQQ is near a reversal, without technical support for quite a while on its default chart. Make sure to check in on more sensitive scales to look for near-term price battlegrounds across the board.

Average Level
12.00
| < - -100 | -100 - -80 | -80 - -60 | -60 - -40 | -40 - -20 | -20 - 0 | 0 - 20 | 20 - 40 | 40 - 60 | 60 - 80 | 80 - 100 | 100 - > |
|---|---|---|---|---|---|---|---|---|---|---|---|
|
Buy signalIJH
|
|||||||||||
|
Buy signalQQQ
|
|||||||||||
|
Buy signalefa
|
|||||||||||
|
Sell signalagg
|
Buy signalVOOV
|
Buy signaloneq
|
Buy signalvoog
|
||||||||
|
Sell signalief
|
Sell signaltlt
|
Buy signalhyg
|
Buy signalicf
|
Buy signalijr
|
Buy signaldvy
|
Buy signalspy
|
Buy signaldx/y
|
Buy signalgcc
|
|||
|
Buy signalshy
|
Sell signallqd
|
Sell signalfxe
|
Buy signaldia
|
Buy signaliwm
|
Buy signalrsp
|
Buy signalXLG
|
Buy signaleem
|
Buy signalUSO
|
Buy signalgsg
|
Buy signalgld
|
|
| < - -100 | -100 - -80 | -80 - -60 | -60 - -40 | -40 - -20 | -20 - 0 | 0 - 20 | 20 - 40 | 40 - 60 | 60 - 80 | 80 - 100 | 100 - > |
| AGG | iShares US Core Bond ETF |
| USO | United States Oil Fund |
| DIA | SPDR Dow Jones Industrial Average ETF |
| DVY | iShares Dow Jones Select Dividend Index ETF |
| DX/Y | NYCE U.S.Dollar Index Spot |
| EFA | iShares MSCI EAFE ETF |
| FXE | Invesco CurrencyShares Euro Trust |
| GLD | SPDR Gold Trust |
| GSG | iShares S&P GSCI Commodity-Indexed Trust |
| HYG | iShares iBoxx $ High Yield Corporate Bond ETF |
| ICF | iShares Cohen & Steers Realty ETF |
| IEF | iShares Barclays 7-10 Yr. Tres. Bond ETF |
| LQD | iShares iBoxx $ Investment Grade Corp. Bond ETF |
| IJH | iShares S&P 400 MidCap Index Fund |
| ONEQ | Fidelity Nasdaq Composite Index Track |
| QQQ | Invesco QQQ Trust |
| RSP | Invesco S&P 500 Equal Weight ETF |
| IWM | iShares Russell 2000 Index ETF |
| SHY | iShares Barclays 1-3 Year Tres. Bond ETF |
| IJR | iShares S&P 600 SmallCap Index Fund |
| SPY | SPDR S&P 500 Index ETF Trust |
| TLT | iShares Barclays 20+ Year Treasury Bond ETF |
| GCC | WisdomTree Continuous Commodity Index Fund |
| VOOG | Vanguard S&P 500 Growth ETF |
| VOOV | Vanguard S&P 500 Value ETF |
| EEM | iShares MSCI Emerging Markets ETF |
| XLG | Invesco S&P 500 Top 50 ETF |
| Symbol | Company | Sector | Current Price | Action Price | Target | Stop | Notes |
|---|---|---|---|---|---|---|---|
| KRG | Kite Realty Group Trust | Real Estate | $20.18 | 19 - 21 | 34.50 | 16 | 5 for 5'er, 11 of 113 in REAL sector matrix, LT pos mkt RS, spread quintuple top, 4.65% yield, Earn. 4/30 |
| OEC | Orion SA | Chemicals | $25.03 | 22 - 24 | 45.50 | 19 | 4 for 5'er, top third of CHEM sector matrix, LT pos mkt RS, spread quad top, R-R>5, Earn. 5/2 |
| MNST | Monster Beverage Corp. | Food Beverages/Soap | $54.73 | mid-to-hi 50s | 70 | 47 | 5 for 5'er, top third of FOOD sector matrix, LT pos mkt RS, Earn. 5/2 |
| ROP | Roper Technologies Inc. | Software | $539.44 | 510s - 540s | 648 | 432 | 4 for 5'er, top half of favored SOFT sector matrix, LT pos mkt RS, quad top breakout, Earn. 4/26 |
| NUE | Nucor Corporation | Steel/Iron | $197.34 | 170s - 180s | 234 | 150 | 4 for 5'er, top half of STEE sector matrix, spread triple top, pullback from ATH, 1.2% yield, Earn. 4/22 |
| BYD | Boyd Gaming Corp | Gaming | $65.44 | 61 - hi 60s | 87 | 52 | 4 TA rating, top 33% of GAME sector matrix, LT RS buy, buy-on-pullback, Earn. 4/23 |
| CCEP | Coca-Cola Europacific Partners PLC | Food Beverages/Soap | $67.88 | 60s | 97 | 56 | 5 for 5'er, top 25% of FOOD sector matrix, spread quad top, R-R~3.0, 3% yield |
| CXT | Crane NXT Co. | Electronics | $62.50 | hi 50s - low 60s | 76 | 48 | Top half of MACH sector matrix, bullish catapult, Earn. 5/8 |
| ODFL | Old Dominion Freight Line, Inc. | Transports/Non Air | $219.75 | 212 - 220s | 258 | 182 | 4 for 5'er, favored TRAN sector matrix, LT pos mkt RS, bullish triangle, Earn. 4/24 |
| SPB | Spectrum Brands Holdings | Food Beverages/Soap | $80.74 | hi 70s - mid 80s | 112 | 65 | 4 TA rating, top quartile of FOOD sector RS matrix, consec. buy signals, buy-on-pullback, R-R > 2 |
| ANSS | Ansys Inc | Software | $340.23 | 330s - 350s | 412 | 300 | 5 for 5'er, favored SOFT sector matrix, triple top, LT pos mkt RS, good R-R, Earn. 5/1 |
| MMC | Marsh & McLennan Companies, Inc. | Insurance | $199.19 | 190s - low 200s | 234 | 180 | 5 for 5'er, favored INSU sector, LT pos mkt RS, quad top breakout, 1.4% yield, Earn. 4/18 |
| IT | Gartner, Inc. | Business Products | $474.72 | 440s - 470s | 556 | 380 | 5 for 5'er, top 20% of favored BUSI sector matrix, LT pos mkt RS, quad top breakout, Earn. 4/30 |
| BLMN | Bloomin' Brands Inc | Restaurants | $26.95 | hi 20s - low 30s | 41 | 24 | 5 for 5'er, #10 of 27 in REST sector matrix, LT pos mkt RS, quintuple top, R-R>2.0, 3.2% yield, Earn. 4/26 |
| EAT | Brinker International Inc | Restaurants | $46.65 | mid 40s - lo 50s | 75 | 37 | 5 TA rating, top 25% of REST sector matrix, LT RS buy, consec. buy signals, R-R > 2.5, Earn. 4/30 |
| HEI | Heico Corporation | Aerospace Airline | $193.79 | 184 - hi 190s | 262 | 152 | 5 TA rating, top half of AERO sector matrix, LT RS buy, near-term consolidation |
| HRB | H&R Block, Inc. | Business Products | $46.92 | mid 40s - lo 50s | 71 | 39 | 5 TA rating, top 33% of BUSI sector matrix, LT pos trend, LT pos. mkt. RS, buy-on-pullback, R-R > 2, Earn. 5/7 |
| RRR | Red Rock Resorts Inc | Gaming | $61.59 | hi 50s - lo 60s | 87 | 49 | 5 TA rating, top 25% of GAME sector matrix, consec. buy signals, new ATH, R-R > 2, Earn. 5/7 |
| TMHC | Taylor Morrison Home Corporation | Building | $56.83 | hi 50s - lo 60s | 87 | 50 | 5 TA rating, top half of BUIL sector matrix, six consec. buy signals, LT pos. trend, buy-on-pullback, R-R > 3, Earn. 4/30 |
| ITW | Illinois Tool Works Inc. | Machinery and Tools | $257.68 | low 250s - hi 260s | 356 | 216 | 5 for 5'er, LT pos mkt RS, spread quad top, 2.1% yield, Earn. 4/30 |
| MGM | MGM Resorts International | Gaming | $44.72 | 42-hi 40s | 66 | 38 | 4 TA rating, top 50% of GAME sector matrix, LT RS buy, consec. buy signals, pos. wkly. mom., R-R > 2, Earn. 5/1 |
| DKNG | DraftKings Inc Class A | Gaming | $45.44 | mid-to-hi 40s | 72 | 40 | 5 for 5'er, #2 of 17 in GAME sector matrix, triple top breakout, R-R>3.0, Earn. 5/2 |
| RPM | RPM, Inc. | Chemicals | $109.82 | mid 100s - hi 110s | 159 | 91 | 5 TA rating, LT RS buy, consec. buy signals, top 50% of CHEM sector matrix, buy-on-pullback, R-R > 2 |
| ARCB | ArcBest Corp. | Transports/Non Air | $151.75 | 140s - low 150s | 206 | 124 | 5 for 5'er, top 20% of favored TRAN sector matrix, LT pos mkt RS, R-R>2.0, Earn. 4/30 |
| DASH | DoorDash, Inc. Class A | Retailing | $140.95 | mid $130s - hi $140s | 166 | 132 | 5 TA rating, top decile of RETA sector matrix, shakeout pattern, R-R > 3, Earn. 5/1 |
| CRC | California Resources Corporation | Oil | $56.54 | mid-to-hi 50s | 77 | 45 | 4 for 5'er, LT pos mkt RS, spread quad top, R-R ~ 2.0, 2.2% yield, Earn. 5/7 |
| Symbol | Company | Sector | Current Price | Action Price | Target | Stop | Notes |
|---|---|---|---|---|---|---|---|
| MTCH | Match Group, Inc. | Internet | $33.81 | (mid 30s) | 26 | 40 | 0 for 5'er, bottom half of INET sector matrix, LT neg trend & RS, Earn. 4/30 |
| Symbol | Company | Sector | Current Price | Action Price | Target | Stop | Notes |
|---|---|---|---|---|---|---|---|
| ANET | Arista Networks Inc | Internet | $296.58 | 280s - 300s | 364 | 252 | ANET fell to a sell signal on Friday. OK to hold here. Maintain $252 stop. Earn. 5/7 |
| Comment | |||||||
|---|---|---|---|---|---|---|---|
|
|
|||||||
CRC California Resources Corporation R ($55.90) - Oil - CRC is a 4 for 5'er that ranks near the middle of the oil sector matrix and has been on a market RS buy signal since mid-2021. On its default chart, the stock gave a second consecutive buy signal earlier this week when it broke a spread quadruple top at $57, taking out resistance that had been in place since October. Long exposure may be added in the mid-to-upper $50s and we will set our initial stop at $45, a potential spread triple bottom break on CRC's default chart. We will use the bullish price objective, $77, as our target price, giving us a reward-to-risk ratio approaching 2.0. CRC also carries a 2.2% yield. Earnings are expected on 5/7.
| 23 | 24 | |||||||||||||||||||||||||||||||||||||||||||||||||||
| 58.00 | X | X | 58.00 | |||||||||||||||||||||||||||||||||||||||||||||||||
| 57.00 | 9 | O | X | O | X | 57.00 | ||||||||||||||||||||||||||||||||||||||||||||||
| 56.00 | X | O | X | O | X | X | X | 4 | 56.00 | |||||||||||||||||||||||||||||||||||||||||||
| 55.00 | X | O | A | X | O | X | O | X | X | O | X | 55.00 | ||||||||||||||||||||||||||||||||||||||||
| 54.00 | 8 | O | X | O | X | O | X | O | X | O | X | 54.00 | ||||||||||||||||||||||||||||||||||||||||
| 53.00 | X | O | O | X | 1 | X | O | X | O | 53.00 | ||||||||||||||||||||||||||||||||||||||||||
| 52.00 | • | X | O | X | O | X | O | X | Mid | 52.00 | ||||||||||||||||||||||||||||||||||||||||||
| 51.00 | • | • | X | • | X | B | X | O | X | 3 | X | 51.00 | ||||||||||||||||||||||||||||||||||||||||
| 50.00 | X | • | X | • | X | O | • | • | X | O | X | O | X | O | X | 50.00 | ||||||||||||||||||||||||||||||||||||
| 49.00 | X | O | • | X | O | • | X | O | • | X | • | • | X | C | O | X | O | X | 49.00 | |||||||||||||||||||||||||||||||||
| 48.00 | X | O | • | X | O | • | X | O | • | X | O | • | X | • | X | O | X | O | X | • | 48.00 | |||||||||||||||||||||||||||||||
| 47.00 | X | O | X | • | X | O | • | X | 9 | • | B | O | X | • | X | O | • | 7 | 2 | X | O | X | • | 47.00 | ||||||||||||||||||||||||||||
| 46.00 | X | X | O | X | O | • | 6 | O | • | • | X | O | X | O | X | O | • | X | O | • | X | O | O | • | 46.00 | |||||||||||||||||||||||||||
| 45.00 | X | O | X | O | X | O | X | X | O | X | • | X | O | X | O | X | O | • | X | O | • | X | • | • | 45.00 | |||||||||||||||||||||||||||
| 44.00 | X | O | X | 4 | O | X | O | X | O | X | O | X | O | X | O | X | C | X | X | O | 3 | • | X | • | 44.00 | |||||||||||||||||||||||||||
| 43.00 | X | X | O | X | O | X | O | X | O | X | X | O | X | O | X | X | X | O | O | X | O | X | O | X | O | X | • | 43.00 | ||||||||||||||||||||||||
| 42.00 | X | O | 3 | O | X | • | O | X | O | X | O | X | X | O | X | 8 | O | X | O | X | O | X | • | O | X | O | X | O | X | O | X | • | 42.00 | |||||||||||||||||||
| 41.00 | X | O | X | O | • | O | X | O | X | O | X | O | X | O | X | • | O | X | O | X | O | X | • | O | X | 1 | • | 2 | X | O | X | 6 | • | Bot | 41.00 | |||||||||||||||||
| 40.00 | O | X | • | O | X | O | X | O | X | O | X | O | • | O | A | O | O | • | O | • | • | O | X | O | X | O | X | • | 40.00 | |||||||||||||||||||||||
| 39.00 | O | X | • | 5 | O | • | O | X | O | X | • | O | X | • | • | • | O | O | 4 | O | X | • | 39.00 | |||||||||||||||||||||||||||||
| 38.00 | O | • | • | O | X | 7 | X | • | O | X | • | O | X | 5 | • | 38.00 | ||||||||||||||||||||||||||||||||||||
| 37.00 | • | O | X | O | • | O | • | O | X | • | 37.00 | |||||||||||||||||||||||||||||||||||||||||
| 36.00 | • | O | • | • | • | O | X | • | 36.00 | |||||||||||||||||||||||||||||||||||||||||||
| 35.00 | • | O | • | 35.00 | ||||||||||||||||||||||||||||||||||||||||||||||||
| 23 | 24 |

| BBY Best Buy Co., Inc. ($78.16) - Retailing - BBY broke a double bottom at $78 to end of series of buy signals that began back in February. This now brings the stock down to test the bullish support line - the stock's one positive technical attribute. From here, a come below $77 would violate the trendline and bring BBY into a negative trend. Additional support levels lie through the $70 range, with the January 2024 chart low residing at $70. Avoid for now. |
| BLK BlackRock, Inc. ($764.32) - Wall Street - BLK shares moved lower today to break a double bottom at $768 to mark its first sell signal. This 5 for 5'er has been in a positive trend since November and on an RS buy signal versus the market since October 2020. BLK shares are trading below the middle of their trading band. From here, support is offered at $768 with the next level of support far away at $600. |
| CELH Celsius Holdings, Inc. ($78.64) - Food Beverages/Soap - CELH returned to a sell signal on Friday with a double bottom break at $80. The stock remains a 3 for 5'er at this time but the technical picture is fading. For example, on the longer-term 2-point per box chart we see a series of lower highs. No new exposure here. Residual support is offered at around $77. |
| DG Dollar General Corp. ($148.66) - Retailing - DG broke a double bottom at $150 to end a series of buy signals that began in February. The positive action to kick off 2024 has brought about positive near-term RS against the market and its peer group as the stock rallied to within one box of its bearish resistance line earlier this month. From here, it would take a move into the upper-$160s to see the stock flip the trend back to positive. From here, support lies at $148, while additional can be found at $138 and $130. |
| FL Foot Locker, Inc. ($22.05) - Retailing - FL broke a double bottom at $22 for a second sell signal since the stock's February near-term peak. FL still trades above the bullish support line and in a positive trend - the stock's one lone positive attribute - but now sits just two boxes above its bullish support line at $19.50. Continue to avoid at this time. |
| HSY The Hershey Company ($185.09) - Food Beverages/Soap - HSY shares printed a second consecutive sell signal on Friday and broke through their bullish support line. The now 2 for 5'er tests a big area of support dating back to October 2023. No new exposure here. Sell on rallies. |
| OLED Universal Display Corporation ($159.31) - Computers - OLED moved lower Friday to break a double bottom at $160, marking a third consecutive sell signal. This 2 for 5’er moved to a negative trend last month and sits in the bottom half of the unflavored computers sector RS matrix. The weight of the technical evidence is weak and continues to deteriorate. Further support may be seen at $156 with overhead resistance potentially found at $168. Note that earnings are expected on 5/1. |
| PLNT Planet Fitness Inc ($61.11) - Leisure - PLNT reversed into Os and broke a double bottom at $61 for the stock's third consecutive sell signal since reaching a near-term peak in mid-January. PLNT still trades in a positive trend - its one lone attribute - but the bullish support line is now the next level of near-term support for the stock. From here, a move below $55 would violate the trendline and drop the stock to a 0 attribute. Avoid for now. |
| SHOO Madden Steven LTD ($39.10) - Retailing - SHOO broke a triple bottom at $39 for the first sell signal since last summer and follows the stock rallying to resistance at $45. SHOO remains a 5 for 5'er that ranks in the top half of the Retailing sector matrix and is accompanied by a yield of north of 2%. Long-term holders may continue to hold here, but be aware of the bullish support line residing at $36. From here, a move above resistance at $45 would mark the highest level for the stock since early 2022. |
| SKX Skechers U.S.A, Inc. ($56.03) - Textiles/Apparel - SKX broke a double bottom at $56. This follows the stock putting in a lower top in February as the stock failed to retest prior highs from January at $65. SKX remains a 5 for 5'er and ranks just outside the top half of the Textiles/Apparel sector matrix, suggesting there may be peers with stronger technical pictures. Long-term holders may continue to hold here but should look for positive near-term chart developments before considering further. Form here, support lies at $49, the bullish support line, while additional can be found at $46, the September/October 2023 chart lows. |
| Name | Option Symbol | Action | Stop Loss |
|---|---|---|---|
| Lyft Inc Class A - $18.66 | O: 24G18.00D19 | Buy the July 18.00 calls at 3.20 | 17.00 |
| Name | Option | Action |
|---|---|---|
| The Charles Schwab Corporation ( SCHW) | Apr. 62.50 Calls | Stopped at 8.35 (CP: 7.45) |
| Amazon.com Inc. ( AMZN) | Jul. 170.00 Calls | Stopped at 23.85 (CP: 22.85) |
| Darden Restaurants, Inc. ( DRI) | Jul. 160.00 Calls | Stopped at 152.00 (CP: 153.34) |
| Name | Option Symbol | Action | Stop Loss |
|---|---|---|---|
| Apple Inc. - $176.55 | O: 24S180.00D19 | Buy the July 180.00 puts at 9.50 | 188.00 |
| Name | Option | Action |
|---|---|---|
| V.F. Corporation ( VFC) | Jun. 17.50 Puts | Raise the option stop loss to 3.40 (CP: 5.40) |
| CVS Health Corp. ( CVS) | Jun. 75.00 Puts | Raise the option stop loss to 5.35 (CP: 7.35) |
| Alibaba Group Holding Ltd (China) ADR ( BABA) | Jun. 75.00 Puts | Initiate an option stop loss of 4.00 (CP: 6.00) |
| Starbucks Corporation ( SBUX) | Jun. 92.50 Puts | Raise the option stop loss to 6.90 (CP: 8.90) |
| Altria Group Inc. ( MO) | Jun. 45.00 Puts | Raise the option stop loss to 2.50 (CP: 4.50) |
| Intel Corporation ( INTC) | Jun. 43.00 Puts | Raise the option stop loss to 5.65 (CP: 7.65) |
| United Airlines Holdings Inc. ( UAL) | Jul. 47.00 Puts | Raise the option stop loss to 4.70 (CP: 6.70) |
| Match Group, Inc. ( MTCH) | Jun. 37.50 Puts | Initiate an option stop loss of 3.45 (CP: 5.45) |
| Albemarle Corp ( ALB) | Sep. 130.00 Puts | Initiate an option stop loss of 18.05 (CP: 20.05) |
| Name | Option Sym. | Call to Sell | Call Price | Investment for 500 Shares | Annual Called Rtn. | Annual Static Rtn. | Downside Protection |
|---|---|---|---|---|---|---|---|
| The Gap, Inc. $ 23.39 | O: 24F23.00D21 | Jun. 23.00 | 1.93 | $ 10,376.85 | 50.80% | 42.38% | 7.51% |
| Name | Action |
|---|---|
| Applied Materials, Inc. ( AMAT) - 212.97 | Sell the June 210.00 Calls. |
| Palantir Technologies Inc. Class A ( PLTR) - 22.84 | Sell the June 26.00 Calls. |
| Advanced Micro Devices, Inc. ( AMD) - 170.48 | Sell the June 180.00 Calls. |
| Block Inc ( SQ) - 80.06 | Sell the July 87.50 Calls. |
| Lyft Inc Class A ( LYFT) - 19.53 | Sell the July 20.00 Calls. |
| Delta Air Lines Inc. ( DAL) - 47.63 | Sell the September 50.00 Calls. |
| DraftKings Inc Class A ( DKNG) - 45.44 | Sell the July 45.00 Calls. |
| Bath & Body Works Inc. ( BBWI) - 46.22 | Sell the August 47.50 Calls. |
| Live Nation Entertainment Inc. ( LYV) - 102.74 | Sell the July 105.00 Calls. |
| Name | Covered Write |
|---|---|
| Hewlett Packard Enterprise Company ( HPE - 17.94 ) | August 19.00 covered write. |
Daily Equity & Market Analysis
Loading, Please Wait...
