Most Requested Symbols

The curve has an average reading of 49.23%.
Today's featured stock is Wyndham Hotels & Resorts Inc (WH).
Comments include: CNC and GIB.
Call: Targa Resources (TRGP); Put: Target Corporation (TGT); Covered Write: Dexcom (DXCM)
NDW Morning Update Video - December 6, 2023
NDW Morning Update Video – December 6, 2023.
Click here to download MP3
Check out this recent discussion with David Cohen and Matthew Patterson of HANDLS Indexes and David Miller of Catalyst Funds on the Strategy Shares Nasdaq 7HANDL Index, which aims to provide a 7% monthly distribution to investors through a well-diversified, multi-asset portfolio of ETFs. The Strategy Shares are distributed by Foreside Fund Services, LLC, which is not affiliated with Rational Advisors, Inc., or any of its affiliates.
As discussed in yesterday’s “Were You Aware…?”, the Russell 2000 Index RUT had notable outperformance relative to the Nasdaq-100 NDX during Friday’s trading. Along with RUT, the S&P 500 Equal Weighted Index SPXEWI was able to outperform the S&P 500 Index SPX by just shy of 1%, giving further credence to the average stock showing some signs of life. Last week marked the third week in a row that the S&P 500 Equal Weighted Index was able to either match or outperform the S&P 500. The continuation of positive US Equity performance from November into December has led to the SPXEWI to shift its trend back to positive on its default trend chart and exhibit positive RS. Following Friday’s action, SPXEWI reversed back into Xs on the RS chart comparing the Index to the DWA Money Market Proxy (13-Week T-Bill) MNMKT for the first time since reversing into Os back in March of this year. While SPXEWI is now favored over Cash from a relative standpoint, the RS chart comparing the S&P 500 Index SPX to MNYMKT remains in Os, favoring Cash.
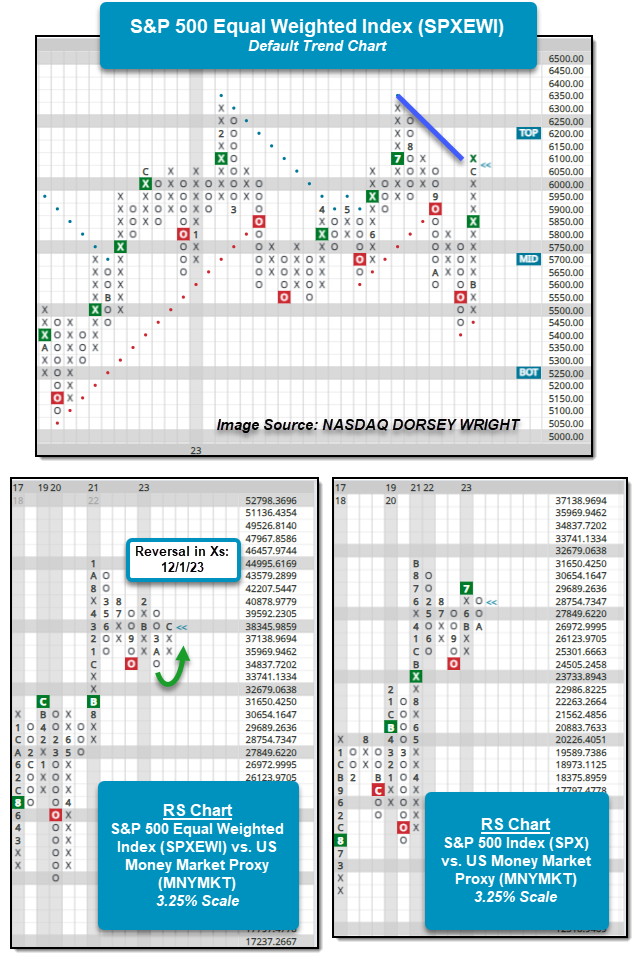
The positive RS gain by SPXEWI over our Cash proxy (MNYMKT) ultimately caused the Money Market Percentile Rank (MMPR) and the score of the US Money Market group on the Asset Class Group Scores page to fall notably. The US Money Market group fell from a score of 2.79 to 2.34 after Friday, the lowest score for the group in more than 12 months. The group continues to score above 2, which has been the case for 471 trading days now. This marks the second longest period that the US Money Market group has maintained its score above 2, with the longest period beginning at the start of our data set (9/26/2005) and lasting until May 2009 for a total of 912 trading days. Historically speaking, daily returns for the market tend to be better when the US Money Market group scores below 2.

The drop in the US Money Market group’s score impacts the Money Market Percentile Rank (MMPR) as well, with MMPR falling from 33% to 13% after Friday’s trading. This is the first time, MMPR has been below the 20th percentile since June and marks the lowest reading since February. Low MMPR readings, like low US Money Market scores, tend to occur during bull market environments for equities, and while action in 2023 has been positive – mostly for the large cap space – MMPR has been above average and elevated compared to other years, especially those that in which US Equities faired well. Historically, MMPR’s average annual reading going back to 2005 sits at roughly 21%, suggesting that Cash tends to fair better than roughly 1/5th of the 134 total groups on the ACGS page at any given time. The average MMPR reading for 2023 sits at 36% and there have only been 27 trading days (out of 232 so far) in which MMPR has been below 20%. The only year with a lower percentage of days with MMPR below 20% is 2008 and the average MMPR reading during that year was 74%. Although MMPR has been elevated compared to the historical average for much of 2023, the last month of positive performance has changed that stance drastically.

The relative improvement of the average stock as defined by the S&P 500 Equal Weighted Index SPXEWI has been the near-term catalyst that has led to weakness within the US Money Market group and the drop in MMPR. But it shouldn’t be forgotten that improvement within the Fixed Income space has been responsible for the increase in groups showing positive RS relative to Cash as well. There are still some select areas of the global market that are showing weakness relative to Cash. Most notably, China and Asia-Pacific groups along with some US sectors like Basic Materials, Consumer Staples, Real Estate, and Healthcare. With areas of the equity and fixed income spaces reaching overbought or extended territory, it will be intriguing to see where the US Money Market group may move to or settle with a potential pullback or consolidation in the offing.

Stocks up, bonds down, commodities mixed for 2023, Bitcoin is Bitcoin
As we come to the end of the year, we thought it’d be a good time to look back at how markets performed this year.
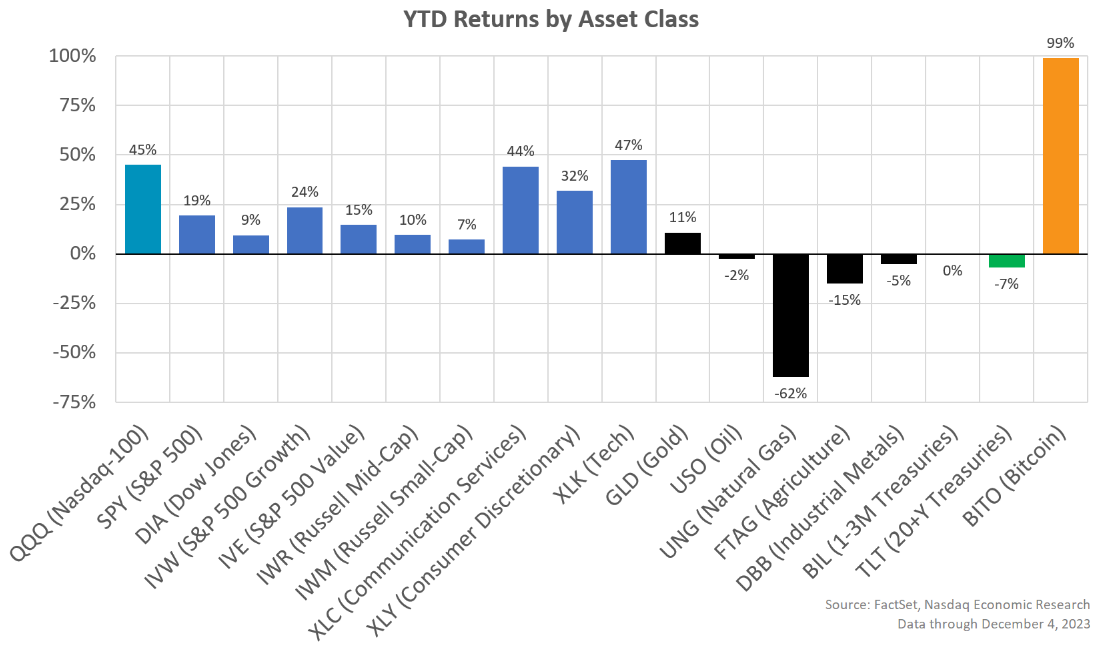
In the chart below we use popular ETFs to show returns so far in 2023 across different stock portfolios (blue), commodities (black), bonds (green) and even Bitcoin (orange).
Big picture, we saw that:
Not all stocks gained the same
With interest rates staying high, the strong equity market performance should come as a surprise. As a reminder, a year ago, with recession fears front and center, analysts were projecting the S&P 500 to fall by 1.7% this year. Instead, it’s up 19% YTD (chart below, orange line).
Although not all indexes or stocks saw those gains. The Dow Jones Industrial Average (grey line), which – with the exception of Apple and Microsoft – has more “mature” (and less Tech-y) companies in it, is up less than 10%. While the growth-focused Nasdaq-100 is up 45% (blue line)!

Magnificent 7 explains much of outperformance
A lot of the difference in performance in these indices comes down to exposure to the (Nasdaq-listed) “Magnificent 7” – Apple, Amazon, Alphabet (Google), Nvidia, Meta, Microsoft, and Tesla. All of which benefited from the “AI trade” this year – with investors hoping their proximity to data centers and compute will help them grow AI revenues.
Those stocks are up about 70% this year (chart below, blue line), compared to about 10% for the rest of the S&P 500 (orange line). And of course, they’re an even larger weight in the Nasdaq-100 than the S&P 500.

Magnificent 7 returns reflect fundamentals
However, this is not like 1999 (the tech bubble, where prices rose even when many of the largest companies were still unprofitable). In fact, data show that the magnificent Nasdaq 100 companies have been growing earnings (chart below, red line) – and much faster than smaller companies in the Russell 2000 (black line).

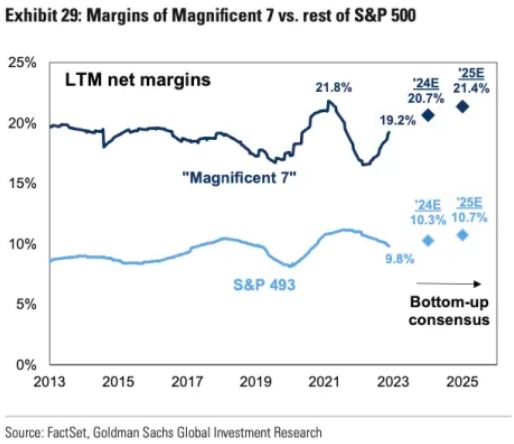
In addition, as Goldman Sachs highlighted recently, the Magnificent 7 margins are double the rest of the S&P 500’s (chart below), and their margins are expected to increase more than the rest of the S&P 500 over the next couple years (dots).
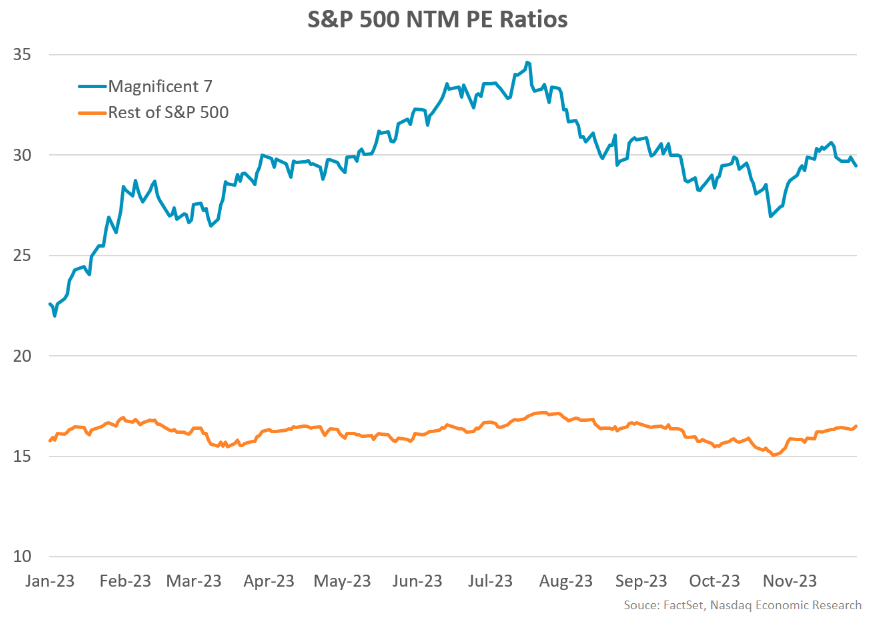
Although the market knows this too. That’s why the PE multiple for the Magnificent 7 is also much higher (pricing in higher earnings in the future), with a PE around 30 (chart below, blue line).
Interestingly, the rest of the S&P 500 (orange line) is at a much more reasonable PE of 17 – and the multiple of small and mid-cap stocks is even “cheaper,” and also below their long-term averages.
2023’s been a surprisingly great year for stocks!
All in all, and in spite of higher rates and a slower-growing economy, 2023 has turned out to be a great year for stocks –certainly compared to expectations coming into the year.
With the Fed expected to start cutting rates in 2024, we will have a valuation tailwind for stocks (and bonds). Fingers crossed inflation keeps cooling, geopolitical risks don’t leak to energy markets, and we have a soft landing with earnings growth.
Interest rate policy has been at the forefront of investors’ minds for years and has only been exacerbated by the aggressive hiking the Federal Reserve has done since early 2022. Market participants seem to not only think rate hikes are behind us, but that the Fed will cut rates substantially next year. A useful tool to see market expectations of the Fed Funds Rate is through the CME’s FedWatch Tool (link here). The tool allows users to see the probabilities being priced into changes in the Fed Funds Rate at different meeting dates. The first rate cut is likely to take place in March with a 62% chance the Fed Funds Rate will be lowered at that meeting. Looking further out, the market is pricing in more than a 90% chance the Fed will cut rates by at least 100 basis points by December 2024. While most market participants expected the Fed to begin cutting rates next year, expectations have shifted dramatically over the last month. Referring to March, the market has priced in over a 60% chance the Fed cuts rates. A month ago, the odds of a rate cut in March were only 25%. This massive shift is a bit perplexing when just looking at economic data and statements from Fed officials. Inflation is still above 2%, but growth is strong and while the Fed has suggested that rate hikes are over it has held the line that rates will need to stay elevated so that inflation can return to the 2% target. Nonetheless, the market doesn’t believe rates will stay higher for longer despite the “positive” data. It should be noted that rate expectations could dramatically shift in the other direction as well, elevators can go up as well as down.

Other assets have moved in a way that backs up the rate cut expectations as well as a less positive economic backdrop. One example is gold which hit a new all-time high above 2100 on Sunday night when futures began trading. It has since pulled back to a little over 2000 (not displayed on the chart below). The volatility in the precious metals space is a bit confounding but gold has been trending higher since October, undoubtedly helped by changes in rate expectations. While gold may be more rate-oriented in its moves, oil has started to show signs of a weakening economic backdrop. The most telling was oil’s reaction to OPEC+’s production cut announcement last week in which it struggled to catch a bid. One of the factors that contributed to the lack of upside is the doubt that OPEC+ participants will adhere to the cuts. However, another reason for the struggle for oil prices to move higher is economic concerns. While economic data has been perceived as positive or neutral for the most part in the US, the global picture is much less favorable. China has been a major issue and European data has started to turn downwards (Investing.com). Overall, some of the largest commodities markets are signaling the expectation of lower interest rates and less economic activity.

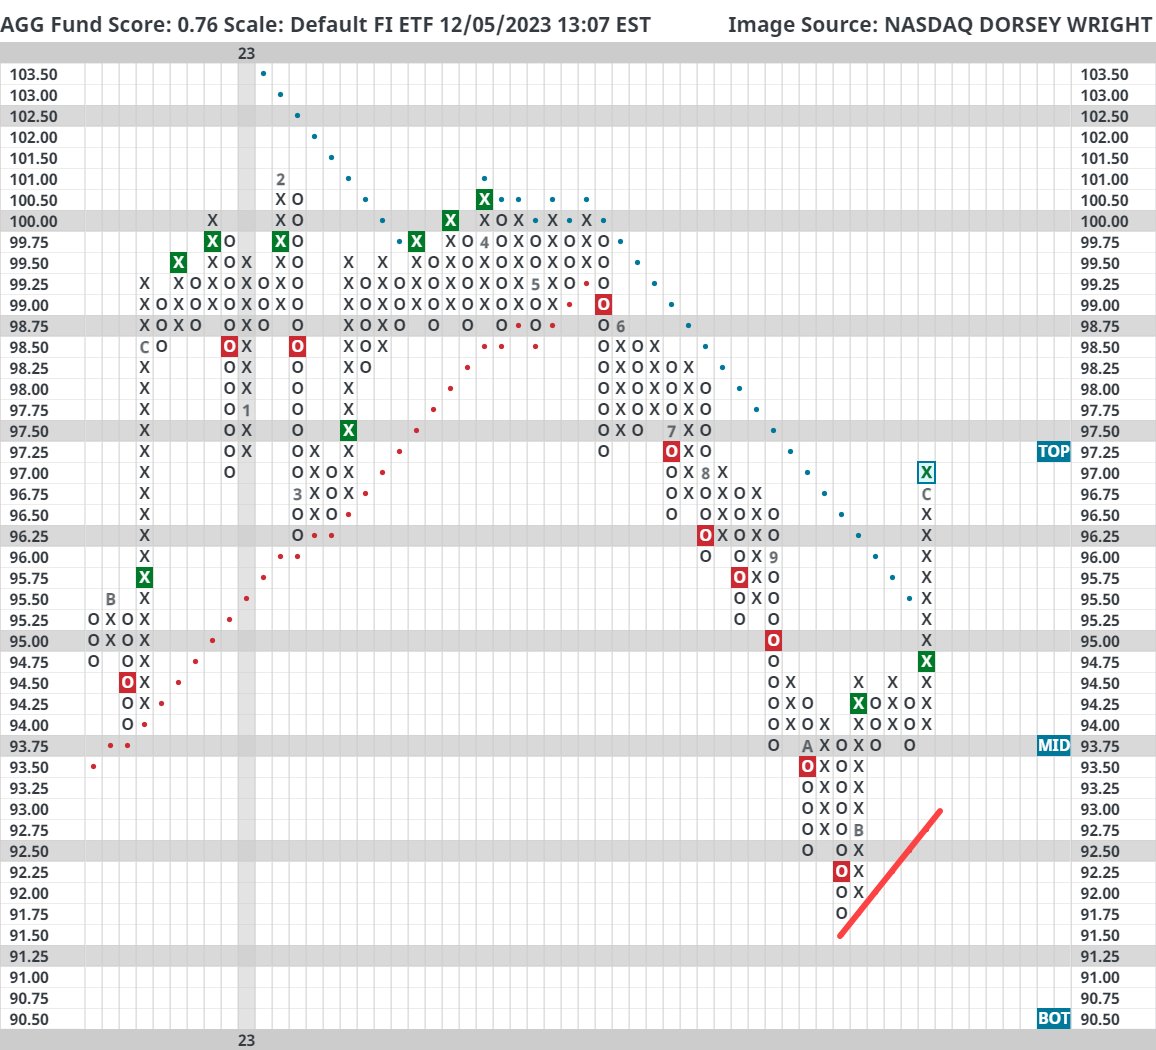
Lastly and most directly associated with rate expectations has been the improvement in the fixed income market. The iShares US Core Bond ETF (AGG) has gained 5.23% since putting in a recent bottom on October 19th. The S&P 500 Index (SPX) has gained 6.82% over the same period, a notable underperformance from a risk-adjusted basis. On top of a strong performance over the last month and a half, AGG now trades on two consecutive buy signals and recently entered a positive trend for the first time since May. AGG still has a poor fund score of 0.76 but bonds have caught a significant bid that shouldn’t be ignored. As is the case with outsized moves, AGG now sits at the top of its trading band with a weekly overbought/oversold reading of 75%, its highest reading since July 2020, and lacks support until $93.75. While there may be some short-term headwinds because of the current posture, bonds are looking like they’re turning a corner for the first time in a long time.
In conclusion, the price action across multiple asset classes as well as what’s being priced into the Fed Fund futures market shows that despite positive or lukewarm US economic data, investors are expecting a drawdown in economic activity and not believing the Fed’s current story. The price action in the bond market is the biggest marker of a shift in sentiment. However, equity markets seem unbothered by some of these developments for the time being as the S&P 500 Index is within shouting distance of its all-time high. Nonetheless, the move in bonds and commodities shows that the market has been going through changes underneath the surface. Moving forward, it’s important to stay alert on any more developments as we close out 2023.

Average Level
49.23
| < - -100 | -100 - -80 | -80 - -60 | -60 - -40 | -40 - -20 | -20 - 0 | 0 - 20 | 20 - 40 | 40 - 60 | 60 - 80 | 80 - 100 | 100 - > |
|---|---|---|---|---|---|---|---|---|---|---|---|
|
Buy signaliwm
|
|||||||||||
|
Sell signaldvy
|
|||||||||||
|
Buy signalshy
|
|||||||||||
|
Buy signalief
|
|||||||||||
|
Buy signalQQQ
|
Sell signalefa
|
||||||||||
|
Buy signalvoog
|
Buy signalijr
|
||||||||||
|
Buy signalGLD
|
Sell signalijh
|
Buy signalhyg
|
|||||||||
|
Buy signalXLG
|
Buy signalspy
|
Buy signallqd
|
|||||||||
|
Sell signalUSO
|
Sell signaleem
|
Buy signaloneq
|
Buy signalagg
|
Buy signalicf
|
|||||||
|
Buy signalgsg
|
Sell signaldx/y
|
Sell signalgcc
|
Sell signalfxe
|
Buy signaltlt
|
Sell signalRSP
|
Buy signalVOOV
|
Buy signaldia
|
||||
| < - -100 | -100 - -80 | -80 - -60 | -60 - -40 | -40 - -20 | -20 - 0 | 0 - 20 | 20 - 40 | 40 - 60 | 60 - 80 | 80 - 100 | 100 - > |
| AGG | iShares US Core Bond ETF |
| USO | United States Oil Fund |
| DIA | SPDR Dow Jones Industrial Average ETF |
| DVY | iShares Dow Jones Select Dividend Index ETF |
| DX/Y | NYCE U.S.Dollar Index Spot |
| EFA | iShares MSCI EAFE ETF |
| FXE | Invesco CurrencyShares Euro Trust |
| GLD | SPDR Gold Trust |
| GSG | iShares S&P GSCI Commodity-Indexed Trust |
| HYG | iShares iBoxx $ High Yield Corporate Bond ETF |
| ICF | iShares Cohen & Steers Realty ETF |
| IEF | iShares Barclays 7-10 Yr. Tres. Bond ETF |
| LQD | iShares iBoxx $ Investment Grade Corp. Bond ETF |
| IJH | iShares S&P 400 MidCap Index Fund |
| ONEQ | Fidelity Nasdaq Composite Index Track |
| QQQ | Invesco QQQ Trust |
| RSP | Invesco S&P 500 Equal Weight ETF |
| IWM | iShares Russell 2000 Index ETF |
| SHY | iShares Barclays 1-3 Year Tres. Bond ETF |
| IJR | iShares S&P 600 SmallCap Index Fund |
| SPY | SPDR S&P 500 Index ETF Trust |
| TLT | iShares Barclays 20+ Year Treasury Bond ETF |
| GCC | WisdomTree Continuous Commodity Index Fund |
| VOOG | Vanguard S&P 500 Growth ETF |
| VOOV | Vanguard S&P 500 Value ETF |
| EEM | iShares MSCI Emerging Markets ETF |
| XLG | Invesco S&P 500 Top 50 ETF |
| Symbol | Company | Sector | Current Price | Action Price | Target | Stop | Notes |
|---|---|---|---|---|---|---|---|
| GPK | Graphic Packaging Intl. | Forest Prods/Paper | $23.18 | 21 - 23 | 26 | 18 | #6 of 12 in favored FORE sector matrix, LT pos mkt RS, triple top, 1.3% yield |
| AIG | American International Group, Inc. | Insurance | $66.00 | hi 50s - low 60s | 68 | 52 | 4 for 5'er, top half of INSU sector matrix, LT pos mkt RS, multiple consec buy signals, 2.35% yield |
| COCO | Vita Coco Company, Inc. | Food Beverages/Soap | $28.34 | mid 20s | 36 | 23 | 4 for 5'er, top decile of FOOD sector matrix, multi consec buy signals, pullback from ATH |
| KRG | Kite Realty Group Trust | Real Estate | $22.75 | 19 - 21 | 34.50 | 16 | 5 for 5'er, 11 of 113 in REAL sector matrix, LT pos mkt RS, spread quintuple top, 4.65% yield |
| IONS | Ionis Pharmaceuticals Inc. | Biomedics/Genetics | $51.52 | 42 - hi 40s | 64 | 38 | 5 TA rating, top decile of BIOM matrix, consec. buy signals, LT RS buy |
| AXON | Axon Enterprise Inc. | Protection Safety Equipment | $236.36 | mid 200s - mid 220s | 278 | 174 | 5 TA rating, higher lows, pullback from rally high, pos. wkly mom. |
| BG | Bunge Limited | Food Beverages/Soap | $107.74 | lo 100s - mid 110s. | 169 | 89 | 5 TA rating, top decile of FOOD sector matrix, consec. buy signals, LT mkt RS pos., R-R > 3 |
| FDX | FedEx Corporation | Aerospace Airline | $265.60 | lo 230s - mid 250s | 364 | 190 | 4 TA rating, top 25% of AERO sector matrix, shakeout buy point, positive mkt RS, R-R > 2, Earn. 12/19 |
| OKE | ONEOK, Inc. | Gas Utilities | $70.21 | low-to-mid 60s | 89 | 55 | 5 for 5'er, top third of GUTI sector matrix, triple top, pullback to oversold, R-R>2.0, 5.8% yield |
| CME | CME Group, Inc. | Wall Street | $219.79 | 200s - mid 210s | 272 | 174 | 4 for 5'er, #5 of 32 in WALL sector matrix, one box from market RS buy, 2% yield |
| ORCL | Oracle Corporation | Software | $115.78 | mid 100s - mid 110s | 138 | 96 | 5 for 5'er, top half of SOFT sector matrix, LT pos mkt RS, trend chart signal flip, 1.5% yield, Earn 12/11 |
| CDW | CDW Corp. | Computers | $212.60 | 200 - 220 | 278 | 184 | 4 for 5'er, top third of COMP sector matrix, LT pos mkt RS, triple top, 1.1% yield |
| CNC | Centene Corporation | Healthcare | $74.03 | hi 60s - hi 70s | 98 | 60 | 5 TA rating, top quintile of healthcare sector matrix, consec. buy signals, LT mkt RS buy |
| ABCB | Ameris Bancorp | Banks | $46.38 | low 40s | 57 | 34 | 4 for 5'er, top quartile of BANK sector matrix, pos trend flip, 1.4% yield |
| AEO | American Eagle Outfitters, Inc. | Retailing | $19.63 | 16 - 19.50 | 33 | 14 | 5 TA rating, top quintile of RETA sector matrix, consec. buy signals, R-R > 3.5. |
| AMZN | Amazon.com Inc. | Internet | $144.88 | 140 - lo 150s | 200 | 118 | 4 TA rating, top 25% of INET sector matrix, consec. buy signals, LT pos trend |
| SBUX | Starbucks Corporation | Restaurants | $97.60 | mid 90s - mid 100s | 137 | 82 | 4 TA rating, top 33% of REST sector matrix, LT RS buy, buy-on-pullback, R-R > 2 |
| NVO | Novo Nordisk A/S (Denmark) ADR | Drugs | $100.92 | high-90s to high-100s | 121 | 86 | 5 for 5'er, has maintained Pos. Trend since June 2004, Shakeout completed in Nov., Monthly Mom. Pos., Top Decile of Drug Matrix |
| MOD | Modine Manufacturing Company | Autos and Parts | $52.60 | 50 - 54 | 77 | 38 | 4 for 5'er, new ATH, pos. trend since 7/22, top quartile of Autos Sector Matrix. |
| WH | Wyndham Hotels & Resorts Inc | Leisure | $78.21 | low 70s - low 80s | 103 | 65 | 4 TA rating, top quartile of leisure sector matrix, consec. buy signals, LT RS buy, R-R > 2. |
| Symbol | Company | Sector | Current Price | Action Price | Target | Stop | Notes |
|---|
| Symbol | Company | Sector | Current Price | Action Price | Target | Stop | Notes |
|---|---|---|---|---|---|---|---|
| ACGL | Arch Capital Group Ltd. | Insurance | $81.99 | 69 | ACGL moved to a sell signal Monday. Current exposure may maintain the $69 stop. |
| Comment | |||||||
|---|---|---|---|---|---|---|---|
|
|
|||||||
WH Wyndham Hotels & Resorts Inc R ($77.47) - Leisure - WH has a strong 4 for 5 TA rating and sits in the top quartile of the leisure sector RS matrix. This stock moved higher last week to break a spread triple top at $79, marking a second consecutive buy signal. WH has been on an RS buy signal against the market since May 2020 and moved back to a positive trend in October, highlighting further long-term technical improvement. The overall weight of the technical evidence is favorable here. The past few days of market action have seen WH retract from that high, offering a more opportune entry point. Exposure may be considered in the low $80s to mid-$70s. Our initial stop will be positioned at $65, which would violate multiple support levels and move the stock to a negative trend. The bullish price objective of $103 will serve as our price target, offering a reward-to-risk ratio north of 2.
| 23 | ||||||||||||||||||||||||||||||||||||||||||||||||||||
| 83.00 | • | Top | 83.00 | |||||||||||||||||||||||||||||||||||||||||||||||||
| 82.00 | X | • | • | 82.00 | ||||||||||||||||||||||||||||||||||||||||||||||||
| 81.00 | X | X | O | • | X | • | 81.00 | |||||||||||||||||||||||||||||||||||||||||||||
| 80.00 | X | O | X | O | • | X | O | • | 80.00 | |||||||||||||||||||||||||||||||||||||||||||
| 79.00 | X | X | O | X | O | • | 2 | O | 3 | • | • | C | 79.00 | |||||||||||||||||||||||||||||||||||||||
| 78.00 | X | O | X | 6 | O | • | X | O | X | O | • | X | • | • | X | X | 78.00 | |||||||||||||||||||||||||||||||||||
| 77.00 | X | O | X | X | O | • | X | O | X | O | • | X | O | 9 | • | X | O | X | 77.00 | |||||||||||||||||||||||||||||||||
| 76.00 | X | O | X | O | X | O | • | X | X | O | O | • | X | O | X | O | X | O | X | 76.00 | ||||||||||||||||||||||||||||||||
| 75.00 | X | O | X | O | X | O | • | X | O | X | O | • | • | X | 8 | X | O | X | O | X | 75.00 | |||||||||||||||||||||||||||||||
| 74.00 | X | O | O | X | O | • | X | O | X | X | O | • | X | • | X | O | X | O | X | O | B | 74.00 | ||||||||||||||||||||||||||||||
| 73.00 | O | O | • | X | B | X | O | X | X | O | • | X | O | X | O | O | X | O | X | Mid | 73.00 | |||||||||||||||||||||||||||||||
| 72.00 | O | X | X | • | X | O | X | O | X | O | 1 | O | • | X | O | X | O | X | O | X | 72.00 | |||||||||||||||||||||||||||||||
| 71.00 | O | X | O | 8 | O | • | X | X | O | X | C | X | O | X | O | X | • | 6 | O | X | O | X | O | 71.00 | ||||||||||||||||||||||||||||
| 70.00 | O | X | X | O | X | O | X | O | X | O | O | O | X | O | X | X | O | X | O | 7 | O | X | 70.00 | |||||||||||||||||||||||||||||
| 69.00 | O | X | O | X | O | X | O | X | X | O | X | O | X | • | O | X | O | 4 | 5 | X | O | X | O | X | A | X | 69.00 | |||||||||||||||||||||||||
| 68.00 | O | X | O | X | O | O | X | O | X | X | O | O | • | O | X | O | X | O | X | O | X | O | O | X | • | O | X | • | 68.00 | |||||||||||||||||||||||
| 67.00 | O | X | O | X | O | X | O | X | O | X | • | O | X | O | X | O | X | O | X | O | X | • | O | X | • | 67.00 | ||||||||||||||||||||||||||
| 66.00 | O | X | O | X | O | X | X | O | X | O | X | • | O | O | X | O | X | O | X | • | O | • | O | • | 66.00 | |||||||||||||||||||||||||||
| 65.00 | O | X | O | X | 9 | X | O | X | O | O | X | • | O | O | O | X | • | • | • | 65.00 | ||||||||||||||||||||||||||||||||
| 64.00 | O | X | 7 | O | X | O | X | O | A | • | O | • | 64.00 | |||||||||||||||||||||||||||||||||||||||
| 63.00 | O | O | O | O | X | • | • | Bot | 63.00 | |||||||||||||||||||||||||||||||||||||||||||
| 62.00 | O | X | • | 62.00 | ||||||||||||||||||||||||||||||||||||||||||||||||
| 61.00 | O | X | • | 61.00 | ||||||||||||||||||||||||||||||||||||||||||||||||
| 60.00 | O | X | • | 60.00 | ||||||||||||||||||||||||||||||||||||||||||||||||
| 59.00 | O | • | 59.00 | |||||||||||||||||||||||||||||||||||||||||||||||||
| 58.00 | • | 58.00 | ||||||||||||||||||||||||||||||||||||||||||||||||||
| 23 |

| CNC Centene Corporation ($75.00) - Healthcare - CNC shares moved higher today to break a double top at $75 to mark its third consecutive buy signal. This 5 for 5'er has been in a positive trend since September and on an RS buy signal versus the market since March 2020. CNC shares are trading in actionable territory with a weekly overbought/oversold reading of 32%. From here, support is offered at $69. |
| GIB CGI Group Inc. ($103.21) - Computers - GIB moved higher Tuesday to break a double top at $104, marking a second consecutive buy signal. This 3 for 5'er moved to a positive trend in November and has been on an RS buy signal against the market since May 2007. The weight of the technical evidence is improving. Initial support is seen at $98 and $97, the current location of the bullish support line. Note the stock is at resistance at $104 with further resistance at the all-time high of $106. |
| Name | Option Symbol | Action | Stop Loss |
|---|---|---|---|
| Targa Resources Corp. - $87.93 | TRGP2415C90 | Buy the March 90.00 calls at 4.00 | 80.00 |
| Name | Option | Action |
|---|---|---|
| DraftKings Inc Class A ( DKNG) | Jan. 28.00 Calls | Stopped at 9.35 (CP: 8.70) |
| T-Mobile US Inc. ( TMUS) | Feb. 145.00 Calls | Raise the option stop loss to 10.25 (CP: 12.25) |
| Oracle Corporation ( ORCL) | Mar. 110.00 Calls | Stopped at 10.60 (CP: 10.10) |
| Tractor Supply Company ( TSCO) | Apr. 200.00 Calls | Stopped at 19.00 (CP: 18.00) |
| Name | Option Symbol | Action | Stop Loss |
|---|---|---|---|
| Target Corporation - $133.50 | TGT2415O135 | Buy the March 135.00 puts at 8.55 | 144.00 |
| Name | Option | Action |
|---|---|---|
|
|
||
| Name | Option Sym. | Call to Sell | Call Price | Investment for 500 Shares | Annual Called Rtn. | Annual Static Rtn. | Downside Protection |
|---|---|---|---|---|---|---|---|
| Dexcom Inc. $118.26 | DXCM2415C120 | Mar. 120.00 | 9.70 | $54,419.85 | 33.16% | 27.99% | 7.19% |
| Name | Action |
|---|---|
| Amazon.com Inc. (AMZN) - 144.88 | Sell the March 150.00 Calls. |
| Expedia Group Inc. (EXPE) - 139.82 | Sell the March 145.00 Calls. |
| Advanced Micro Devices, Inc. (AMD) - 118.57 | Sell the March 125.00 Calls. |
| Micron Technology, Inc. (MU) - 74.31 | Sell the March 77.50 Calls. |
| Take-Two Interactive Software, Inc. (TTWO) - 157.55 | Sell the March 160.00 Calls. |
| Name | Covered Write |
|---|---|
|
|
|
Daily Equity & Market Analysis
Loading, Please Wait...
