
Positive developments within the S&P 500 Equal Weighted Index (SPXEWI) have impacted the score of the US Money Market group and Money Market Percentile Rank (MMPR).
Check out this recent discussion with David Cohen and Matthew Patterson of HANDLS Indexes and David Miller of Catalyst Funds on the Strategy Shares Nasdaq 7HANDL Index, which aims to provide a 7% monthly distribution to investors through a well-diversified, multi-asset portfolio of ETFs. The Strategy Shares are distributed by Foreside Fund Services, LLC, which is not affiliated with Rational Advisors, Inc., or any of its affiliates.
As discussed in yesterday’s “Were You Aware…?”, the Russell 2000 Index RUT had notable outperformance relative to the Nasdaq-100 NDX during Friday’s trading. Along with RUT, the S&P 500 Equal Weighted Index SPXEWI was able to outperform the S&P 500 Index SPX by just shy of 1%, giving further credence to the average stock showing some signs of life. Last week marked the third week in a row that the S&P 500 Equal Weighted Index was able to either match or outperform the S&P 500. The continuation of positive US Equity performance from November into December has led to the SPXEWI to shift its trend back to positive on its default trend chart and exhibit positive RS. Following Friday’s action, SPXEWI reversed back into Xs on the RS chart comparing the Index to the DWA Money Market Proxy (13-Week T-Bill) MNMKT for the first time since reversing into Os back in March of this year. While SPXEWI is now favored over Cash from a relative standpoint, the RS chart comparing the S&P 500 Index SPX to MNYMKT remains in Os, favoring Cash.
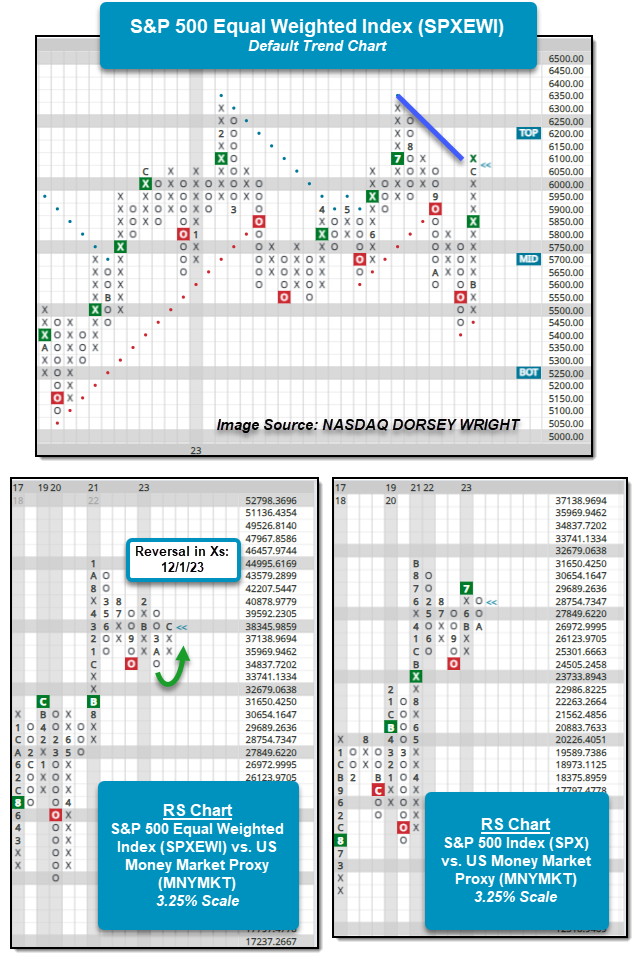
The positive RS gain by SPXEWI over our Cash proxy (MNYMKT) ultimately caused the Money Market Percentile Rank (MMPR) and the score of the US Money Market group on the Asset Class Group Scores page to fall notably. The US Money Market group fell from a score of 2.79 to 2.34 after Friday, the lowest score for the group in more than 12 months. The group continues to score above 2, which has been the case for 471 trading days now. This marks the second longest period that the US Money Market group has maintained its score above 2, with the longest period beginning at the start of our data set (9/26/2005) and lasting until May 2009 for a total of 912 trading days. Historically speaking, daily returns for the market tend to be better when the US Money Market group scores below 2.

The drop in the US Money Market group’s score impacts the Money Market Percentile Rank (MMPR) as well, with MMPR falling from 33% to 13% after Friday’s trading. This is the first time, MMPR has been below the 20th percentile since June and marks the lowest reading since February. Low MMPR readings, like low US Money Market scores, tend to occur during bull market environments for equities, and while action in 2023 has been positive – mostly for the large cap space – MMPR has been above average and elevated compared to other years, especially those that in which US Equities faired well. Historically, MMPR’s average annual reading going back to 2005 sits at roughly 21%, suggesting that Cash tends to fair better than roughly 1/5th of the 134 total groups on the ACGS page at any given time. The average MMPR reading for 2023 sits at 36% and there have only been 27 trading days (out of 232 so far) in which MMPR has been below 20%. The only year with a lower percentage of days with MMPR below 20% is 2008 and the average MMPR reading during that year was 74%. Although MMPR has been elevated compared to the historical average for much of 2023, the last month of positive performance has changed that stance drastically.

The relative improvement of the average stock as defined by the S&P 500 Equal Weighted Index SPXEWI has been the near-term catalyst that has led to weakness within the US Money Market group and the drop in MMPR. But it shouldn’t be forgotten that improvement within the Fixed Income space has been responsible for the increase in groups showing positive RS relative to Cash as well. There are still some select areas of the global market that are showing weakness relative to Cash. Most notably, China and Asia-Pacific groups along with some US sectors like Basic Materials, Consumer Staples, Real Estate, and Healthcare. With areas of the equity and fixed income spaces reaching overbought or extended territory, it will be intriguing to see where the US Money Market group may move to or settle with a potential pullback or consolidation in the offing.
