Most Requested Symbols

We examine areas of the market, outside of fixed income, that could benefit from a potential decline in yields.
The average distribution level is 47.83%.
Today's featured stock is Cardinal Health, Inc. (CAH).
Comments include: HP, LCRX, META, & O.
Call: Stryker (SYK); Put: Huntington Bancshares (HBAN); Covered Write: CF Industries (CF)
NDW Morning Update Video - July 28, 2023
NDW Morning Update Video – July 28, 2023.
Click here to download MP3
Beginners Series Webinar: Join us on Friday, July 28th at 2 PM (ET) for our NDW Beginners Series Webinar. This week's topic is: Dynamic Asset Level Investing (DALI) and DALI Strategies Register Here
Domestic Equites have had a busy week. From yesterday’s Fed rate hike decision, 2nd quarter GDP coming in higher than expected today, and a slew of household names reporting earnings this week it doesn’t seem like there could be a more action-packed week for the market. All things considered, results across the board have been mostly positive. Strong earnings from META & GOOGL highlight a continuously strong tech focused market, and positive results from Boeing (BA) pushed the Dow Jones Industrial Average .DJIA to tie (but unfortunately not break…) its longest daily gain streak in history. The one hang-up from a macro perspective seems to be a continuously strong labor market, leaving the door open for future rate hikes, which would hinder the equity space and drive concerns that further tightening could jeopardize the chance of a soft landing.

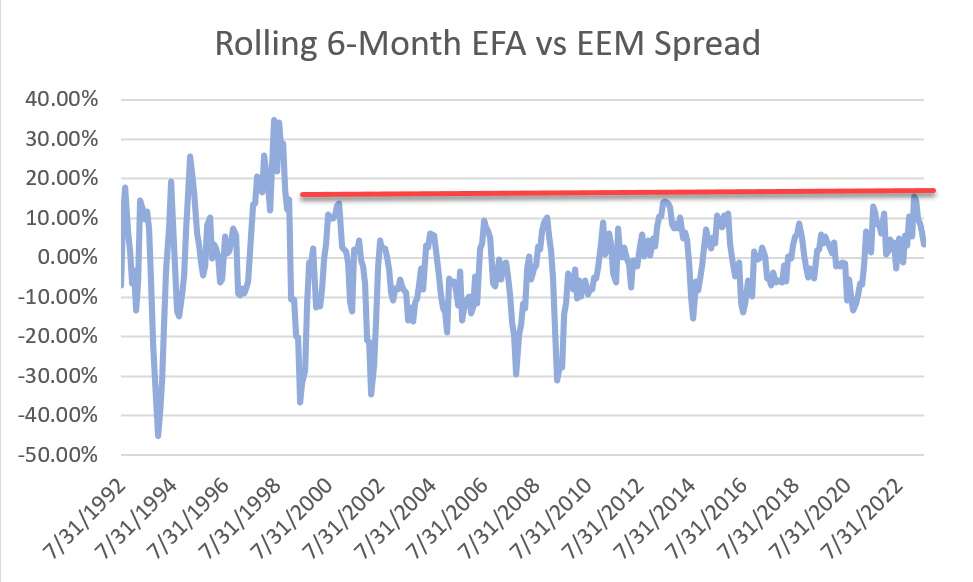
The domestic equity rise has provided a nice break from discussing the international space, which we certainly covered at length throughout the last quarter of 2022 and first of 2023 as the space roared forwards in the face of domestic declines. That certainly isn’t to say that the space hasn’t had its fair share of notable technical improvements, however. From a macro perspective, the space has been aided by a technical breakdown from the US Dollar DX/Y, but it is worth noting that inflation globally has been a bit stickier than we have found here in the US. For now, the former has been the market's main focus, with the broad space maintaining its relative strength across both DALI and the Asset Class Group Scores (ACGS) page. Within the group, a variety of areas have been actionable throughout the year, although we have mentioned a number of times the current preference for developed markets. Developed markets proxy EFA is outperforming emerging proxy EEM by just roughly 3.5% since the start of 2023. This theme is echoed by each fund's respective fund score (EEM’s 3.58 vs. EFA’s 4.18), which suggests developed markets remain resilient. Throughout the course of July, however, EEM has outperformed SPX and EFA by over 1.2%, suggesting some aspects of near-term strength. This strength was enough to see EEM post a second consecutive buy signal and move to new rally highs.

But is this outperformance for the emerging space simply a bump in the road or a sign of changing tides? While no one indicator is a “silver bullet” as they say, one aspect which we typically use as a judge of where we stand from a historical standpoint between two groups are performance spreads. With this in mind, one can run rolling 6-month performance spreads between the funds in hopes of identifying patterns that arise. As seen in the chart below, there does seem to be an emerging cap around the 15% outperformance of EFA in favor of EEM, at which EEM begins to outperform. Remember, an uptick in outperformance for one group does not necessarily mean one group is falling while the other is rising (as both can be moving higher/lower, just of different magnitudes…) but it is notable nonetheless. All things considered, keep an eye on emerging markets and their strength over the coming weeks to see who can hold the strength within the international space.


September 14th and 15th
The Symposium is pending approval of CE credit toward the CFP®, CIMA®, CPWA®, and RMA certifications.
Event Agenda Coming Soon
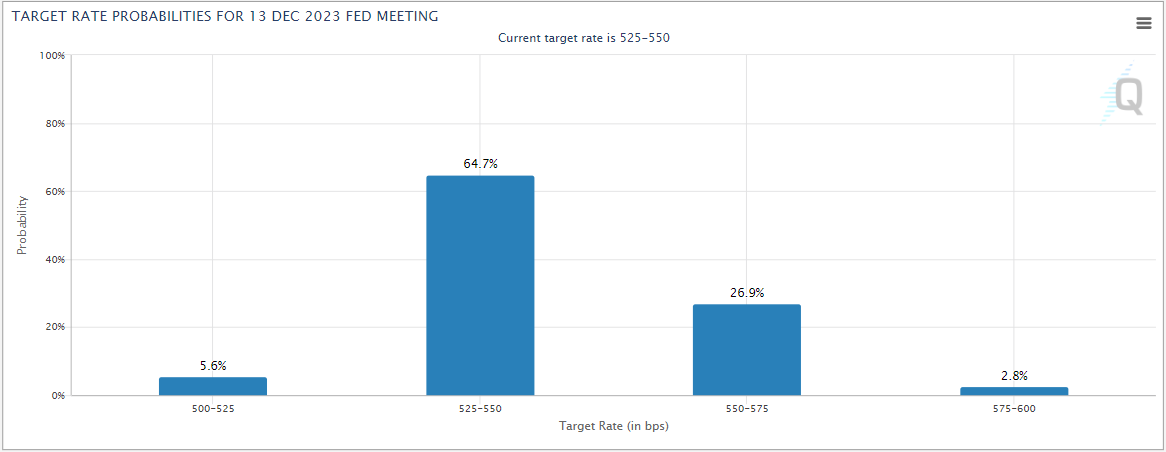
The Federal Reserve concluded its July meeting yesterday (Wednesday, 7/26) and raised the federal funds rate by 25 basis points, as had been widely expected. In the press conference following the meeting Chair Powell said that the FOMC’s decisions about future rate hikes would continue to be data-driven. With June CPI reading showing that inflation has continued moderate, there has been speculation that this could be the final hike in the Fed’s tightening cycle. Fed futures are currently pricing in a 70% chance that the federal funds rate will be at or below its current target of 500-525 basis points at year-end.
It’s a given that the end of the Fed’s tightening cycle would be a welcome development for bond investors. But today, we wanted to take a look at which other areas of the market might stand to benefit (or struggle) if rates begin to decline. The table below shows the correlations of the two-, five-, and 10-year US Treasury yields to the 11 S&P 500 sector indices, the SPDR Gold Trust (GLD), the iShares Silver Trust (SLV) and the S&P GSCI Commodities Trust. All else being equal, we would expect those assets with positive correlations (in green) to perform better when yields are rising and those with negative correlations (in red) to perform better when yields are falling.
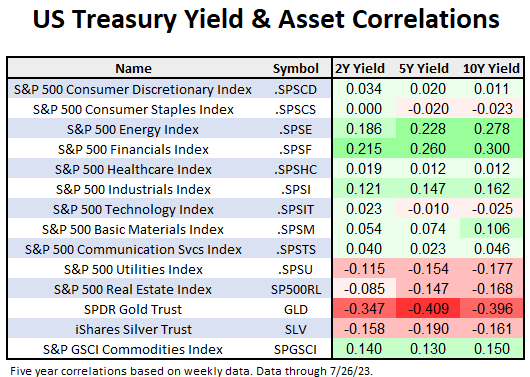
One of the first things we see is that most of the S&P 500 sectors have weakly positive relationships to yields; although rising yields are often talked about as a headwind for equities due to higher borrowing costs and their effect on valuations, rising yields are most often seen during periods of economic expansion, periods when we also expect equities to perform well. Two sectors – energy and financials – have relatively strong correlations to yields. The basic business model of banks is to borrow on the short end of the curve and lend on the long end and spreads between short- and long-term yields are generally wider when yields are higher, helping to boost banks’ profits. The energy sector’s relatively strong positive correlation to yields is likely due to the increased demand for energy during periods of economic expansion as opposed to a direct relationship to profitability.
On the other end of the spectrum, utilities and real estate are the sectors that show the strongest negative correlations to yields and therefore would be expected to be among the sectors most helped by falling yields. For real estate investment trusts (REITs), lower rates mean lower mortgage payments and higher profits. Additionally, both REITs and utilities typically carry above-average yields and are therefore more attractive to yield-seeking investors.
Gold shows a stronger relationship to yields than any of the 11 equity sectors, and interestingly, has had a significantly higher correlation to yields than silver has over the last five years. When yields are lower, especially when real yields are near zero or negative, precious metals are relatively more attractive as a store of wealth as investors earn relatively little (or even lose money in real terms) by investing in Treasuries. As to why gold has exhibited a stronger inverse relationship to yields than silver, this may be due to silver having more industrial uses, making its price less dependent on its attractiveness as a store of wealth. It is worth pointing out that commodities at large do not exhibit the same inverse relationship to yields, as the table shows the S&P GSCI Commodities Trust (SPGSCI) shows a positive correlation to short- and long-term yields.
Unlike fixed income, where interest rates are the most important driver of prices for most segments of the market, the direction of yields is a secondary consideration for equities. Even for those sectors showing relatively high correlations to yields – like financials and utilities – there are more important drivers of performance. So, it would be imprudent to base an investment based only on an opinion about the direction of yields. Currently, utilities and real estate, the two sectors most likely to benefit from a decline in yields rank ninth and 11th in the DALI sector rankings respectively, squarely in underweight territory. Furthermore, at this point, there is no technical evidence that a decline in US Treasury yields is imminent. The US Treasury 10-year Yield Index (TNX) remains on multiple consecutive buy signals and crossed above 4% again on Thursday following the stronger-than-expected Q2 GDP numbers.
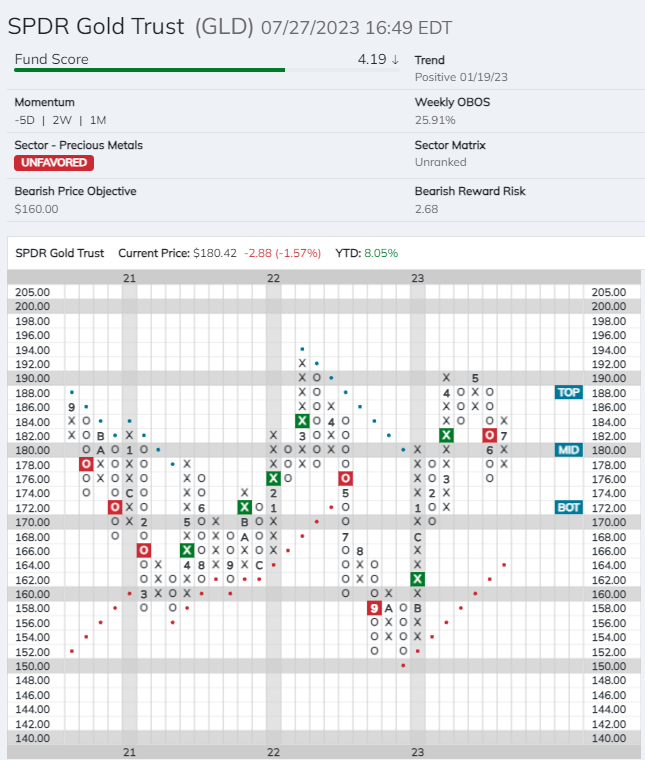
For those intent on trying to front run a potential move in interest rates, the SPDR Gold Trust (GLD) may be the most attractive option as it has an already sound technical picture to which a potential decline in yields could be an added tailwind. The fund currently has a favorable 4.19 fund score, which is 0.75 points better than the average for all precious metals funds. GLD returned to a positive trend on its default in January and is currently in the action phase of a potential shakeout pattern, which would be completed with a triple top breakout at $1920. $176 could be considered as a potential stop-loss and it would violate the potential shakeout pattern.

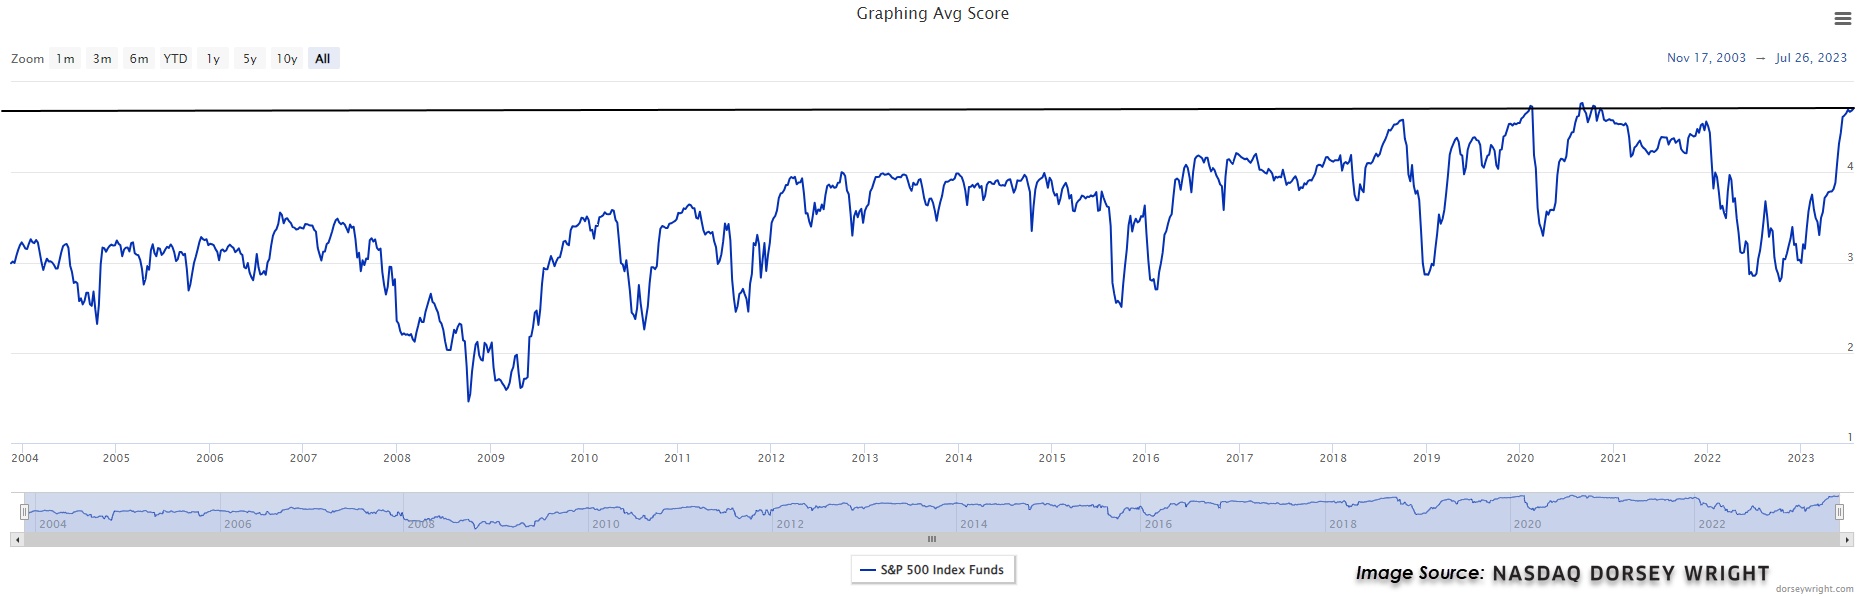
Domestic equities have roared back in 2023 led by some of the largest names putting up triple-digit returns like Tesla (TSLA), Nvidia (NVDA), and Meta (META). This has led the S&P 500 Index Funds group to reach an average score of 4.70 for only the third time in its history dating back to 2004. The other two periods when the group reached a score of 4.70 was in February 2020 and then a few times from August to November 2020. While both these periods were followed by big moves, one in each direction, it does show how narrow the equity market is right now. The Equity Core Percentile Rank has sat around 98% since the end of May meaning that the S&P 500 Index Funds group has scored higher than 98% of all groups tracked for nearly two months. This doesn’t mean the market is headed for disaster but rather that the narrowness of the market will have difficulty lasting much longer. Both average score for the S&P 500 Index Funds Group and the Equity Core Percentile Rank have reached these levels before, but they typically do not last for a long period. It would be expected that there will be some broadening out of the market or at least a few groups that begin to challenge the core of the market.
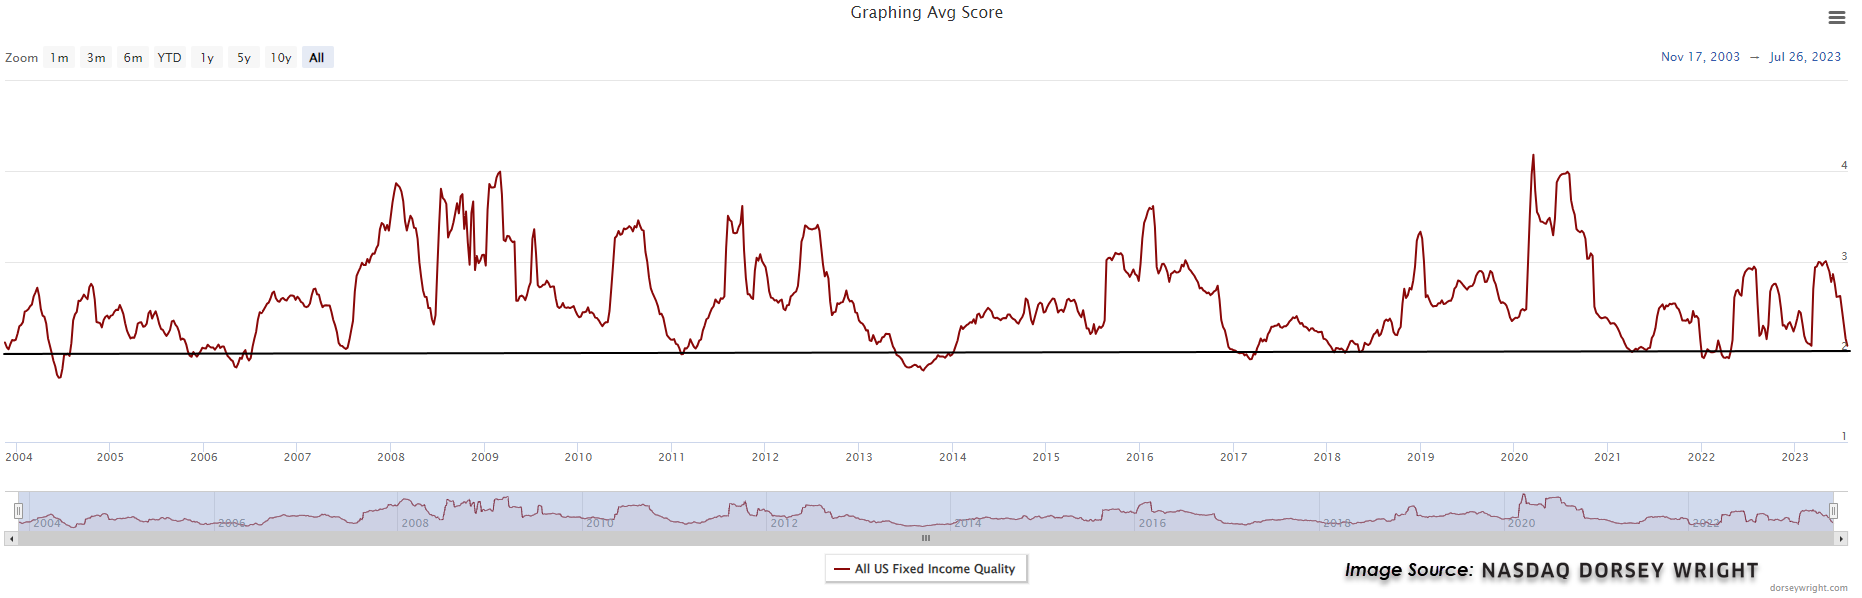
On the exact opposite side of the coin, the All US Fixed Income Group is scoring close to the 2.0 level, an area rarely visited for very long. The weakness in the fixed income space has been on the heels of the most aggressive Federal Reserve rate hiking cycle in recent history. Coupled with the strength in equities, fixed income groups mostly lack any relative or absolute strength. However, given the group’s current score there could be some contrarian opportunities. For example, if some clients need to do a change in allocation due to their age or they’re close to retirement, then now might be a good time to think about having those conversations. Touched on in more detail in today’s featured article, it does appear that the Fed is near or at the end of its rate hiking cycle which may give some respite to the fixed income space. The asset class is still one to avoid overweighting for the time being, but for those that need exposure, it’s not the worst time to dip your toes in at these levels.
Average Level
47.83
| < - -100 | -100 - -80 | -80 - -60 | -60 - -40 | -40 - -20 | -20 - 0 | 0 - 20 | 20 - 40 | 40 - 60 | 60 - 80 | 80 - 100 | 100 - > |
|---|---|---|---|---|---|---|---|---|---|---|---|
|
Buy signaleem
|
|||||||||||
|
Buy signalijr
|
Sell signalijh
|
||||||||||
|
Buy signaloneq
|
Buy signaldia
|
||||||||||
|
Buy signaliwm
|
Buy signalRSP
|
||||||||||
|
Buy signallqd
|
Buy signalXLG
|
Buy signalgcc
|
|||||||||
|
Sell signalGLD
|
Buy signalicf
|
Sell signaldvy
|
Buy signalVOOV
|
||||||||
|
Sell signalief
|
Buy signalefa
|
Buy signalqqq
|
Buy signaluso
|
Buy signalspy
|
|||||||
|
Sell signaldx/y
|
Buy signalshy
|
Sell signaltlt
|
Sell signalagg
|
Buy signalhyg
|
Buy signalfxe
|
Buy signalvoog
|
Buy signalgsg
|
||||
| < - -100 | -100 - -80 | -80 - -60 | -60 - -40 | -40 - -20 | -20 - 0 | 0 - 20 | 20 - 40 | 40 - 60 | 60 - 80 | 80 - 100 | 100 - > |
| AGG | iShares US Core Bond ETF |
| USO | United States Oil Fund |
| DIA | SPDR Dow Jones Industrial Average ETF |
| DVY | iShares Dow Jones Select Dividend Index ETF |
| DX/Y | NYCE U.S.Dollar Index Spot |
| EFA | iShares MSCI EAFE ETF |
| FXE | Invesco CurrencyShares Euro Trust |
| GLD | SPDR Gold Trust |
| GSG | iShares S&P GSCI Commodity-Indexed Trust |
| HYG | iShares iBoxx $ High Yield Corporate Bond ETF |
| ICF | iShares Cohen & Steers Realty ETF |
| IEF | iShares Barclays 7-10 Yr. Tres. Bond ETF |
| LQD | iShares iBoxx $ Investment Grade Corp. Bond ETF |
| IJH | iShares S&P 400 MidCap Index Fund |
| ONEQ | Fidelity Nasdaq Composite Index Track |
| QQQ | Invesco QQQ Trust |
| RSP | Invesco S&P 500 Equal Weight ETF |
| IWM | iShares Russell 2000 Index ETF |
| SHY | iShares Barclays 1-3 Year Tres. Bond ETF |
| IJR | iShares S&P 600 SmallCap Index Fund |
| SPY | SPDR S&P 500 Index ETF Trust |
| TLT | iShares Barclays 20+ Year Treasury Bond ETF |
| GCC | WisdomTree Continuous Commodity Index Fund |
| VOOG | Vanguard S&P 500 Growth ETF |
| VOOV | Vanguard S&P 500 Value ETF |
| EEM | iShares MSCI Emerging Markets ETF |
| XLG | Invesco S&P 500 Top 50 ETF |

| Symbol | Company | Sector | Current Price | Action Price | Target | Stop | Notes |
|---|---|---|---|---|---|---|---|
| GPK | Graphic Packaging Intl. | Forest Prods/Paper | $23.95 | 21 - 23 | 26 | 18 | 5 for 5'er, #2 of 15 in favored FORE sector matrix, LT pos mkt RS, triple top, 1.3% yield, Earn. 8/1 |
| V | Visa Inc. | Finance | $237.10 | 210s - 220s | 262 | 188 | 5 for 5'er top third of FIN sector matrix, LT pos mkt RS, spread quintuple top |
| BJRI | BJ's Restaurants Inc. | Restaurants | $33.58 | low 30s | 55 | 26 | 3 for 5'er, top third of favored REST sector matrix, triple top, pullback from 52-week high, R-R>3.5, Earn. 7/27 |
| TXRH | Texas Roadhouse, Inc. | Restaurants | $112.93 | 100s | 125 | 90 | 5 TA rating, top half REST sector matrix, consec. buy signals, LT RS buy, 2.10% yield, Earn. 7/27 |
| BRK.B | Berkshire Hathaway Inc | Insurance | $349.80 | mid 300s - low 330s | 396 | 280 | 5 TA rating, top third of INSU sector matrix, LT pos. trend, LT RS buy, buy-on-pullback |
| DRI | Darden Restaurants, Inc. | Restaurants | $169.02 | mid 150s - mid 160s | 192 | 130 | 5 TA rating, pos. trend, LT RS buy, pos. weekly mom., recent price normalization |
| VVV | Valvoline Inc | Autos and Parts | $39.45 | mid - hi 30s | 53 | 30 | 5 TA rating, top third in the AUTO sector RS matrix, consec. buy signals, buy-on-pullback, R-R > 2, Earn. 8/1 |
| PEP | PepsiCo, Inc. | Food Beverages/Soap | $191.60 | 180 - lo 190s | 250 | 152 | 4 TA rating, top third of FOOD sector matrix, LT RS buy, normalized entry point, 2.72% yield |
| ANSS | Ansys Inc | Software | $338.48 | 320s - 340s | 404 | 280 | 5 for 5'er, top third of SOFT sector matrix, LT pos mkt RS, multiple consec buy signals, Earn. 8/2 |
| SEM | Select Medical Holdings Corporation | Healthcare | $31.17 | hi 20s - lo 30s | 52.50 | 23 | 5 TA rating, top third of HEAL sector matrix, LT RS buy, normalized prices, recent pos. wkly mom., R-R > 3, Earn. 8/3 |
| MDLZ | Mondelez International, Inc. Class A | Food Beverages/Soap | $73.67 | hi 60s - mid 70s | 95 | 59 | 4 for 5'er. top 25% of favored FOOD sector matrix, multiple buy signals, pullback from ATH, 2.1% yield, Earn. 7/27 |
| AJG | Arthur J. Gallagher & Co. | Insurance | $219.75 | hi 200s - hi 210s | 298 | 180 | 5 for 5'er, 10 of 71 in favored INSU sector matrix, LT pos mkt RS, R-R>2.0, Earn. 7/27 |
| RSG | Republic Services, Inc. | Waste Management | $152.87 | lo 140s - mid 150s | 190 | 120 | 5 TA rating, top third of WAST sector matrix, consec. buy signals, pos. wkly mom., Earn. 7/31 |
| ALKS | Alkermes Incorporated | Biomedics/Genetics | $30.05 | hi 20s - low 30s | 48 | 24 | 5 for 5'er, top half of favored BIOM sector matrix, spread triple top, pull back from 52-week high, R-R>3.0, Earn. 7/27 |
| AFL | AFLAC Incorporated | Insurance | $72.77 | hi 60s - lo 70s | 87 | 56 | 5 TA rating, top quintile of INSU sector matrix, LT pos. trend, RS buy, recent consec. buy signals, Earn. 8/1 |
| ACA | Arcosa Inc | Transports/Non Air | $76.33 | low-to-mid $70s | 98 | 65 | 4 for 5'er, #8 of 50 in favored TRAN sector matrix, one box from peer RS buy signal, R-R>2.0, Earn. 8/1 |
| LIN | Linde Plc | Chemicals | $388.21 | 370s - 380s | 440 | 316 | 5 for 5'er, #6 of 47 in favored CHEM sector matrix, LT pos mkt RS, triple top, 1.35% yield |
| VRTX | Vertex Pharmaceuticals Incorporated | Biomedics/Genetics | $351.91 | hi 330s - lo 370s | 444 | 280 | 4 TA rating, top half of BIOM sector matrix, consec. buy signals, LT RS buy, pos. wkly and mo. momentum flips, Earn. 8/1 |
| SPB | Spectrum Brands Holdings | Food Beverages/Soap | $78.18 | mid-to-hi 70s | 97 | 63 | 5 for 5'er, #3 of 78 in favored FOOD sector matrix, LT pos mkt RS, 2.2% yield, Earn 8/10 |
| FERG | Ferguson PLC | Building | $160.69 | lo 150s - mid 160s | 204 | 132 | 4 TA rating, LT mkt RS buy & pos. trend, consec. buy signals, near-term price consolidation |
| LULU | Lululemon Athletica Inc. | Retailing | $378.98 | 370s - 390s | 452 | 320 | 5 for 5'er, top 25% of RETA sector matrix, triple top |
| INTU | Intuit Inc. | Software | $496.86 | 470s - 490s | 672 | 400 | 4 for 5'er, favored SOFT sector matrix, LT pos mkt RS, spread quintuple top, pos trend flip, Earn. 8/21 |
| HWC | Hancock Whitney Corp | Banks | $44.49 | hi 30s - mid 40s | 66 | 34 | 5 TA rating, top half of BANK sector matrix, LT RS buy, pos. wkly mom., 2.83% yield |
| MSFT | Microsoft Corporation | Software | $337.77 | 330s - 350s | 376 | 272 | 5 for 5'er, top third of favored SOFT sector matrix, LT pos RS, multiple buy signals, pullback from ATH |
| CAH | Cardinal Health, Inc. | Drugs | $92.28 | hi 80s - mid 90s | 112 | 74 | 5 TA rating, top quintile of DRUG sector matrix, consec. buy signals, buy-on-pullback, Earn. 8/15 |
| Symbol | Company | Sector | Current Price | Action Price | Target | Stop | Notes |
|---|---|---|---|---|---|---|---|
| LAUR | Laureate Education Inc | Business Products | $12.49 | (11.50-12.50) | 6 | 13.50 | 2 for 5'er, LT negative trend & market RS, spread triple bottom, R-R>3.0, Earn. 8/2 |
| Symbol | Company | Sector | Current Price | Action Price | Target | Stop | Notes |
|---|---|---|---|---|---|---|---|
| CMCSA | Comcast Corporation | Media | $42.91 | 37 | CMCSA moved into overbought territory after releasing earnings Thursday. We will raise our stop to $37. | ||
| HCA | HCA Healthcare Inc. | Healthcare | $282.18 | 236 | HCA moved to a sell signal Thursday. Current exposure may maintain the $236 stop. |
| Comment | |||||||
|---|---|---|---|---|---|---|---|
|
|
|||||||
CAH Cardinal Health, Inc. R ($92.43) - Drugs - CAH has a strong 5 for 5 TA rating and sits in the top quintile of the drugs sector RS matrix. The stock moved back into a positive trend in April and continued higher to give three consecutive buy signals before reaching a new all-time high at $95 last month. We also saw the stock move back to a relative strength buy signal against the market last month, adding to the positive technical picture. The market action over the last two weeks saw CAH pull back from that extended position, offering a more opportune entry point for potential long investors. Exposure may be considered in the high $80s to mid-$90s. Our initial stop will be set at $74, which would violate multiple support levels and move the stock into a negative trend. The bullish price objective of $112 will serve as our price target. Note that earnings are expected on 8/15.
| 22 | 23 | ||||||||||||||||||||||||||||||||||||||||||||||||||||
| 95.00 | X | 95.00 | |||||||||||||||||||||||||||||||||||||||||||||||||||
| 94.00 | X | O | 94.00 | ||||||||||||||||||||||||||||||||||||||||||||||||||
| 93.00 | X | O | 93.00 | ||||||||||||||||||||||||||||||||||||||||||||||||||
| 92.00 | X | 7 | 92.00 | ||||||||||||||||||||||||||||||||||||||||||||||||||
| 91.00 | X | 91.00 | |||||||||||||||||||||||||||||||||||||||||||||||||||
| 90.00 | X | 90.00 | |||||||||||||||||||||||||||||||||||||||||||||||||||
| 89.00 | X | Mid | 89.00 | ||||||||||||||||||||||||||||||||||||||||||||||||||
| 88.00 | X | 88.00 | |||||||||||||||||||||||||||||||||||||||||||||||||||
| 87.00 | X | X | 87.00 | ||||||||||||||||||||||||||||||||||||||||||||||||||
| 86.00 | X | O | X | 86.00 | |||||||||||||||||||||||||||||||||||||||||||||||||
| 85.00 | X | O | X | 85.00 | |||||||||||||||||||||||||||||||||||||||||||||||||
| 84.00 | X | O | 6 | 84.00 | |||||||||||||||||||||||||||||||||||||||||||||||||
| 83.00 | 5 | X | O | X | 83.00 | ||||||||||||||||||||||||||||||||||||||||||||||||
| 82.00 | X | O | X | O | X | 82.00 | |||||||||||||||||||||||||||||||||||||||||||||||
| 81.00 | X | C | • | X | O | X | O | Bot | 81.00 | ||||||||||||||||||||||||||||||||||||||||||||
| 80.00 | X | O | X | O | X | X | • | X | O | X | 80.00 | ||||||||||||||||||||||||||||||||||||||||||
| 79.00 | X | O | X | O | X | X | O | X | O | • | X | O | X | 79.00 | |||||||||||||||||||||||||||||||||||||||
| 78.00 | B | O | X | O | X | O | X | X | O | X | O | • | X | O | 78.00 | ||||||||||||||||||||||||||||||||||||||
| 77.00 | X | O | X | O | X | O | X | O | X | O | O | X | 77.00 | ||||||||||||||||||||||||||||||||||||||||
| 76.00 | X | O | X | 1 | O | X | O | X | O | 4 | 76.00 | ||||||||||||||||||||||||||||||||||||||||||
| 75.00 | X | O | X | O | X | 2 | 3 | X | 75.00 | ||||||||||||||||||||||||||||||||||||||||||||
| 74.00 | X | O | O | O | X | • | 74.00 | ||||||||||||||||||||||||||||||||||||||||||||||
| 73.00 | X | O | X | • | 73.00 | ||||||||||||||||||||||||||||||||||||||||||||||||
| 72.00 | X | X | O | X | X | • | 72.00 | ||||||||||||||||||||||||||||||||||||||||||||||
| 71.00 | X | 9 | O | X | X | O | X | O | X | • | 71.00 | ||||||||||||||||||||||||||||||||||||||||||
| 70.00 | X | O | X | O | A | O | X | • | O | X | O | X | • | 70.00 | |||||||||||||||||||||||||||||||||||||||
| 69.00 | X | O | X | O | X | X | O | X | • | O | O | • | 69.00 | ||||||||||||||||||||||||||||||||||||||||
| 68.00 | X | O | X | O | X | O | X | O | X | • | • | 68.00 | |||||||||||||||||||||||||||||||||||||||||
| 67.00 | X | O | O | X | O | X | O | • | 67.00 | ||||||||||||||||||||||||||||||||||||||||||||
| 66.00 | X | O | O | X | • | 66.00 | |||||||||||||||||||||||||||||||||||||||||||||||
| 65.00 | • | X | O | • | 65.00 | ||||||||||||||||||||||||||||||||||||||||||||||||
| 64.00 | X | • | X | • | 64.00 | ||||||||||||||||||||||||||||||||||||||||||||||||
| 63.00 | X | O | • | X | • | 63.00 | |||||||||||||||||||||||||||||||||||||||||||||||
| 62.00 | X | O | • | X | • | 62.00 | |||||||||||||||||||||||||||||||||||||||||||||||
| 61.00 | • | X | O | • | X | • | 61.00 | ||||||||||||||||||||||||||||||||||||||||||||||
| 60.00 | X | X | • | X | O | • | 8 | • | 60.00 | ||||||||||||||||||||||||||||||||||||||||||||
| 59.00 | X | O | 7 | O | • | 4 | O | • | X | • | 59.00 | ||||||||||||||||||||||||||||||||||||||||||
| 58.00 | O | 6 | O | X | O | • | X | O | X | X | • | X | • | 58.00 | |||||||||||||||||||||||||||||||||||||||
| 57.00 | O | X | O | X | 8 | • | X | 5 | X | O | X | O | X | • | 57.00 | ||||||||||||||||||||||||||||||||||||||
| 56.00 | O | X | O | • | O | • | X | O | X | O | X | O | X | • | 56.00 | ||||||||||||||||||||||||||||||||||||||
| 55.00 | O | • | • | O | • | X | 3 | O | O | X | 6 | X | 7 | • | 55.00 | ||||||||||||||||||||||||||||||||||||||
| 54.00 | • | O | X | • | • | X | O | X | • | O | O | X | O | X | • | 54.00 | |||||||||||||||||||||||||||||||||||||
| 53.00 | O | 9 | 1 | O | X | • | 2 | O | X | • | O | X | O | X | • | 53.00 | |||||||||||||||||||||||||||||||||||||
| 52.00 | O | X | O | X | O | X | O | X | O | • | O | X | O | • | 52.00 | ||||||||||||||||||||||||||||||||||||||
| 51.00 | O | X | O | B | X | O | X | O | X | • | O | X | • | 51.00 | |||||||||||||||||||||||||||||||||||||||
| 50.00 | O | O | X | O | X | O | X | O | • | O | • | 50.00 | |||||||||||||||||||||||||||||||||||||||||
| 49.00 | A | X | O | X | O | • | • | 49.00 | |||||||||||||||||||||||||||||||||||||||||||||
| 48.00 | O | O | X | • | 48.00 | ||||||||||||||||||||||||||||||||||||||||||||||||
| 47.00 | O | X | • | 47.00 | |||||||||||||||||||||||||||||||||||||||||||||||||
| 46.00 | C | • | 46.00 | ||||||||||||||||||||||||||||||||||||||||||||||||||
| 22 | 23 |
| HP Helmerich & Payne, Inc. ($44.64) - Oil Service - HP returned to a positive trend on Thursday, when it reached $45. The technical outlook remains negative as even with the positive trend change HP is a 2 for 5'er and ranks in the bottom decile of the oil service sector matrix. The stock now sits against resistance at $45. Meanwhile, support sits at $31. |
| LRCX Lam Research Corporation ($701.95) - Semiconductors - LRCX moved higher Thursday after their earnings release to break a double top at $664 before reaching $712 intraday. This 3 for 5'er moved to a positive trend in November and ranks in the top third of the semiconductors sector RS matrix. The weight of the technical evidence is positive, as the stock has given 8 consecutive buy signals and is now within one box of moving back to an RS buy signal against the market. However, LRCX is now in an overbought position, so those looking to add exposure may be best served waiting for a pullback or normalization of the trading band. Initial support can be seen at $616 with further support at $600. |
| META Meta Platform Inc. ($311.71) - Internet - META jumped as much as 6% on the day today after a strong earnings report, moving back up to the top of the trading band. This strong 5/5'er has had a stellar 2023, up over 150% at the time of this comment. As the name continues to run up despite being overbought, consider dollar cost averaging into positions going forward. |
| O Realty Income Corporation ($62.19) - Real Estate - Shares of O reentered a positive trend on Thursday and increased to a 3 for 5 attribute rating. However, the stock remains within a defined trading range. Further bullish confirmation would come with a break past January 2023 resistance at $68. Note earnings are expected on 8/2. |
| Name | Option Symbol | Action | Stop Loss |
|---|---|---|---|
| Stryker Corporation - $282.01 | SYK2315L280 | Buy the December 280.00 calls at 19.50 | 264.00 |
| Name | Option | Action |
|---|---|---|
| Comcast Corporation ( CMCSA) | Oct. 40.00 Calls | Raise the option stop loss to 3.95 (CP: 5.95) |
| CBRE Group, Inc. ( CBRE) | Sep. 80.00 Calls | Stopped at 8.30 (CP: 5.10) |
| The Hershey Company ( HSY) | Nov. 250.00 Calls | Stopped at 232.00 (CP: 233.56) |
| Name | Option Symbol | Action | Stop Loss |
|---|---|---|---|
| Huntington Bancshares Incorporated - $12.00 | HBAN2419M12 | Buy the January 12.00 puts at 1.00 | 13.00 |
| Name | Option | Action |
|---|---|---|
| The Walt Disney Company (DIS) | Sep. 95.00 Puts | Raise the option stop loss to 8.20 (CP: 10.20) |
| Quest Diagnostics Incorporated (DGX) | Nov. 140.00 Puts | Initiate an option stop loss of 5.60 (CP: 7.60) |
| Southwest Airlines Co. (LUV) | Dec. 37.50 Puts | Initiate an option stop loss of 2.85 (CP: 4.85) |
| Micron Technology, Inc. (MU) | Nov. 65.00 Puts | Stopped at 70.00 (CP: 71.07) |
| Global Payments Inc. (GPN) | Nov. 115.00 Puts | Initiate an option stop loss of 8.30 (CP: 10.30) |
| Name | Option Sym. | Call to Sell | Call Price | Investment for 500 Shares | Annual Called Rtn. | Annual Static Rtn. | Downside Protection |
|---|---|---|---|---|---|---|---|
| CF Industries Holdings, Inc. $81.65 | CF2317K85 | Nov. 85.00 | 5.10 | $38,612.80 | 29.11% | 17.71% | 5.20% |
| Name | Action |
|---|---|
| CrowdStrike Holdings, Inc. Class A (CRWD) - 154.63 | Sell the October 155.00 Calls. |
| Roku, Inc. Class A (ROKU) - 71.47 | Sell the October 65.00 Calls. |
| Palantir Technologies Inc. Class A (PLTR) - 16.43 | Sell the November 18.00 Calls. |
| Schlumberger Limited (SLB) - 57.67 | Sell the November 60.00 Calls. |
| Aptiv PLC (APTV) - 110.39 | Sell the November 115.00 Calls. |
| Generac Holdings, Inc. (GNRC) - 151.99 | Sell the November 145.00 Calls. |
| Arista Networks Inc (ANET) - 164.45 | Sell the December 180.00 Calls. |
| Norwegian Cruise Line Holdings Ltd. (NCLH) - 20.77 | Sell the December 22.00 Calls. |
| KB Home (KBH) - 53.85 | Sell the October 55.00 Calls. |
| Wynn Resorts, Limited (WYNN) - 109.53 | Sell the December 110.00 Calls. |
| Hess Corporation (HES) - 147.62 | Sell the November 150.00 Calls. |
| Caesars Entertainment Inc. (CZR) - 59.38 | Sell the December 60.00 Calls. |
| Name | Covered Write |
|---|---|
|
|
|
Daily Equity & Market Analysis
Loading, Please Wait...
