Most Requested Symbols

The average distribution level is 13.75%.
Today's featured stock is Mondelez International, Inc. Class A (MDLZ).
BWA, CASY, CDW, FRT, HXL, MANH, MAR, OTTR, and V
Call: Walmart (WMT); Put: Snap Inc (SNAP); Covered Write: International Gaming Technology (IGT).
NDW Morning Update Video - July 3, 2023
NDW Morning Update Video
Click here to download MP3
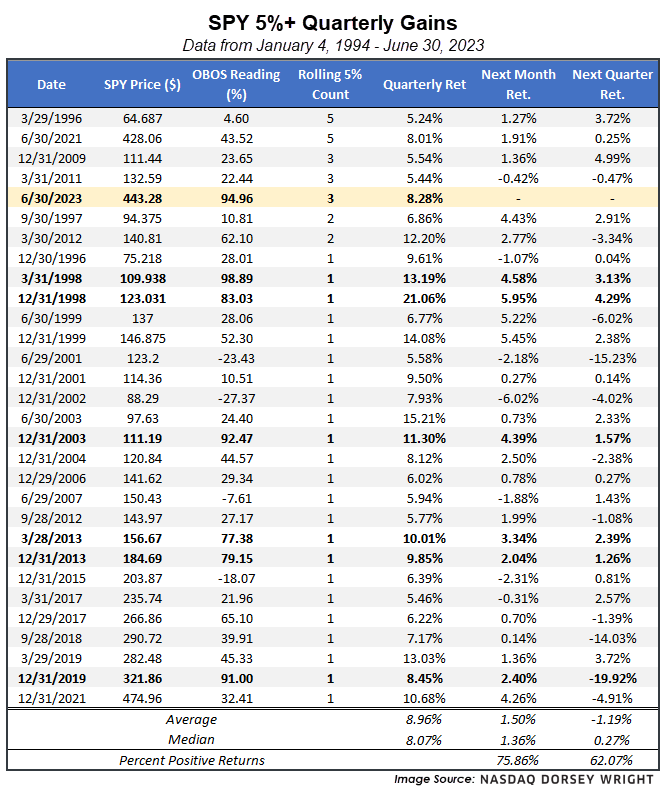
The S&P 500 Index posted a gain of more than 8% during the year's second quarter, marking the third consecutive quarter that it has appreciated at least 7%. This leaves the core market benchmark in rare air, as we have not seen all that many instances of such consistent improvement on a quarter-over-quarter basis. Using the SPDR S&P 500 ETF Trust SPY as a proxy, we have seen the fund rise at least 5% during a calendar quarter on 30 occasions, including the most recent quarter that ended Friday. Somewhat ironically, that equates to roughly 25% of the quarterly periods since the inception of SPY in 1993. Of those 30 instances, only six other periods have seen 5%+ rallies in consecutive quarters, and only four other periods have seen that occur in at least three consecutive quarters. The most consecutive quarterly rallies of at least 5% ended in March 1996 and June 2021, which were tied at 5 consecutive quarters each. As we can see from the table below, SPY has typically posted a positive return in the month following these quarters, at a 75% positive hit rate with an average gain of 1.5%. Keep in mind that these only include the periods where we did not see a 5% rally continue in the next quarter, which is still possible in the third quarter of this year.
Another interesting point can be seen by examining the weekly overbought/oversold (OBOS) level of SPY at the end of each quarter in the table. Only six of the 29 other instances saw SPY in an overbought position, with a weekly OBOS reading north of 70% (periods bolded below). Five of those six instances saw sustained improvement following the quarter end. The lone exception was the pandemic-induced market decline experienced after the end of 2019.
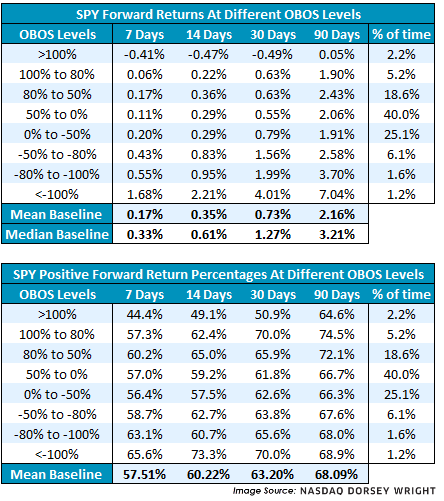
The improvement experienced in the first half of the year has left many broad domestic equity indices in an overbought position as we enter July, but that does not necessarily mean we are in for declines after the Fourth of July holiday. SPY is sitting at an intraday OBOS reading of 97% at the time of this writing Friday, which is the most overbought it has been at the end of a week since August 28, 2020. In fact, only about 7% of the trading days since the inception of the fund have seen it at an overbought reading of 80% or higher. Examining forward returns from different baskets of weekly OBOS readings shows that they do not have as drastic of an effect on further movement as you might expect. The only negative averages over a forward 7, 14, 30, or 90-day timeframe occur when we see OBOS readings north of 100%, which has only happened on 2.2% of the trading days since 1993. Even the overbought readings in the 80% to 100% range still show positive average forward returns, albeit slightly lower than the average forward returns over the same timeframes from any trading day. The percentage of positive forward returns are greater than 50% in each of the timeframes examined in each OBOS basket, except for the forward one- and two-week numbers when SPY is greater than 100% overbought. These examples are not meant to discredit the OBOS reading as an indicator, as we still see lower-than-average forward returns after elevated weekly OBOS readings. We also see higher-than-average forward returns when the OBOS level is in a washed-out position. Rather, this data reinforces that the OBOS reading is most helpful to monitor for mean reversion potential, not an indication of the potential for technical weakness from extended positions.

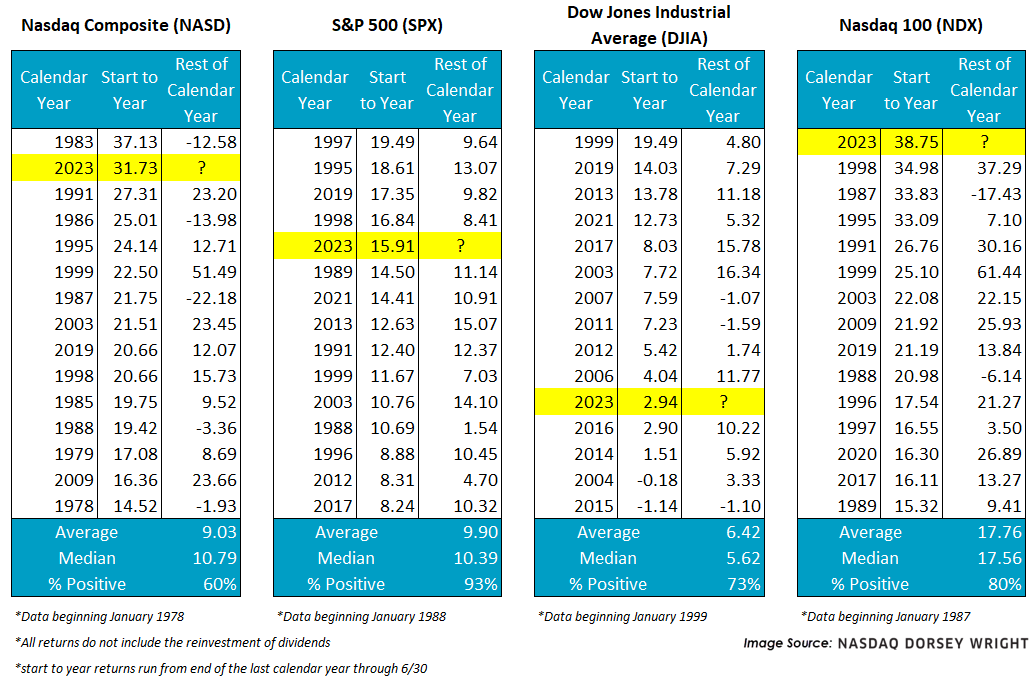
Today (6/30) marks the last trading day for the month of June, which solidified a 15%+ first half (1H) gain for the S&P 500 (SPX) and Nasdaq Composite (NASD). In fact, the S&P 500 had its fifth-best start to a year while the Nasdaq Composite had its second-best start to a year; meanwhile, the Nasdaq 100 (NDX) posted its best start to a year on record with a gain of nearly 40%. In the case of the Dow Jones Industrial Average (.DJIA), the first half of 2023 was just its 11th-best start to a year as it materially trailed the rest of the large-cap pack.
Note that despite the historic advances, these benchmarks still sit comfortably beneath their late 2021 chart highs.
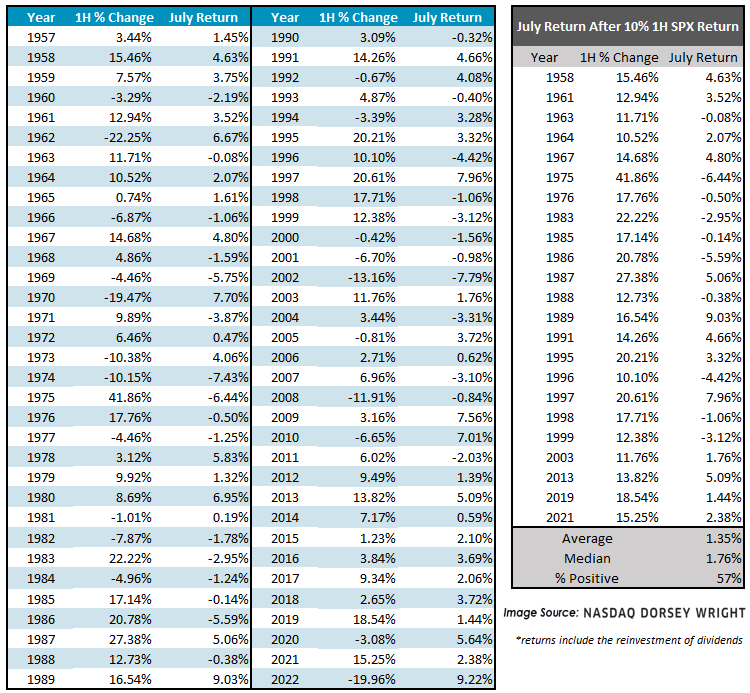
June typically ushers in the summer experiences like beach trips and hours at the pool, along with lackluster performances from stocks…making the return table above even more impressive. Since 1928, June has a median return south of 0.5%, and since 1957 that median return figure drops to just 0.3%. So, what is to say about the month of July with a historically strong 1H in our rearview mirror?
Before delving into conditional July returns, let’s begin with the raw figures. Since 1928, the month of July has been one of the strongest summer months with a median gain of over 1.5% for SPX; furthermore, July has posted a positive return 62% of the time. The second image below reveals that not only has July typically been positive, but the worst experienced return (loss of 7.9%) is the most favorable compared to the other summer months as well as the max return of 9.1%.

Now, what about the hot start to the year? Is there any historical evidence that July returns deviate from their norm if the market is up over 10% in the first six months? In short, not much.
The left-hand table below outlines every 1H percent change for the S&P 500 and the subsequent return for the month of July since 1957. The right-hand table singles out the instances where SPX was up at least 10%. As we can see, the month of July has still posted an average gain of 1.35% and a median return of 1.76% after SPX rallied 10%+ in the first half of the year, which is in line with historical readings (if not a bit better). Additionally, a 57% positive hit rate is about average.
All that said, there is increased potential for quarter-end and semiannual rebalancing headwinds. For instance, with equity returns comfortably outpacing most bond returns so far this year strategic asset allocations are likely outside their target ranges, which could encourage many investors to trim equities and buy bonds to reset their desired exposure.
It is also worth acknowledging that earnings season will (again) soon be upon us in July, which tends to bring some amount of increased volatility to the markets. To this point, the CBOE SPX Volatility Index (VIX) has gradually been trending down and recently reached its lowest level in over three years. However, notice in the line chart below that the 2023 VIX has, at least directionally, been tracking its average annual progression. To calculate the grey line below, we simply averaged the daily VIX reading every day across all years since 1992 (excluding 2023).
If this trend were to hold, we could see the VIX continue lower early in July before rising towards the latter part of the month (which would coincide with earnings and continued rebalancing). Remember that expectations for volatility and equity returns are often inversely correlated, so when the VIX rises SPX typically falls.
This is not intended to taint the historical behavior of July that we have outlined today, after all the VIX often finds a bottom late in the month, but it should serve as a reminder that not all signals point in the same direction. Understanding both the technical tailwinds and headwinds for the market is equally important, that way if (when) things begin to change we can know which direction the breeze might be blowing from.

Portfolio View - Major Market ETFs
| Symbol | Name | Price | Yield | PnF Trend | RS Signal | RS Col. | Fund Score | 200 Day MA | Weekly Mom | OBOS (Weekly) | ||
|---|---|---|---|---|---|---|---|---|---|---|---|---|
| DIA | SPDR Dow Jones Industrial Average ETF Trust | 341.16 | 1.98 | Positive | Sell | O | 2.69 | 329.10 | +3W |
|
||
| EEM | iShares MSCI Emerging Markets ETF | 39.25 | 2.47 | Positive | Sell | X | 2.97 | 38.52 | +5W |
|
||
| EFA | iShares MSCI EAFE ETF | 71.62 | 2.50 | Positive | Sell | X | 4.08 | 67.66 | -7W |
|
||
| FM | iShares Frontier and Select EM ETF | 25.80 | 2.71 | Positive | Sell | O | 2.55 | 25.31 | +5W |
|
||
| IJH | iShares S&P MidCap 400 Index Fund | 259.90 | 1.74 | Positive | Sell | X | 4.33 | 246.96 | +5W |
|
||
| IJR | iShares S&P SmallCap 600 Index Fund | 99.56 | 1.62 | Positive | Sell | O | 2.43 | 96.62 | +11W |
|
||
| QQQ | Invesco QQQ Trust | 363.81 | 0.63 | Positive | Sell | X | 4.90 | 300.87 | -1W |
|
||
| RSP | Invesco S&P 500 Equal Weight ETF | 148.33 | 1.86 | Negative | Buy | O | 3.81 | 142.75 | +4W |
|
||
| SPY | SPDR S&P 500 ETF Trust | 438.11 | 1.55 | Positive | Sell | X | 4.44 | 399.01 | +5W |
|
||
| XLG | Invesco S&P 500 Top 50 ETF | 344.89 | 1.13 | Positive | Buy | X | 5.79 | 298.93 | -1W |
|
Additional Comments:
The SPDR Dow Jones Industrial Average ETF Trust DIA remains in a column of X’s this week, sitting at $345. However, the fund remains below an acceptable score, scoring at 2.69. It also still scores below the average US score of 3.52. DIA remains in a positive trend at current levels. Support is offered at $315 with overhead resistance at $345-$350.
The iShares MSCI Emerging Markets ETF EEM remains on a buy signal this week but does remains in a column of O’s at this point at a chart reading of $39.50. EEM now scores below the acceptable 3.0 threshold with a score posting of 2.97. The fund sees initial support at $38, with more substantial support down around $37.
The iShares MSCI EAFE ETF EFA remains in a column of O’s this week after recently pulling back toward the middle of the trading band. Developed markets have been an area of strength throughout 2023, showcased by EFA’s strong 4.08 fund score. The ETF remains in a positive trend at current levels with established support offered at $67.
The iShares MSCI Frontier and Select EM ETF FM remains in a column of O’s this week. The fund has a weak score of 2.55 yet is now paired with a positive 1.10 score direction. FM is seen at a price of $24.50. Support is seen below at $23.50, lows for 2022. Further downside participation would see the fund test its bullish support line.
The iShares S&P MidCap 400 Index Fund IJH maintains its column of X’s this week after bouncing off its bullish support line in March. The fund also remains in a positive trend, recently advancing to a price of $260. IJH has a current fund score of 4.33 which is now above the average US score of 3.52. From here, overhead resistance is found at $270 with the bullish support line found below.
The iShares S&P SmallCap 600 Index Fund IJR reversed back into a column of X’s this week, sitting at a price of $100. Despite the recent action, IJR maintains an improved but unacceptable 2.43 fund score. Support is offered below at $92, with overhead resistance found at $100, the highs for the year.
The Invesco QQQ Trust QQQ remains in a column of X’s this week and is seen at a price of $370. Recent positive participation sees the fund hold a strong 4.90 fund score and is paired with an intensely positive 3.25 score direction. This now outpaces the average US fund, which shows a 3.52 average score. Initial support is offered at $290, well below current levels. QQQ sits in heavily overbought territory so a near-term pullback into O’s could be expected.
The Invesco S&P 500 Equal Weight ETF RSP moved back into a positive trend this week and is now seen at a price of $150. RSP holds a negative 1.68 score direction and now displays a 3.81 fund score. This is still behind the average S&P 500 Index fund score of 4.66. The spread between the two has been widening over the last few weeks. Support is now seen at $140.
The SPDR S&P 500 ETF Trust SPY remains in a column of Xs this week and trades at a price of $450. The fund now posts a strong 4.44 fund score, besting the average US fund score of 3.52. Recent action saw the fund return to a column of X’s against SPXEWI suggesting near-term strength for the cap-weighted names. Support is seen at $385 on the default chart, March lows.
The Invesco S&P 500 Top 50 ETF XLG remains in a column of X’s this week, seen at a price of $350. It remains on a string of now three consecutive buys signals. Furthermore, XLG now has a near-perfect 5.79 fund score with a now positive score direction of 4.10. XLG scores above the average US Fund (3.49) and has shown resilience in line with other larger names over the past week. Support is seen at $285 on the default chart, notably below current levels.

Average Level
13.75
| < - -100 | -100 - -80 | -80 - -60 | -60 - -40 | -40 - -20 | -20 - 0 | 0 - 20 | 20 - 40 | 40 - 60 | 60 - 80 | 80 - 100 | 100 - > |
|---|---|---|---|---|---|---|---|---|---|---|---|
|
Sell signaluso
|
|||||||||||
|
Sell signallqd
|
Buy signalijr
|
||||||||||
|
Sell signalagg
|
Buy signalgsg
|
Buy signaliwm
|
Buy signalvoog
|
||||||||
|
Sell signalgcc
|
Sell signaldvy
|
Buy signalhyg
|
Buy signalRSP
|
Buy signalXLG
|
|||||||
|
Sell signalGLD
|
Sell signalTLT
|
Buy signaleem
|
Sell signaldx/y
|
Buy signalVOOV
|
Buy signalqqq
|
||||||
|
Buy signalshy
|
Sell signalief
|
Buy signalefa
|
Buy signalfxe
|
Sell signalicf
|
Buy signaldia
|
Sell signalijh
|
Buy signalspy
|
Buy signaloneq
|
|||
| < - -100 | -100 - -80 | -80 - -60 | -60 - -40 | -40 - -20 | -20 - 0 | 0 - 20 | 20 - 40 | 40 - 60 | 60 - 80 | 80 - 100 | 100 - > |
| AGG | iShares US Core Bond ETF |
| USO | United States Oil Fund |
| DIA | SPDR Dow Jones Industrial Average ETF |
| DVY | iShares Dow Jones Select Dividend Index ETF |
| DX/Y | NYCE U.S.Dollar Index Spot |
| EFA | iShares MSCI EAFE ETF |
| FXE | Invesco CurrencyShares Euro Trust |
| GLD | SPDR Gold Trust |
| GSG | iShares S&P GSCI Commodity-Indexed Trust |
| HYG | iShares iBoxx $ High Yield Corporate Bond ETF |
| ICF | iShares Cohen & Steers Realty ETF |
| IEF | iShares Barclays 7-10 Yr. Tres. Bond ETF |
| LQD | iShares iBoxx $ Investment Grade Corp. Bond ETF |
| IJH | iShares S&P 400 MidCap Index Fund |
| ONEQ | Fidelity Nasdaq Composite Index Track |
| QQQ | Invesco QQQ Trust |
| RSP | Invesco S&P 500 Equal Weight ETF |
| IWM | iShares Russell 2000 Index ETF |
| SHY | iShares Barclays 1-3 Year Tres. Bond ETF |
| IJR | iShares S&P 600 SmallCap Index Fund |
| SPY | SPDR S&P 500 Index ETF Trust |
| TLT | iShares Barclays 20+ Year Treasury Bond ETF |
| GCC | WisdomTree Continuous Commodity Index Fund |
| VOOG | Vanguard S&P 500 Growth ETF |
| VOOV | Vanguard S&P 500 Value ETF |
| EEM | iShares MSCI Emerging Markets ETF |
| XLG | Invesco S&P 500 Top 50 ETF |
| Symbol | Company | Sector | Current Price | Action Price | Target | Stop | Notes |
|---|---|---|---|---|---|---|---|
| GPK | Graphic Packaging Intl. | Forest Prods/Paper | $23.67 | 21 - 23 | 26 | 18 | 5 for 5'er, #2 of 15 in favored FORE sector matrix, LT pos mkt RS, triple top, 1.3% yield |
| V | Visa Inc. | Finance | $234.32 | 210s - 220s | 262 | 188 | 5 for 5'er top third of FIN sector matrix, LT pos mkt RS, spread quintuple top, Earn. 7/24 |
| MRK | Merck & Co., Inc. | Drugs | $113.54 | mid 100s - low 110s | 137 | 89 | 4 for 5'er top third of DRUG sector matrix, multiple consec buys, pullback from ATH, 2.7% yield |
| BJRI | BJ's Restaurants Inc. | Restaurants | $31.43 | low 30s | 55 | 26 | 3 for 5'er, top third of favored REST sector matrix, triple top, pullback from 52-week high, R-R>3.5, Earn. 7/19 |
| FI | Fiserv, Inc. | Computers | $124.05 | mid 100s - mid 110s | 123 | 91 | 5 for 5'er, top 25% of COMP sector matrix, LT pos mkt RS, pullback from 52-week high, Earn. 7/24 |
| TXRH | Texas Roadhouse, Inc. | Restaurants | $111.44 | 100s | 125 | 90 | 5 TA rating, top half REST sector matrix, consec. buy signals, LT RS buy, 2.10% yield, Earn. 7/26 |
| UBS | UBS AG (Switzerland) ADR | Banks | $20.01 | 18 - 22 | 38.50 | 16 | 5 for 5'er, #5 of 126 in BANK sector matrix, bullish triangle, R-R>4.0, 2.75% yield |
| BRK.B | Berkshire Hathaway Inc | Insurance | $336.91 | mid 300s - low 330s | 396 | 280 | 5 TA rating, top third of INSU sector matrix, LT pos. trend, LT RS buy, buy-on-pullback |
| CLX | The Clorox Company | Household Goods | $157.91 | 160s | 194 | 136 | 5 for 5'er, 7th of 26 in HOUS sector matrix, RS buy signal, triple top, 2.8% yield |
| AER | AerCap Holdings NV | Aerospace Airline | $62.25 | hi 50s - low 60s | 72 | 49 | 5 for 5'er, top half of AERO, sector matrix, triple top breakout |
| CBRE | CBRE Group, Inc. | Real Estate | $80.30 | 72 - low 80s | 91 | 66 | 4 TA rating, top half of REAL sector matrix, recent pos. trend, LT RS buy |
| DRI | Darden Restaurants, Inc. | Restaurants | $165.30 | mid 150s - mid 160s | 192 | 130 | 5 TA rating, pos. trend, LT RS buy, pos. weekly mom., recent price normalization |
| CMCSA | Comcast Corporation | Media | $41.47 | hi 30s - low 40s | 50 | 33 | 4 for 5'er, top third of MEDI sector matrix, multiple consec buy signal, pullback to middle of trading band, 2.94% yield |
| GE | General Electric Company | Electronics | $107.74 | hi 90s - hi 100s | -- | 86 | 5 for 5'er, #4 of 67 in ELEC sector matrix, LT pos mkt RS, triple top breakout, Earn. 7/25 |
| SHOP | Shopify Inc | Internet | $63.76 | hi 50s - low 60s | 81 | 51 | 5 for 5'er, #1 of 52 in INET sector matrix, bullish signal reversal, R-R>2.0, Earn. 7/25 |
| CRM | Salesforce Inc. | Software | $210.43 | hi 190s - 220 | 258 | 168 | 4 TA rating, top 20% of SOFT sector matrix, consec. buy signals, buy-on-pullback |
| AXP | American Express Company | Finance | $172.08 | mid 160s - mid 170s | 222 | 146 | 4 for 5'er, 14th of 72 in FINA sector matrix, pos trend flip, spread triple top, pos wkly mom flip, R-R>2.0, Earn. 7/21 |
| IPG | The Interpublic Group of Companies, Inc. | Media | $38.09 | hi 30s - low 40s | 66 | 32 | 5 for 5'er, #1 of 30 in MEDI sector matrix, spread quad top, R-R>3.0, 3.1% yield, Earn. 7/19 |
| VVV | Valvoline Inc | Autos and Parts | $36.49 | mid - hi 30s | 53 | 30 | 5 TA rating, top third in the AUTO sector RS matrix, consec. buy signals, buy-on-pullback, R-R > 2 |
| HCA | HCA Healthcare Inc. | Healthcare | $300.44 | mid 270s - lo 300s | 392 | 236 | 5 TA rating, top 20% of HEAL sector, consec. buy signals, LT market RS buy, buy-on-pullback, Earn. 7/20 |
| PEP | PepsiCo, Inc. | Food Beverages/Soap | $183.88 | 180 - lo 190s | 250 | 152 | 4 TA rating, top third of FOOD sector matrix, LT RS buy, normalized entry point, 2.72% yield, Earn. 7/13 |
| ANSS | Ansys Inc | Software | $326.05 | 320s - 340s | 404 | 280 | 5 for 5'er, top third of SOFT sector matrix, LT pos mkt RS, multiple consec buy signals |
| SEM | Select Medical Holdings Corporation | Healthcare | $32.17 | hi 20s - lo 30s | 52.50 | 23 | 5 TA rating, top third of HEAL sector matrix, LT RS buy, normalized prices, recent pos. wkly mom., R-R > 3 |
| AL | Air Lease Corp. | Aerospace Airline | $41.22 | hi 30s - low 40s | 64 | 35 | 4 for 5'er, favored AERO sector matrix, bullish triangle, R-R>4.0, 1.95% yield |
| FTNT | Fortinet Inc. | Software | $75.09 | hi 60s - low 70s | 92 | 60 | 5 for 5'er, top 25% of favored SOFT sector matrix, LT pos peer RS, triple top, good R-R |
| MMC | Marsh & McLennan Companies, Inc. | Insurance | $185.93 | mid 170s - low 190s | 244 | 150 | 5 TA rating, top third of INSU sector matrix, LT RS buy, consec. buy signals, pos wkly mom, Earn. 7/20 |
| BRO | Brown & Brown, Inc. | Insurance | $67.69 | mid-to-upper 60s | 93 | 55 | 5 for 5'er, favored INSU sector matrix, LT pos mkt RS, R-R>2.0, Earn. 7/24 |
| SFM | Sprouts Farmers Market, LLC | Food Beverages/Soap | $36.28 | mid-hi 30s | $49 | $29 | 5 TA rating, top quintile of favored FOOD matrix, LT pos trend, pos. monthly mom. |
| MDLZ | Mondelez International, Inc. Class A | Food Beverages/Soap | $72.28 | hi 60s - mid 70s | 95 | 59 | 4 for 5'er. top 25% of favored FOOD sector matrix, multiple buy signals, pullback from ATH, 2.1% yield, Earn. 7/24 |
| Symbol | Company | Sector | Current Price | Action Price | Target | Stop | Notes |
|---|---|---|---|---|---|---|---|
| LAUR | Laureate Education Inc | Business Products | $11.74 | (11.50-12.50) | 6 | 13.50 | 0 for 5'er, LT negative trend & market RS, spread triple bottom, OBOS>100%, R-R>3.0 |
| Symbol | Company | Sector | Current Price | Action Price | Target | Stop | Notes |
|---|---|---|---|---|---|---|---|
| TTWO | Take-Two Interactive Software, Inc. | Software | $145.47 | 130s | 182 | 108 | TTWO has moved into heavily overbought territory. OK to hold here. Raise stop to $130. |
| RS | Reliance Steel & Aluminum Co | Steel/Iron | $270.81 | mid 240s - low 260s | 320 | 204 | RS has moved into heavily overbought territory. OK to hold here. Raise stop to $228. |
| Comment | |||||||
|---|---|---|---|---|---|---|---|
|
|
|||||||
MDLZ Mondelez International, Inc. Class A R ($72.94) - Food Beverages/Soap - MDLZ is a 4 for 5'er that ranks in the top 25% of the favored food beverages/soap sector matrix. On its default chart, MDLZ has completed two consecutive buy signals and reached a new all-time high in April, before pulling back below the middle of its trading band. Long exposure may be added in the uppers $60s to mid $70s an we will set our initial stop at $59, which would violate MDLZ's bullish support line. We will use the bullish price objective, $95, as our target price. MDLZ also carries a 2.08% yield and is expected to report earnings on 7/24.
| 19 | 20 | 21 | 22 | 23 | |||||||||||||||||||||||||||||||||||||||||||||||||
| 78.00 | X | 78.00 | |||||||||||||||||||||||||||||||||||||||||||||||||||
| 77.00 | X | O | 77.00 | ||||||||||||||||||||||||||||||||||||||||||||||||||
| 76.00 | X | O | 76.00 | ||||||||||||||||||||||||||||||||||||||||||||||||||
| 75.00 | X | 5 | 75.00 | ||||||||||||||||||||||||||||||||||||||||||||||||||
| 74.00 | X | O | Mid | 74.00 | |||||||||||||||||||||||||||||||||||||||||||||||||
| 73.00 | X | O | 73.00 | ||||||||||||||||||||||||||||||||||||||||||||||||||
| 72.00 | X | 6 | 72.00 | ||||||||||||||||||||||||||||||||||||||||||||||||||
| 71.00 | 4 | 71.00 | |||||||||||||||||||||||||||||||||||||||||||||||||||
| 70.00 | X | 70.00 | |||||||||||||||||||||||||||||||||||||||||||||||||||
| 69.00 | X | X | 69.00 | ||||||||||||||||||||||||||||||||||||||||||||||||||
| 68.00 | X | O | 2 | • | C | X | Bot | 68.00 | |||||||||||||||||||||||||||||||||||||||||||||
| 67.00 | 1 | O | X | O | X | • | • | X | O | 2 | X | 67.00 | |||||||||||||||||||||||||||||||||||||||||
| 66.00 | X | O | X | O | X | X | O | • | X | • | X | O | X | O | X | 66.00 | |||||||||||||||||||||||||||||||||||||
| 65.00 | 7 | X | O | X | O | X | O | X | O | • | 8 | O | X | 1 | X | O | X | 65.00 | |||||||||||||||||||||||||||||||||||
| 64.00 | X | O | X | O | O | 4 | O | X | O | • | X | O | X | O | 3 | 64.00 | |||||||||||||||||||||||||||||||||||||
| 63.00 | X | O | X | X | 3 | X | 5 | O | X | X | • | X | O | X | 63.00 | ||||||||||||||||||||||||||||||||||||||
| 62.00 | 5 | 8 | B | O | C | O | X | • | O | X | O | X | O | X | O | B | 62.00 | ||||||||||||||||||||||||||||||||||||
| 61.00 | 4 | 9 | X | O | X | O | X | • | O | X | O | X | O | X | 9 | X | 61.00 | ||||||||||||||||||||||||||||||||||||
| 60.00 | • | 1 | X | O | X | O | X | O | • | O | 6 | X | 7 | • | O | X | • | 60.00 | |||||||||||||||||||||||||||||||||||
| 59.00 | X | • | • | 9 | X | X | O | X | O | X | O | • | • | O | X | • | O | X | • | 59.00 | |||||||||||||||||||||||||||||||||
| 58.00 | X | O | X | • | 8 | O | A | O | X | O | X | A | • | O | • | O | A | • | 58.00 | ||||||||||||||||||||||||||||||||||
| 57.00 | X | O | X | O | • | X | O | X | O | X | O | X | • | • | O | X | • | 57.00 | |||||||||||||||||||||||||||||||||||
| 56.00 | 9 | 1 | 2 | X | O | • | X | O | X | O | B | O | X | • | O | X | • | 56.00 | |||||||||||||||||||||||||||||||||||
| 55.00 | X | X | O | C | O | 3 | O | • | X | O | O | X | O | X | • | O | • | 55.00 | |||||||||||||||||||||||||||||||||||
| 54.00 | X | O | X | O | X | O | X | O | • | X | X | O | X | 2 | X | • | • | 54.00 | |||||||||||||||||||||||||||||||||||
| 53.00 | 6 | O | X | A | X | O | X | O | • | X | O | 6 | 7 | O | 3 | • | 53.00 | ||||||||||||||||||||||||||||||||||||
| 52.00 | X | 8 | O | O | O | • | • | X | O | X | O | X | • | • | 52.00 | ||||||||||||||||||||||||||||||||||||||
| 51.00 | 5 | O | X | • | X | O | X | O | X | • | 51.00 | ||||||||||||||||||||||||||||||||||||||||||
| 50.00 | X | O | X | X | O | X | O | X | O | • | 50.00 | ||||||||||||||||||||||||||||||||||||||||||
| 49.00 | 3 | O | X | O | X | X | O | X | 5 | • | 49.00 | ||||||||||||||||||||||||||||||||||||||||||
| 48.00 | X | O | X | O | X | O | X | 4 | • | 48.00 | |||||||||||||||||||||||||||||||||||||||||||
| 47.00 | 2 | O | • | O | X | O | X | X | • | 47.00 | |||||||||||||||||||||||||||||||||||||||||||
| 46.00 | X | • | O | X | O | X | O | X | • | 46.00 | |||||||||||||||||||||||||||||||||||||||||||
| 45.00 | • | X | • | O | O | X | O | X | • | 45.00 | |||||||||||||||||||||||||||||||||||||||||||
| 44.00 | O | X | • | O | O | X | • | 44.00 | |||||||||||||||||||||||||||||||||||||||||||||
| 43.00 | O | X | • | O | X | • | 43.00 | ||||||||||||||||||||||||||||||||||||||||||||||
| 42.00 | C | 1 | • | O | • | 42.00 | |||||||||||||||||||||||||||||||||||||||||||||||
| 41.00 | O | X | • | • | 41.00 | ||||||||||||||||||||||||||||||||||||||||||||||||
| 40.00 | O | X | • | 40.00 | |||||||||||||||||||||||||||||||||||||||||||||||||
| 39.00 | O | • | 39.00 | ||||||||||||||||||||||||||||||||||||||||||||||||||
| 19 | 20 | 21 | 22 | 23 |

| BWA BorgWarner Inc. ($49.13) - Autos and Parts - BWA broke a double top at $49 to return to a buy signal. BWA is a 3 for 5'er that ranks in the top half of the Autos and Parts sector matrix and is accompanied by a yield of roughly 1.5%. Resistance lies at current levels as well as at $51, the March rally high. Initial support lies at $45, while additional lies in the $43 to $42, the bullish support line. |
| CASY Casey's General Stores Inc ($244.09) - Retailing - CASY broke a double top at $244 for a second buy signal. The stock is a 4 for 5'er that ranks in the top half of the Retailing sector matrix, and this action brings the chart to one box below the stock's 52-week high at $248, reached in December 2022. Weekly momentum is positive. Initial support lies in the $216 to $212 range, the bullish support line, as well as at $204, the March 2023 low. |
| CDW CDW Corp. ($183.45) - Computers - CDW pushed higher Friday to break a double top at $182 before reaching $184 intraday. This also pushed through the bearish resistance line, moving the stock back to a positive trend and promoting it to a 4 for 5 TA rating. The weight of the technical evidence continues to improve. Initial support can be seen at $172, with several additional support levels offered down to $162. |
| FRT Federal Realty Investment Trust ($95.84) - Real Estate - FRT shares broke a double top at $98 on Friday, which was enough to put the stock back in a positive trend and increase the attribute rating to an acceptable 3 for 5'er. Further bullish confirmation would come with a break past resistance at $100. Initial support is currently distant, down around $90, |
| HXL Hexcel Corporation ($76.02) - Aerospace Airline - HXL is a strong 5/5'er that moved to new 2023 highs with today's action. With that said, it returned to a buy signal on its default chart, bouncing nicely off the bullish support line below. The stock remains in actionable territory and exposure could be considered at current levels. |
| MANH Manhattan Associates, Inc. ($199.88) - Software - MANH moved higher Friday to break a double top at $196, marking a fifth consecutive buy signal before reaching a new all-time high at $200 intraday. This 5 for 5'er moved to a positive trend in January and has been on an RS buy signal against the market since 2019. The weight of the technical evidence is overwhelmingly positive, however, the stock is now overbought. Initial support can be seen at $188 with further support at $172. |
| MAR Marriott International, Inc. ($183.86) - Leisure - MAR broke a spread quadruple top at $184 to return to a buy signal and reach a 52-week high. The stock is a 4 for 5'er that ranks in the top quartile of the Leisure sector matrix that is accompanied by a yield north of 1%. No near-term overhead resistance at current levels, but note the April 2022 rally high sits at $194. Support lies at $172, the bullies support line, and in the $166 to $164 range. |
| OTTR Otter Tail Power Co ($79.48) - Utilities/Electricity - OTTR broke a double top at $79 to complete a bullish triangle and for a third consecutive buy signal. The stock is a 4 for 5'er that ranks in the top quintile of the Utilities sector matrix and is accompanied by a yield of roughly 2.3%. Resistance lies at current levels as well as at $82, the August 2022 rally high. Initial support lies in the $74 to $73 range, while additional lies at $71. |
| V Visa Inc. ($237.78) - Finance - V shares moved higher today to break a triple top at $236 to mark its third consecutive buy signal. This 5 for 5'er has been in a positive trend since October 2022 and on an RS buy signal versus the market since November 2012. V shares are trading in actionable territory with a weekly overbought/oversold reading of 25%. From here, support is offered at $220. |
| Name | Option Symbol | Action | Stop Loss |
|---|---|---|---|
| Walmart Inc. - $157.18 | O: 23I155.00D15 | Buy the September 155.00 calls at 6.45 | 144.00 |
| Name | Option | Action |
|---|---|---|
| The TJX Companies, Inc. ( TJX) | Jul. 75.00 Calls | Raise the stock price stop loss to 0.00 (CP: 85.08) |
| CBRE Group, Inc. ( CBRE) | Sep. 80.00 Calls | Initiate an option stop loss of 1.80 (CP: 3.80) |
| Fiserv, Inc. ( FI) | Sep. 110.00 Calls | Raise the option stop loss to 15.90 (CP: 17.90) |
| General Electric Company ( GE) | Sep. 100.00 Calls | Initiate an option stop loss of 10.55 (CP: 12.55) |
| Cardinal Health, Inc. ( CAH) | Sep. 85.00 Calls | Raise the option stop loss to 9.30 (CP: 11.30) |
| Shopify Inc ( SHOP) | Sep. 60.00 Calls | Initiate an option stop loss of 6.95 (CP: 8.95) |
| PepsiCo, Inc. ( PEP) | Oct. 180.00 Calls | Initiate a stock price stop of 8.25 (CP: 185.14) |
| Deere & Company ( DE) | Sep. 400.00 Calls | Raise the option stop loss to 22.25 (CP: 24.25) |
| Visa Inc. ( V) | Sep. 225.00 Calls | Initiate an option stop loss of 16.05 (CP: 18.05) |
| The TJX Companies, Inc. ( TJX) | Oct. 80.00 Calls | Initiate an option stop loss of 5.35 (CP: 7.35) |
| Motorola Solutions Inc. ( MSI) | Oct. 290.00 Calls | Initiate an option stop loss of 14.40 (CP: 16.40) |
| Name | Option Symbol | Action | Stop Loss |
|---|---|---|---|
| Snap Inc - $11.84 | O: 23V12.00D20 | Buy the October 12.00 puts at 1.65 | 13.00 |
| Name | Option | Action |
|---|---|---|
| CSX Corporation (CSX) | Aug. 30.00 Puts | Stopped at 34.00 (CP: 34.05) |
| Name | Option Sym. | Call to Sell | Call Price | Investment for 500 Shares | Annual Called Rtn. | Annual Static Rtn. | Downside Protection |
|---|---|---|---|---|---|---|---|
| International Game Technology $31.64 | O: 23J33.00D20 | Oct. 33.00 | 2.05 | $15,089.70 | 27.01% | 18.47% | 5.36% |
| Name | Action |
|---|---|
| CrowdStrike Holdings, Inc. Class A (CRWD) - 143.99 | Sell the October 155.00 Calls. |
| Tapestry Inc. (TPR) - 42.83 | Sell the November 45.00 Calls. |
| EQT Corporation (EQT) - 41.04 | Sell the September 41.00 Calls. |
| Dexcom Inc. (DXCM) - 127.94 | Sell the December 130.00 Calls. |
| Roku, Inc. Class A (ROKU) - 63.00 | Sell the October 65.00 Calls. |
| Nucor Corporation (NUE) - 163.33 | Sell the October 170.00 Calls. |
| Name | Covered Write |
|---|---|
| On Semiconductor Corp. ( ON - 92.08 ) | September 90.00 covered write. |
| EQT Corporation ( EQT - 41.04 ) | December 40.00 covered write. |
| Northern Oil & Gas Inc. ( NOG - 34.10 ) | October 34.00 covered write. |
Daily Equity & Market Analysis
Loading, Please Wait...
