The S&P 500 has risen over 7% for three consecutive quarters and reached an overbought position. However, that alone should not create concern as we enter July.
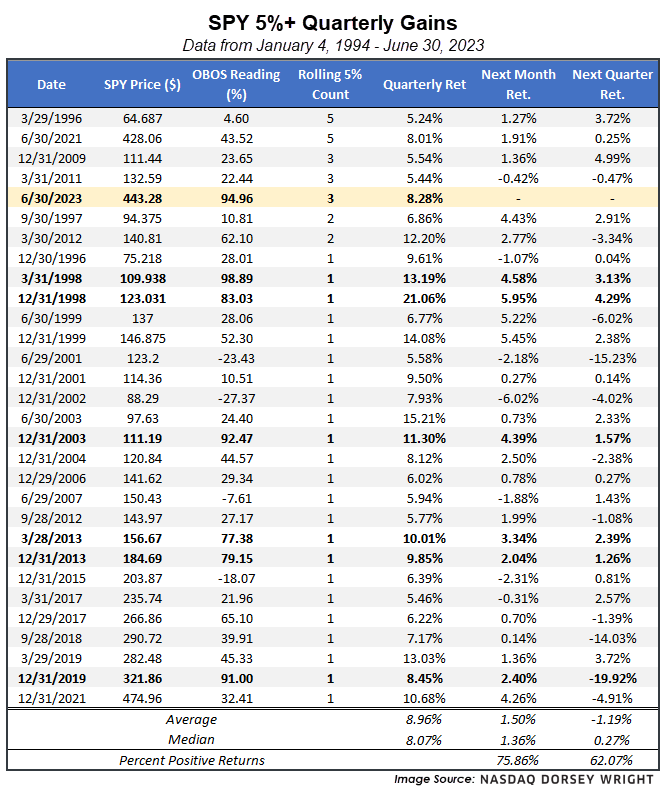
The S&P 500 Index posted a gain of more than 8% during the year's second quarter, marking the third consecutive quarter that it has appreciated at least 7%. This leaves the core market benchmark in rare air, as we have not seen all that many instances of such consistent improvement on a quarter-over-quarter basis. Using the SPDR S&P 500 ETF Trust SPY as a proxy, we have seen the fund rise at least 5% during a calendar quarter on 30 occasions, including the most recent quarter that ended Friday. Somewhat ironically, that equates to roughly 25% of the quarterly periods since the inception of SPY in 1993. Of those 30 instances, only six other periods have seen 5%+ rallies in consecutive quarters, and only four other periods have seen that occur in at least three consecutive quarters. The most consecutive quarterly rallies of at least 5% ended in March 1996 and June 2021, which were tied at 5 consecutive quarters each. As we can see from the table below, SPY has typically posted a positive return in the month following these quarters, at a 75% positive hit rate with an average gain of 1.5%. Keep in mind that these only include the periods where we did not see a 5% rally continue in the next quarter, which is still possible in the third quarter of this year.
Another interesting point can be seen by examining the weekly overbought/oversold (OBOS) level of SPY at the end of each quarter in the table. Only six of the 29 other instances saw SPY in an overbought position, with a weekly OBOS reading north of 70% (periods bolded below). Five of those six instances saw sustained improvement following the quarter end. The lone exception was the pandemic-induced market decline experienced after the end of 2019.
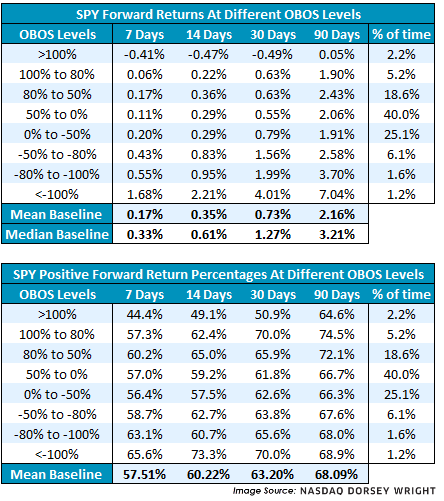
The improvement experienced in the first half of the year has left many broad domestic equity indices in an overbought position as we enter July, but that does not necessarily mean we are in for declines after the Fourth of July holiday. SPY is sitting at an intraday OBOS reading of 97% at the time of this writing Friday, which is the most overbought it has been at the end of a week since August 28, 2020. In fact, only about 7% of the trading days since the inception of the fund have seen it at an overbought reading of 80% or higher. Examining forward returns from different baskets of weekly OBOS readings shows that they do not have as drastic of an effect on further movement as you might expect. The only negative averages over a forward 7, 14, 30, or 90-day timeframe occur when we see OBOS readings north of 100%, which has only happened on 2.2% of the trading days since 1993. Even the overbought readings in the 80% to 100% range still show positive average forward returns, albeit slightly lower than the average forward returns over the same timeframes from any trading day. The percentage of positive forward returns are greater than 50% in each of the timeframes examined in each OBOS basket, except for the forward one- and two-week numbers when SPY is greater than 100% overbought. These examples are not meant to discredit the OBOS reading as an indicator, as we still see lower-than-average forward returns after elevated weekly OBOS readings. We also see higher-than-average forward returns when the OBOS level is in a washed-out position. Rather, this data reinforces that the OBOS reading is most helpful to monitor for mean reversion potential, not an indication of the potential for technical weakness from extended positions.