The Dow failed to breakout of its long-term trading range last week.
Equity benchmarks exhaled last week; the Nasdaq Composite (NASD) and S&P 500 (SPX) each dipped about 1.4% while the Dow Jones (.DJIA) slid 1.7%. The downturn was enough to push each index back into a column of Os on its default Point & Figure chart; however, SPX and NASD pulled back towards the August 2022 old resistance level while the Dow retreated beneath its 2023 highs. Point being - based on our charting methods, the NASD and SPX reversals appear to be healthy while the Dow reversal is notably less constructive. We see the technical discrepancy more clearly via index tracking ETFs like SPY and DIA, which carry fund scores of 4.46 and 2.71, respectively.
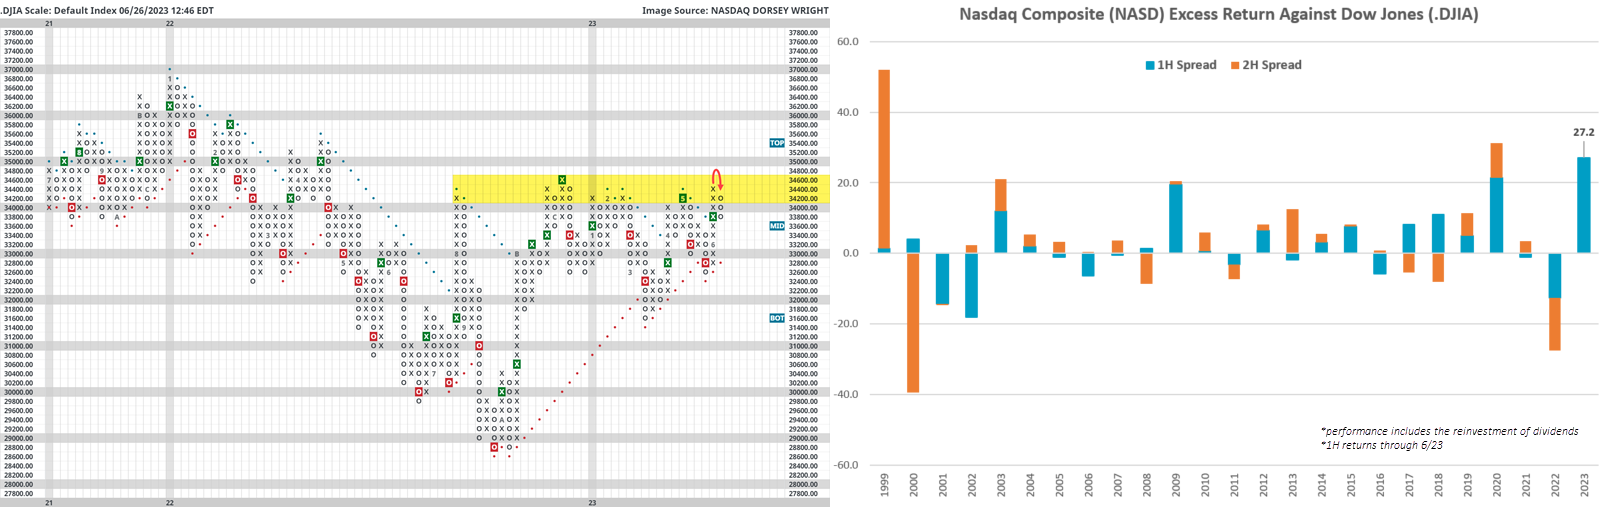
A further point on recent performance - the Dow is currently lagging SPX year-to-date by over 10% and NASD by nearly 30%, which suggests to some that the Dow could qualify for a “catch up” trade should things keep progressing. Although, of the four other instances since 1999 that NASD has outpaced the Dow by 10%+ by this point in the year, NASD continued to outperform the rest of the year 75% of the time. The only year when this was not the case was 2018.
Returning to the Point & Figure chart to close, bulls should look to see the Dow post a higher bottom and break above the 34,400 – 34,600 range in the months ahead and then go on to challenge the early 2022 chart highs.