
July has historically been one of the stronger summer months for the market; however, the major equity benchmarks just had one of their best starts to a year on record and the VIX could be poised to uptick.
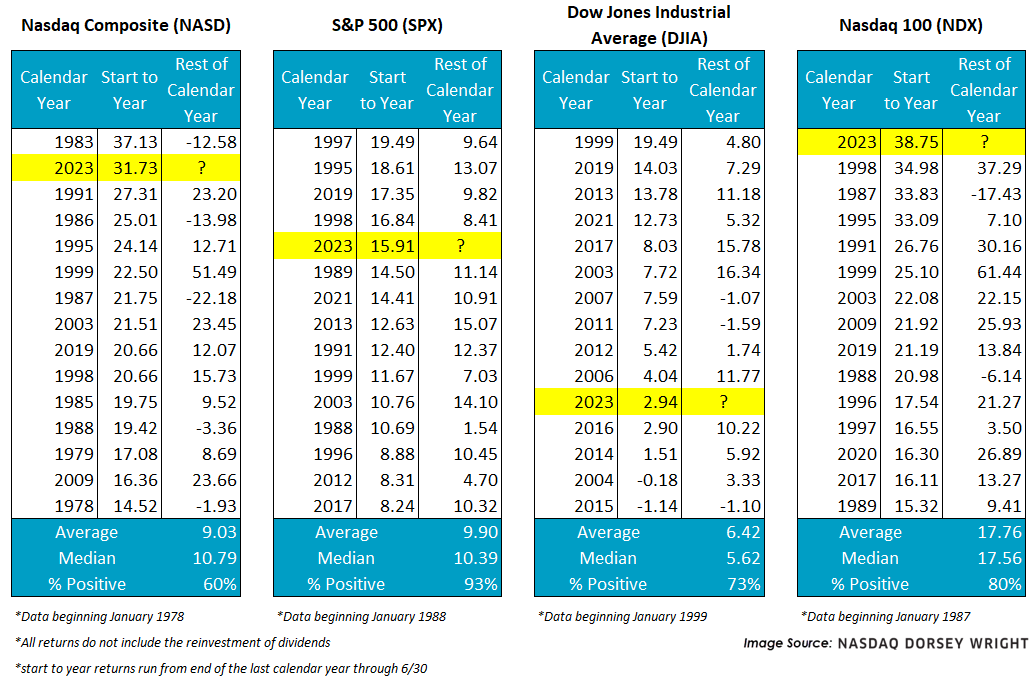
Today (6/30) marks the last trading day for the month of June, which solidified a 15%+ first half (1H) gain for the S&P 500 (SPX) and Nasdaq Composite (NASD). In fact, the S&P 500 had its fifth-best start to a year while the Nasdaq Composite had its second-best start to a year; meanwhile, the Nasdaq 100 (NDX) posted its best start to a year on record with a gain of nearly 40%. In the case of the Dow Jones Industrial Average (.DJIA), the first half of 2023 was just its 11th-best start to a year as it materially trailed the rest of the large-cap pack.
Note that despite the historic advances, these benchmarks still sit comfortably beneath their late 2021 chart highs.
June typically ushers in the summer experiences like beach trips and hours at the pool, along with lackluster performances from stocks…making the return table above even more impressive. Since 1928, June has a median return south of 0.5%, and since 1957 that median return figure drops to just 0.3%. So, what is to say about the month of July with a historically strong 1H in our rearview mirror?
Before delving into conditional July returns, let’s begin with the raw figures. Since 1928, the month of July has been one of the strongest summer months with a median gain of over 1.5% for SPX; furthermore, July has posted a positive return 62% of the time. The second image below reveals that not only has July typically been positive, but the worst experienced return (loss of 7.9%) is the most favorable compared to the other summer months as well as the max return of 9.1%.

Now, what about the hot start to the year? Is there any historical evidence that July returns deviate from their norm if the market is up over 10% in the first six months? In short, not much.
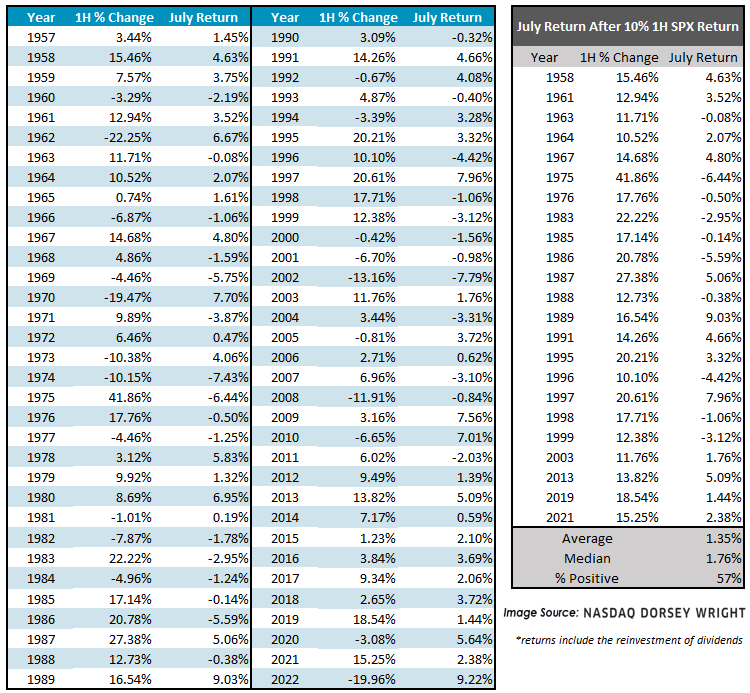
The left-hand table below outlines every 1H percent change for the S&P 500 and the subsequent return for the month of July since 1957. The right-hand table singles out the instances where SPX was up at least 10%. As we can see, the month of July has still posted an average gain of 1.35% and a median return of 1.76% after SPX rallied 10%+ in the first half of the year, which is in line with historical readings (if not a bit better). Additionally, a 57% positive hit rate is about average.
All that said, there is increased potential for quarter-end and semiannual rebalancing headwinds. For instance, with equity returns comfortably outpacing most bond returns so far this year strategic asset allocations are likely outside their target ranges, which could encourage many investors to trim equities and buy bonds to reset their desired exposure.
It is also worth acknowledging that earnings season will (again) soon be upon us in July, which tends to bring some amount of increased volatility to the markets. To this point, the CBOE SPX Volatility Index (VIX) has gradually been trending down and recently reached its lowest level in over three years. However, notice in the line chart below that the 2023 VIX has, at least directionally, been tracking its average annual progression. To calculate the grey line below, we simply averaged the daily VIX reading every day across all years since 1992 (excluding 2023).
If this trend were to hold, we could see the VIX continue lower early in July before rising towards the latter part of the month (which would coincide with earnings and continued rebalancing). Remember that expectations for volatility and equity returns are often inversely correlated, so when the VIX rises SPX typically falls.
This is not intended to taint the historical behavior of July that we have outlined today, after all the VIX often finds a bottom late in the month, but it should serve as a reminder that not all signals point in the same direction. Understanding both the technical tailwinds and headwinds for the market is equally important, that way if (when) things begin to change we can know which direction the breeze might be blowing from.

