Most Requested Symbols

We examine how market capitalization and relative valuations have affected performance of stocks on the Nasdaq 100 over the short-term.
The average distribution reading is -14.76% oversold.
Today's featured stock is Tronox Incorporated (TROX)
OMI, SCHW, SUN, NEU, MLM, MRVL, BLDR, & PLNT.
Call: Ally Financial (ALLY); Put: Salesforce.com (CRM); Covered Write: Continental Resources (CLR)
NDW Morning Update Video - January 12, 2022
NDW Morning Update Video
Click here to download MP3
Monday was a wild one for Technology stocks and the NASDAQ Composite NASD and NASDAQ-100 NDX Indices as both traded more than 2.5% off their Friday closes intraday Monday. As of the time of this writing, both indices have rebounded Tuesday and rallied more than 1%, but that doesn’t quite tell the whole story. Intraday Monday, Technology subsector ETFs like the iShares North American Tech-Software ETF IGV, the First Trust Dow Jones Internet Index Fund FDN, and the SDPR S&P Semiconductors ETF XSD were all down more than 3% at their intraday lows Monday, with XSD being down almost 4%. On a year-to-date basis in 2022, the DWA Group indices for the Internet DWAINET, Semiconductors DWASEMI, and Software DWASOFT sectors are all down more than -6% and are the second, third, and fourth-worst performing DWA Group Indices during the month of January.
But even with the rally Tuesday and both charts moving back into a column of X’s, Monday’s action caused material changes to the long-term 100-point per box charts of NASD and NDX. On the 100-point per box chart of NASD, the index broke a double bottom on Monday at $14800 to return to a sell signal before falling to $14,600 and violating the bullish support line. This trendline break is the first break on the 100-point per box chart since March of 2010! Prior to yesterday’s trendline violation, the only other time the bullish support line was tested was in March of 2020. With Tuesday’s action, NASD reversed back into a column of X’s to $15,100.

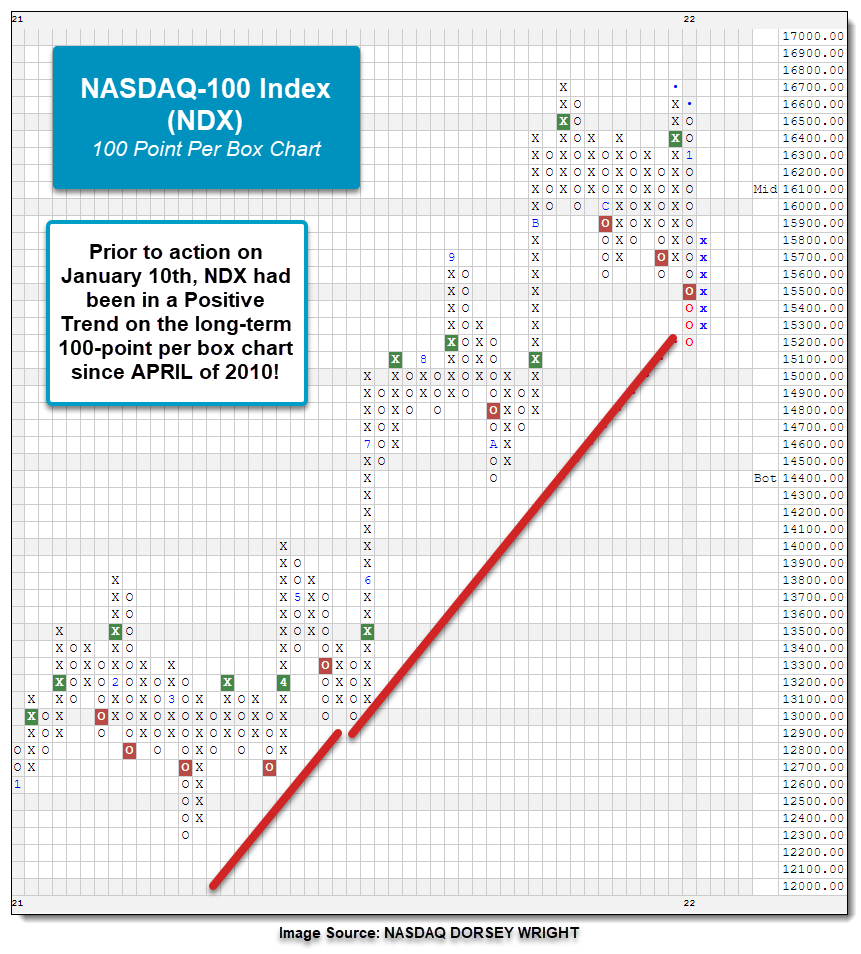
In the case of the long-term 100-point per box chart of NDX, the Index broke a spread triple bottom at $15500 on Monday to return to a sell signal before it fell to $15,200 and violated the bullish support line. The trendline break is the first since April of 2010, a similar timeframe as the NASDAQ Composite. Prior to yesterday’s bullish support line violation, the only other times NDX tested its trendline was in March of 2020 and May of 2021. During Tuesday’s intraday action, NDX reversed back into a column of X’s at $15,800.
In both cases, the trendline violations on the 100-point per box charts of NASD and NDX are extremely notable for the technology-heavy indices and change the trend on the charts for the first time in more than a decade. There is quite the divergence within broader technology and within tech-indices like the NASDAQ Composite and NASDAQ-100, and we’ll look to discuss that within today’s ETF Spotlight.

As we discussed in last Friday’s “Were You Aware?” approximately 40% of the stocks in the Nasdaq Composite (NASD) have pulled back 50% from their 52-week highs. Of course, the index itself has not declined nearly that much – at Monday’s intraday low, around 14,540, NASD was about 10% off of its 52-week high. One of the reasons that the index has held up better than many of its constituents in due do to cap-weighting and that many of the worst performers have been small cap stocks.
However, the performance dispersion hasn’t been just a question of large cap vs. small cap. Even within the Nasdaq-100 (NDX), which is made up entirely of large cap stocks as it is composed of 100 of the largest stocks on the Nasdaq, there has been a bias towards the largest companies. Over the trailing 60 days (through 1/10) the cap-weighted Invesco QQQ Trust (QQQ), which tracks the Nasdaq 100, is down -2.68%, while its equal-weighted counterpart the Direxion Nasdaq-100 Equal Weight ETF (QQQE) is down -8.54%, a difference of nearly 6%.
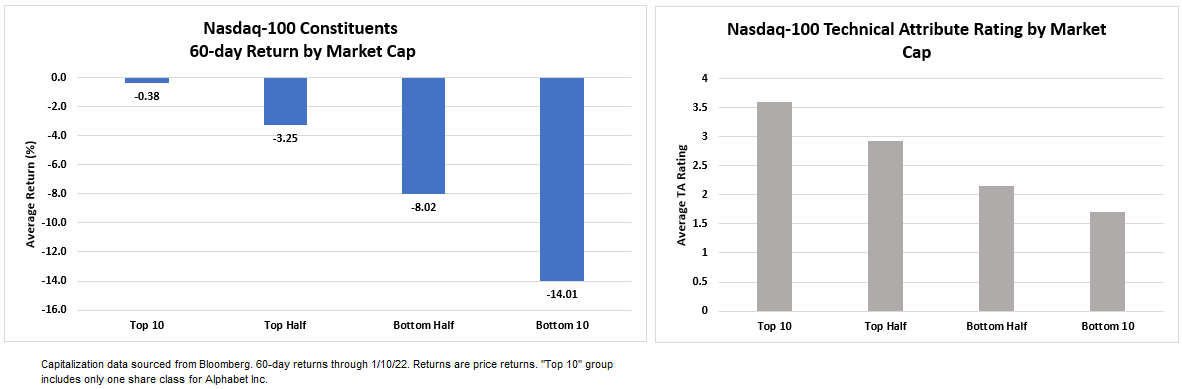
The image below shows the 60-day returns of Nasdaq-100 stocks by market cap. We can see that there is a clear performance bias favoring the largest stocks in the index. The 10 largest stocks are down -0.38% on average over the period while the 10 smallest stocks are down -14%. Meanwhile, the top half of stocks by market cap have outperformed the bottom half by nearly 5%. There is a similar relationship between market cap and technical attribute rating. The 10 largest stocks by market cap have the highest average technical attribute rating, while the smallest 10 have the lowest.
There has been an even more pronounced relationship between recent performance and earnings. Stocks with lower price-to-earnings (PE) ratios have outperformed those with high PE ratios or negative earnings. The chart below groups the stocks in the Nasdaq-100 by PE.
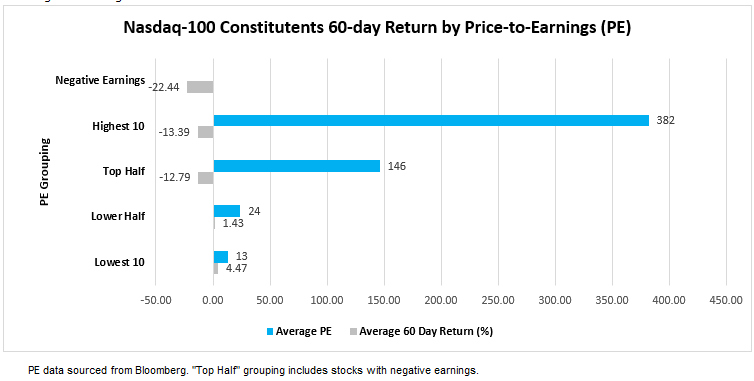
The 10 lowest-PE NDX stocks, which have an average PE ratio of 13, have gained an average of 4.47% over the last two months while the 10 highest-PE stocks, with an average PE ratio of 382, are down more than 13% over the same period.
Stocks with negative earnings, have fared even worse. There are 14 stocks in the Nasdaq-100 that fall into the negative earnings group, including names like Airbnb (ABNB), Peloton (PTON), ZScaler (ZS), and DocuSign (DOCU). The stocks in the negative earnings camp have returned -22.44% on average over the last two months and have an average technical attribute rating of 2.1. The stocks with negative earnings have been included in the “Top Half” group in the chart because PE measures how expensive a firm’s stock is relative to the earnings it generates, and while stocks with negative earnings don’t technically have PE ratios, in terms of earnings, they are more expensive than even the highest PE stocks.
One of the factors that has been cited as contributing to the large declines of Nasdaq stocks, specifically tech stocks, is concerns about rising rates and valuations. There is nothing inherent in tech stocks that should make them especially sensitive to interest rates, however, what many of these stocks have in common is high valuations relative to their earnings, i.e., high PE ratios or negative earnings. In a discounted cash flow valuation, an especially large part of the value of such stocks is often attributable to their terminal value, i.e., the stock’s value beyond a set forecast period, often 5 – 10 years. Terminal value is usually very sensitive to changes in the rate used to discount the cash flows, which is typically based on Treasury yields. So, all else being equal, when interest rates go up, discount rates go up and stock valuations go down, with the effect being especially pronounced in stocks with low current earnings and large terminal values.
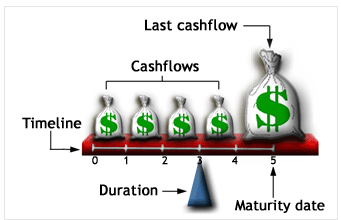
The concept is very similar to duration, which measures a bond’s sensitivity to interest rates. If you have two 10-year bonds, one with a 5% coupon rate and one with a zero coupon (where all interest is paid at maturity), the zero-coupon bond will always have a higher duration, i.e. sensitivity to interest rates - the image below is a good illustration. The fulcrum at the bottom represents duration, if we removed all small cash flows, leaving only one large cash flow at the end, the fulcrum (duration/interest rate sensitivity) would have to increase (move to the right) to maintain balance. It’s essentially the same with stocks, names with high earnings have more/larger cash flows earlier on the timeline, while stocks with high PEs or negative earnings have much or all of their value at the end and.
All of this to say, there is nothing about technology stocks or stocks in the Nasdaq that make them innately more sensitive to rising interest rates. Relative to other sectors, there are a lot of tech stocks with low/zero/negative earnings and much of their value based on expectations for future growth, and as we’ve seen, concerns about valuations have hit these stocks especially hard. Instead of simply reducing exposure to one sector, investors who are concerned that rates may continue to rise and potentially further erode valuations may want to look at their portfolios using relative valuation metrics (like PE) to get an understanding of their exposure from this perspective.
However, we would also caution against simply eliminating high PE and/or negative earnings names without utilizing a technical screen. Some stocks with negative earnings like Palo Alto Networks (PANW) and Marvell Technology Inc (MRVL), have held up quite well and both currently have perfect 5 for 5 TA ratings.
Average Level
-14.76
| AGG | iShares US Core Bond ETF |
| USO | United States Oil Fund |
| DIA | SPDR Dow Jones Industrial Average ETF |
| DVY | iShares Dow Jones Select Dividend Index ETF |
| DX/Y | NYCE U.S.Dollar Index Spot |
| EFA | iShares MSCI EAFE ETF |
| FXE | Invesco CurrencyShares Euro Trust |
| GLD | SPDR Gold Trust |
| GSG | iShares S&P GSCI Commodity-Indexed Trust |
| HYG | iShares iBoxx $ High Yield Corporate Bond ETF |
| ICF | iShares Cohen & Steers Realty ETF |
| IEF | iShares Barclays 7-10 Yr. Tres. Bond ETF |
| LQD | iShares iBoxx $ Investment Grade Corp. Bond ETF |
| IJH | iShares S&P 400 MidCap Index Fund |
| ONEQ | Fidelity Nasdaq Composite Index Track |
| QQQ | Invesco QQQ Trust |
| RSP | Invesco S&P 500 Equal Weight ETF |
| IWM | iShares Russell 2000 Index ETF |
| SHY | iShares Barclays 1-3 Year Tres. Bond ETF |
| IJR | iShares S&P 600 SmallCap Index Fund |
| SPY | SPDR S&P 500 Index ETF Trust |
| TLT | iShares Barclays 20+ Year Treasury Bond ETF |
| GCC | WisdomTree Continuous Commodity Index Fund |
| VOOG | Vanguard S&P 500 Growth ETF |
| VOOV | Vanguard S&P 500 Value ETF |
| EEM | iShares MSCI Emerging Markets ETF |
| XLG | Invesco S&P 500 Top 50 ETF |

| Symbol | Company | Sector | Current Price | Action Price | Target | Stop | Notes |
|---|---|---|---|---|---|---|---|
| AKR | Acadia Realty Trust | Real Estate | $22.04 | 20 - 22 | 28 | 18 | 4 for 5'er, #6 of 154 in REAL sector matrix, one box from RS buy signal, 2.7% yield, Earnings 2/8 |
| STOR | Store Capital Corp. | Real Estate | $33.85 | mid-to-upper 30s | 47.50 | 30 | 5 for 5'er, multiple buy signals, one box from 52-week high, 4.1% yield, R-R>2.0 |
| FOE | Ferro Corp | Chemicals | $21.77 | high teens to low 20s | 35 | 16 | 4 for 5'er, 8 consec buy signals, pullback from recent high, pos trend, top of DWACHEM matrix |
| SC | Santander Consumer USA Holdings Inc. | Finance | $41.73 | high 30s to mid 40s | 57 | 34 | 5 for 5'er, top 10% of DWAFINA, 3 consec buy signals, all-time highs, 2.11% yield, Earnings 2/1 |
| ESI | Element Solutions Inc. | Chemicals | $23.93 | mid to upper 20s | 37 | 20 | 5 for 5'er, multi-year high, 6 consec buy signals, top of DWACHEM |
| BAM | Brookfield Asset Management | Finance | $56.68 | mid to hi 50s | 70 | 47 | 5 for 5'er, top 20% of FINA sector matrix, LT pos mkt RS, multiple consecutive buy signals Earnings 2/10 |
| SMCI | Super Micro Computer, Inc. | Computers | $44.18 | low 40s | 52 | 34 | 4 for 5'er, top 20% of COMP sector matrix, multiple buy signals, pullback from ATH Earnings 1/31 |
| UMC | United Microlectronics Corporation (Taiwan) ADR | Semiconductors | $11.14 | 11.50 - 12.50 | 19 | 10 | 4 for 5'er, top half of favored SEMI sector matrix, bullish catapult, 2.4% yield, R-R>3.0, pot. cov. write |
| SMPL | Simply Good Foods Co | Retailing | $37.67 | mid-to-upper $30s | 56 | 31 | 4 for 5'er top half of RETA sector matrix, bullish catapult, pullback from ATH |
| BRO | Brown & Brown, Inc. | Insurance | $68.08 | low to upper 60s | 77 | 55 | 5 for 5'er, pos trend since 2010, longterm market RS buy signal, one box from 4th consec buy signal Earnings 1/24 |
| SEE | Sealed Air Corporation | Business Products | $65.42 | low-to-mid 60s | 89 | 53 | 5 for 5'er, top 20% of BUSI sector matrix, multiple consec buy signals Earnings 2/7 |
| SWCH | Switch, Inc. Class A | Internet | $27.06 | 25 - 28 | 54.50 | 22 | 4 for 5'er #6 of 51 in INET sector matrix, spread triple top, R-R>5.0 |
| HD | Home Depot, Inc. | Building | $387.46 | high 380s to 410s | 540 | 316 | 5 for 5'er, long-term market RS buy, 3 consec buy signals, pullback from all-time high, 3 mon pos monthly mom, 1.69% yield |
| IR | Ingersoll-Rand Inc. | Machinery and Tools | $58.99 | mid 50s to low 60s | 74 | 49 | 5 for 5'er, pullback from ATH, 3 consecutive buy signals, pos monthly momentum |
| WTFC | Wintrust Financial Corporation | Banks | $100.46 | 90S | 112 | 79 | 4 for 5'er, top 20% of favored BANK sector matrix, triple top, 1.35% yield Earnings 1/19 |
| LYV | Live Nation Entertainment Inc. | Leisure | $115.32 | low 120s to mid 130s | 142 | 98 | 5 for 5'er, pullback from ATH, long-term market RS buy signal, 2 consecutive buy signals, pos month and weekly momentum |
| EQH | Equitable Holdings Inc | Insurance | $35.17 | mid to upper 30s | 47.5 | 27 | 4 for 5'er, pullback from ATH, 3 consec buy signals, pos weekly momentum flip, 2.2% yield |
| STE | STERIS PLC | Healthcare | $231.52 | hi 220s - low 240s | 316 | 200 | 4 for 5'er, top 25% of HEAL sector matrix, LT pos mkt RS, triple top breakout, Earn. 1/31 |
| LAMR | Lamar Advertising Company | Media | $114.32 | low 100s - low 120s | 158 | 97 | 5 for 5'er, top 25% of MEDI sector matrix, pullback from ATH, 3.4% yield. |
| TROX | Tronox Incorporated | Chemicals | $23.89 | mid 20s | 43.50 | 20 | 5 for 5'er, top 1/3 DWACHEM matrix, 3 weeks pos weekly mom, pullback from rally high, 1.65% yield |
| Symbol | Company | Sector | Current Price | Action Price | Target | Stop | Notes |
|---|
| Symbol | Company | Sector | Current Price | Action Price | Target | Stop | Notes |
|---|---|---|---|---|---|---|---|
| OFG | Oriental Financial Group | Banks | $29.57 | mid-to-high 20s | 37 | 23 | See follow comment below. |
| Comment |
|---|
| OFG Oriental Financial Group R ($29.44) - Banks - OFG has moved outside of our actionable range. We will maintain our $23 stop. |
TROX Tronox Incorporated R ($23.99) - Chemicals - TROX is a perfect 5 for 5’er that ranks in the top third of the chemicals sector stock matrix. TROX has been trading in a positive trend since August 2020 and has maintained a market RS buy signal since December 2020. Weekly momentum has been positive for three weeks, adding to the positive weight of the evidence. Okay to add new exposure in the mid 20s. We will set our initial stop at $20, the first sell signal on the chart, and will use TROX’s bullish price objective of $43.50 as our near-term price target. TROX yields 1.65%.
| 19 | 20 | 21 | 22 | ||||||||||||||||||||||||||||||||||||||||||||||||||
| 26.00 | A | 26.00 | |||||||||||||||||||||||||||||||||||||||||||||||||||
| 25.00 | X | O | 1 | 25.00 | |||||||||||||||||||||||||||||||||||||||||||||||||
| 24.00 | X | X | O | X | 24.00 | ||||||||||||||||||||||||||||||||||||||||||||||||
| 23.00 | 5 | O | 9 | O | X | Mid | 23.00 | ||||||||||||||||||||||||||||||||||||||||||||||
| 22.00 | • | X | O | X | B | X | 22.00 | ||||||||||||||||||||||||||||||||||||||||||||||
| 21.00 | 7 | • | X | X | 6 | X | C | 21.00 | |||||||||||||||||||||||||||||||||||||||||||||
| 20.00 | X | O | • | X | O | X | X | 7 | X | 20.00 | |||||||||||||||||||||||||||||||||||||||||||
| 19.50 | X | O | • | X | O | 3 | X | X | O | X | O | X | X | 19.50 | |||||||||||||||||||||||||||||||||||||||
| 19.00 | 6 | O | • | X | O | X | O | X | O | 4 | O | X | O | X | O | X | 19.00 | ||||||||||||||||||||||||||||||||||||
| 18.50 | X | O | • | X | O | X | O | X | O | X | O | O | X | O | X | Bot | 18.50 | ||||||||||||||||||||||||||||||||||||
| 18.00 | X | O | • | X | O | O | X | O | X | O | X | 8 | X | 18.00 | |||||||||||||||||||||||||||||||||||||||
| 17.50 | X | 8 | • | X | O | O | X | O | O | 17.50 | |||||||||||||||||||||||||||||||||||||||||||
| 17.00 | • | O | • | X | 2 | O | X | 17.00 | |||||||||||||||||||||||||||||||||||||||||||||
| 16.50 | O | X | • | X | O | X | O | X | 16.50 | ||||||||||||||||||||||||||||||||||||||||||||
| 16.00 | O | X | O | • | X | X | O | X | O | • | 16.00 | ||||||||||||||||||||||||||||||||||||||||||
| 15.50 | O | X | O | X | • | 1 | O | X | O | • | 15.50 | ||||||||||||||||||||||||||||||||||||||||||
| 15.00 | O | X | 9 | X | O | • | X | O | X | • | 15.00 | ||||||||||||||||||||||||||||||||||||||||||
| 14.50 | O | X | O | X | O | • | X | X | O | • | 14.50 | ||||||||||||||||||||||||||||||||||||||||||
| 14.00 | O | X | O | 4 | 5 | • | X | O | X | • | 14.00 | ||||||||||||||||||||||||||||||||||||||||||
| 13.50 | O | O | X | X | O | • | C | O | X | • | 13.50 | ||||||||||||||||||||||||||||||||||||||||||
| 13.00 | O | X | O | X | O | 7 | • | X | X | O | • | 13.00 | |||||||||||||||||||||||||||||||||||||||||
| 12.50 | O | X | B | O | 3 | O | X | O | • | X | O | X | • | 12.50 | |||||||||||||||||||||||||||||||||||||||
| 12.00 | O | X | O | X | O | X | O | X | O | 1 | • | X | O | X | • | 12.00 | |||||||||||||||||||||||||||||||||||||
| 11.50 | A | X | O | X | O | X | X | O | X | O | X | O | • | X | O | X | • | 11.50 | |||||||||||||||||||||||||||||||||||
| 11.00 | O | O | O | X | O | X | O | 6 | O | X | O | • | X | O | • | 11.00 | |||||||||||||||||||||||||||||||||||||
| 10.50 | O | X | O | X | O | X | 8 | X | O | • | X | • | 10.50 | ||||||||||||||||||||||||||||||||||||||||
| 10.00 | O | O | 2 | O | X | O | X | X | O | X | • | B | • | 10.00 | |||||||||||||||||||||||||||||||||||||||
| 9.50 | C | X | O | O | X | O | X | O | X | O | • | • | X | A | • | 9.50 | |||||||||||||||||||||||||||||||||||||
| 9.00 | O | X | O | X | O | B | O | X | O | X | • | X | O | X | • | 9.00 | |||||||||||||||||||||||||||||||||||||
| 8.50 | O | 1 | O | 9 | O | X | O | X | O | X | O | 8 | O | X | • | 8.50 | |||||||||||||||||||||||||||||||||||||
| 8.00 | O | X | O | X | O | X | 2 | O | X | O | 7 | 9 | • | 8.00 | |||||||||||||||||||||||||||||||||||||||
| 7.50 | O | X | O | X | A | O | 6 | O | X | • | 7.50 | ||||||||||||||||||||||||||||||||||||||||||
| 7.00 | O | X | O | O | X | O | X | • | 7.00 | ||||||||||||||||||||||||||||||||||||||||||||
| 6.50 | O | 3 | X | O | • | 6.50 | |||||||||||||||||||||||||||||||||||||||||||||||
| 6.00 | O | X | X | X | • | 6.00 | |||||||||||||||||||||||||||||||||||||||||||||||
| 5.50 | O | X | O | X | O | X | • | 5.50 | |||||||||||||||||||||||||||||||||||||||||||||
| 5.00 | O | X | O | X | O | X | • | 5.00 | |||||||||||||||||||||||||||||||||||||||||||||
| 4.75 | O | X | O | X | 4 | X | • | 4.75 | |||||||||||||||||||||||||||||||||||||||||||||
| 4.50 | O | O | O | X | • | 4.50 | |||||||||||||||||||||||||||||||||||||||||||||||
| 4.25 | O | X | • | 4.25 | |||||||||||||||||||||||||||||||||||||||||||||||||
| 4.00 | O | • | 4.00 | ||||||||||||||||||||||||||||||||||||||||||||||||||
| 19 | 20 | 21 | 22 |
| BLDR Builders FirstSource, Inc. ($80.22) - Building - Shares of BLDR reversed up into Xs on Tuesday, initiating the action point on a shakeout pattern. The stock remains a 5 for 5'er and is well-ranked in the favored building stock sector matrix. Demand is in control and the stock is actionable at current levels. Should BLDR fail the shakeout pattern, the next level of support is at around $73. |
| MLM Martin Marietta Materials In ($418.76) - Building - MLM gave an initial sell signal on Tuesday when it broke a double bottom at $408. The long-term picture for MLM remains positive as it is a 3 for 5'er that ranks in the top third of the favored building sector matrix. MLM now sits against support at $308. Earnings are expected on 2/7. |
| MRVL Marvell Technology Inc. ($86.03) - Semiconductors - MRVL rose over 4% Tuesday to break a double top at $86. This 5 for 5'er moved to a positive trend in May and ranks 4th out of 61 names in the semiconductors sector RS matrix. The weight of the technical evidence is positive and improving. Initial support is now offered at $78 with further support seen at $70. Overhead resistance may be seen at $91 and $93. |
| NEU NewMarket Corporation ($356.70) - Chemicals - NEU returned a buy signal and positive trend when it broke a triple top at $356 on Tuesday. The weight of the evidence remains negative, however, as even with the positive trend change NEU is an unfavorable 1 for 5'er. The nearest level of support now sits at $340. NEU carries a 2.45% yield and is expected to report earnings on 2/2. |
| OMI Owens & Minor Incorporated ($47.36) - Healthcare - OMI shares moved higher today to break a triple top at $47 to return to a buy signal. This 3 for 5'er has been in a positive trend since July of 2020 and in a column of Xs on its RS chart versus the market since November. OMI is actionable at current levels with a weekly overbought/oversold reading of 26%. From here, support is offered at $40. |
| PLNT Planet Fitness Inc ($93.13) - Leisure - PLNT returned to a buy signal today with a double top at $94. PLNT is a 3 for 5’er within the leisure sector that has experienced three weeks of positive weekly momentum. From here, PLNT faces resistance $95 while initial support sits at $87. |
| SCHW The Charles Schwab Corporation ($93.79) - Wall Street - SCHW shares moved higher today to break a double top at $93 to mark its third consecutive buy signal. This 5 for 5'er has been in a positive trend since June of 2020 and on an RS buy signal versus the market since January of 2021. SCHW is heavily overbought at current levels with a weekly overbought/oversold reading of 75%. From here, support is offered at $89. |
| SUN Sunoco L.P. ($43.15) - Oil - SUN broke a double top at $43 for a fourth consecutive buy signal and a multi-year high. The stock is a 3 fro 5'er that ranks in the top half of the Oil sector matrix and is accompanied by a yield north of 7.5%. Okay to consider here on the breakout. Initial support lies at $37 and $35. |

| Name | Option Symbol | Action | Stop Loss |
|---|---|---|---|
| Ally Financial Inc. - $50.68 | ALLY2217F50 | Buy the June 50.00 calls at 4.45 | 44.00 |
| Name | Option | Action |
|---|---|---|
| The Charles Schwab Corporation ( SCHW) | Feb. 82.50 Calls | Raise the option stop loss to 9.70 (CP: 11.70) |
| Morgan Stanley ( MS) | Feb. 97.50 Calls | Raise the option stop loss to 7.15 (CP: 9.15) |
| Name | Option Symbol | Action | Stop Loss |
|---|---|---|---|
| Salesforce.com, Inc. - $235.18 | CRM2220Q240 | Buy the May 240.00 puts at 20.35 | 262.00 |
| Name | Option | Action |
|---|---|---|
| Block Inc (SQ) | Mar. 165.00 Puts | Stopped at 25.95 (CP: 22.45) |
| Crocs, Inc. (CROX) | Jun. 135.00 Puts | Stopped at 22.90 (CP: 22.80) |
| JD.COM INC (JD) | Mar. 70.00 Puts | Stopped at 72.00 (CP: 76.55) |
| Name | Option Sym. | Call to Sell | Call Price | Investment for 500 Shares | Annual Called Rtn. | Annual Static Rtn. | Downside Protection |
|---|---|---|---|---|---|---|---|
| Continental Resources Inc. $48.69 | CLR2217F55 | Jun. 55.00 | 4.90 | $23,536.55 | 36.61% | 21.42% | 8.44% |
| Name | Action |
|---|---|
| EQT Corporation (EQT) - 23.00 | Sell the March 23.00 Calls. |
| Extreme Networks, Inc. (EXTR) - 14.53 | Sell the March 15.00 Calls. |
| Advanced Micro Devices, Inc. (AMD) - 132.00 | Sell the March 145.00 Calls. |
| Xilinx, Inc. (XLNX) - 193.50 | Sell the March 230.00 Calls. |
| SeaWorld Entertainment, Inc. (SEAS) - 66.59 | Sell the March 70.00 Calls. |
| Alcoa Inc. (AA) - 61.54 | Sell the March 65.00 Calls. |
| Macy's Inc. (M) - 25.56 | Sell the May 28.00 Calls. |
| Jabil Circuit, Inc. (JBL) - 69.03 | Sell the June 75.00 Calls. |
| Teck Resources Limited (TECK) - 31.20 | Sell the May 31.00 Calls. |
| Builders FirstSource, Inc. (BLDR) - 79.01 | Sell the May 85.00 Calls. |
| On Semiconductor Corp. (ON) - 65.12 | Sell the February 65.00 Calls. |
| Micron Technology, Inc. (MU) - 93.89 | Sell the May 95.00 Calls. |
| Name | Covered Write |
|---|---|
| Seagate Technology ( STX - 114.42 ) | March 115.00 covered write. |
Daily Equity & Market Analysis
Loading, Please Wait...
