Most Requested Symbols

The average distribution reading is -9.06% oversold.
Today's featured stock is STERIS PLC (STE).
AA, BAC, BURL, EFX, EYE, KR, ROK, RPM, SEAS, SHW, and TXN
Call: Marvell Technology Inc (MRVL); Put: JD.COM (JD); Covered Write: On Semiconductors (ON).
NDW Morning Update Video - January 10, 2022
NDW Morning Update Video
Click here to download MP3
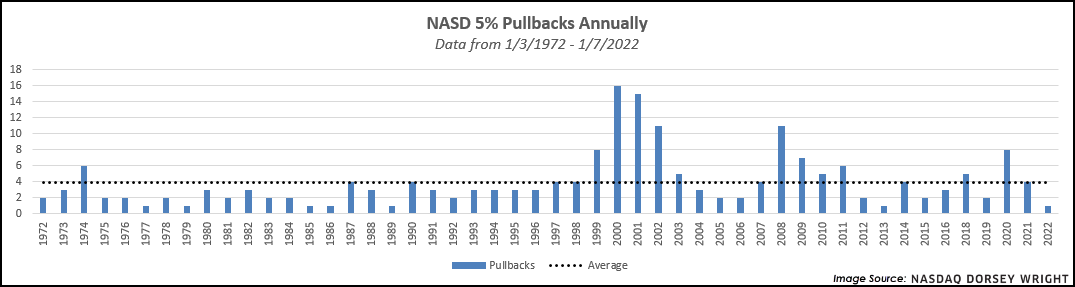
The Nasdaq Composite NASD has had a rocky start to 2022, with the index posting its fourth consecutive daily loss on Friday. In fact, the NASD has seen a decline in eight out of the last ten trading days. With Friday’s decline, the Composite has now pulled back over 5% from its closing value on December 27. There were a total of four 5% pullbacks in the NASD during 2021, which is right at the annual average dating back to 1972. There was only a 37-day gap between the last 5% pullback at the beginning of December and the most recent one, which is much quicker than the 92-day average gap between prior pullbacks. This also marks the swiftest 5% pullback since June 2020 at just eleven calendar days.
The recent decline has been amplified by many of the names underneath the hood of the Nasdaq Composite. Roughly 40% of the 3655 names in the index currently sit more than 50% lower than their 52-week high. While this number may seem alarming at first, we can separate those names into groupings by style as well as technical strength for a better understanding of the recent movement. The vast majority of names in the NASD are weak attribute names, with just 22% of the stocks having a TA rating of 3 or greater. The size and style breakdown shows that 77% of the index is classified in the small-cap space, and those three style boxes are the only of the nine to be at least 40% off their 52-week highs on average.


Broad domestic equity markets had quite an impressive run in 2021, with the S&P 500 Index TR.SPXX posting a total return of 28.71%. This was the third-highest annual return since the year 2000 and the ninth highest gain in any year since 1950. In the final week of Q4, the SPX marked its 70th new all-time high of the year with the close at 4793.06. There have only been two other years that have seen more ATHs, with 73 in 1954 and 77 in 1995. In fact, there have only been 25 years where the S&P 500 has printed at least 25 new ATHs.
When we focus on total returns during the final quarter of 2021, we find that the S&P 500 finished strong with a double-digit gain of 11.03%, while the Nasdaq Composite XCMP and Dow Jones Industrial Average .DINDR finished up 8.45% and 7.87%, respectively. Like what we saw take place in the second and third quarters, small-cap stocks continued to lag their large and mega-cap counterparts. Despite this relative underperformance, iShares S&P SmallCap 600 Index Fund IJR.TR and the iShares Russell 2000 ETF IWM.TR managed to finish the quarter in positive territory with respective gains of 5.56% and 2.00%. While we saw broad US market indexes hit new all-time highs in Q4, momentum-based strategies continued to struggle as they had throughout much of the year with the Dorsey Wright Technical Leaders Index TLLARGE.TR posting a total return of 5.84%, underperforming the S&P 500 Index and iShares Russell 1000 ETF IWB.TR benchmarks by -5.19% and -3.89%, respectively. In the end, elevated volatility and choppy market action caused the TLLARGE.TR Index to significantly underperform both benchmarks on a total return basis in 2021 as trends were more difficult to capture. The Dorsey Wright SmallCap Technical Leaders Index TLR2000.TR finished the fourth quarter in the black with a gain of 3.12%, outperforming the iShares Russell 2000 ETF IWM.TR by 1.12% while underperforming the iShares S&P SmallCap 600 Index Fund IJR.TR by -2.44% in Q4. When all was said and done in 2021, the TL2000.TR Index posted a gain of 20.65%, outpacing the IWM benchmark by over 6% while underperforming the IJR benchmark by -5.93%.
As you've heard us discuss before, every investment strategy, whether it is value investing, growth investing, fundamental, or even trend following, goes through periods of underperformance, and Relative Strength investing (RS) is no different. RS laggard periods can be uncomfortable, and when looking in the rearview mirror (early 2016, late 2018, or 2021), it serves as an unfriendly reminder of this. As you discuss your process with prospects and clients, it's important for them to understand that sometimes RS-based strategies such as the Dorsey Wright Technical Leaders Index and the Dorsey Wright SmallCap Technical Leaders Index, are not immune to periods of underperformance, however, we have found that RS has tended to rebound out of these laggard periods, providing, at times, consistent and robust returns. As a result of shifting strength, we saw 46 changes (out of 100 holdings) in the TLLARGE.TR with this most reconstitution and 89 changes (out of 200 holdings) in TLR2000.TR, repositioning both portfolios toward areas of leadership.

Below you'll find an update to the changes made in both strategies with the most recent index reconstitution. Keep in mind that positions that have been removed no longer maintain characteristics of superior Relative Strength. Meanwhile, additions have improved to a place of leadership and may even be ideas to consider on an individual stock basis.
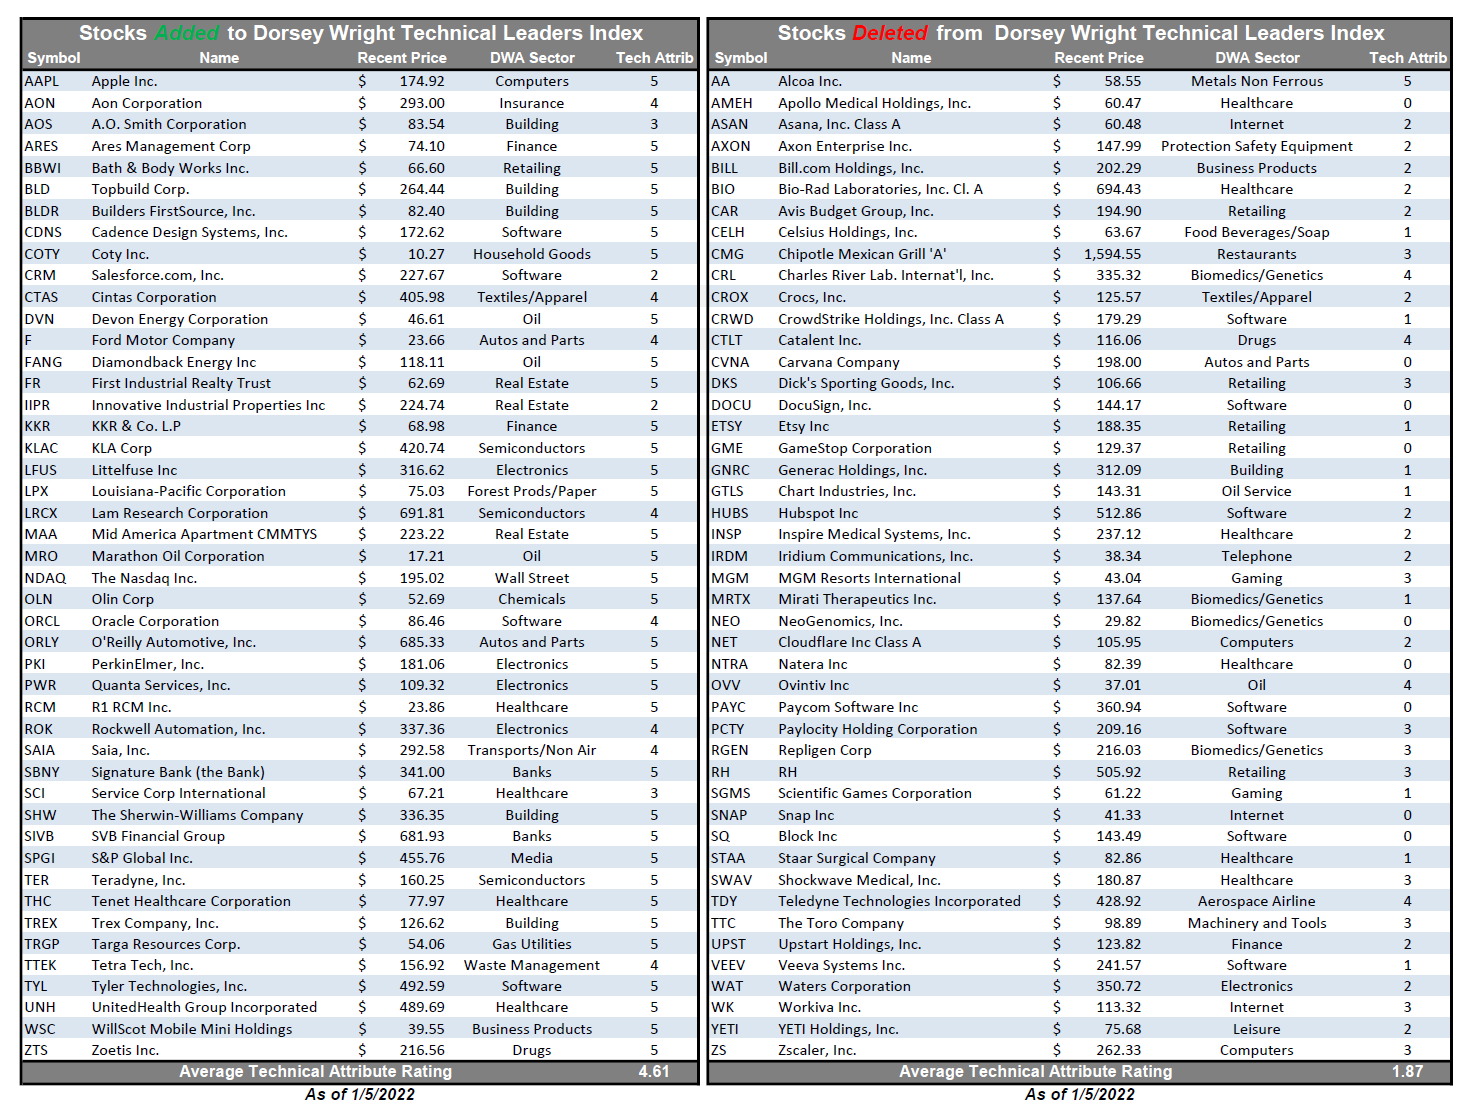
Dorsey Wright Technical Leaders Index Process
The stock-selection process behind the Dorsey Wright Technical Leaders Index strategy is quite simple yet robust. Every quarter, we apply the Relative Strength process to compare approximately 1,000 large and mid-cap US stocks and select the strongest 100 names. The quarterly reconstitution process's primary goal is to consistently weed out the weak names and realign the portfolio toward strength. With this most recent reconstitution and rebalance, we removed 46 stocks and added 46 new stocks, which we've compiled in the tables below. One of the more interesting observations is the "Average Technical Attribute Reading" for the two lists. As of 1/5/2022, the 46 stocks added to the strategy this quarter have an average technical attribute rating of 4.61. The 46 stocks that were removed, however, have a weaker average attribute rating of 1.87.
Dorsey Wright Technical Leaders Index Changes
Dorsey Wright Technical Leaders Index Stats:
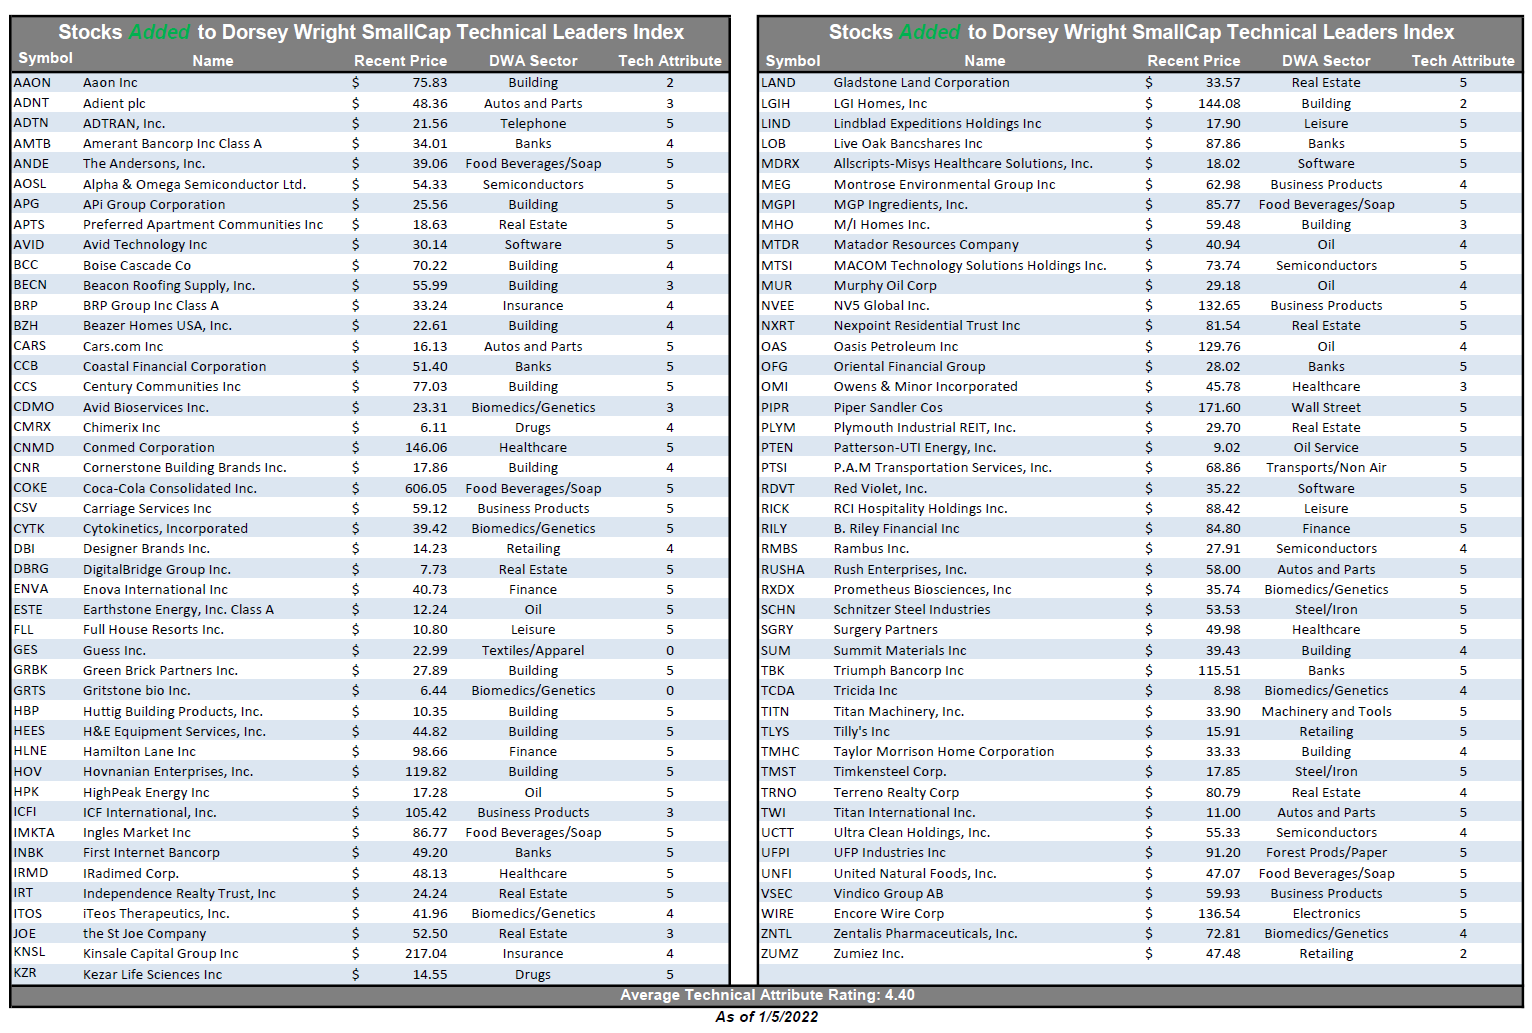
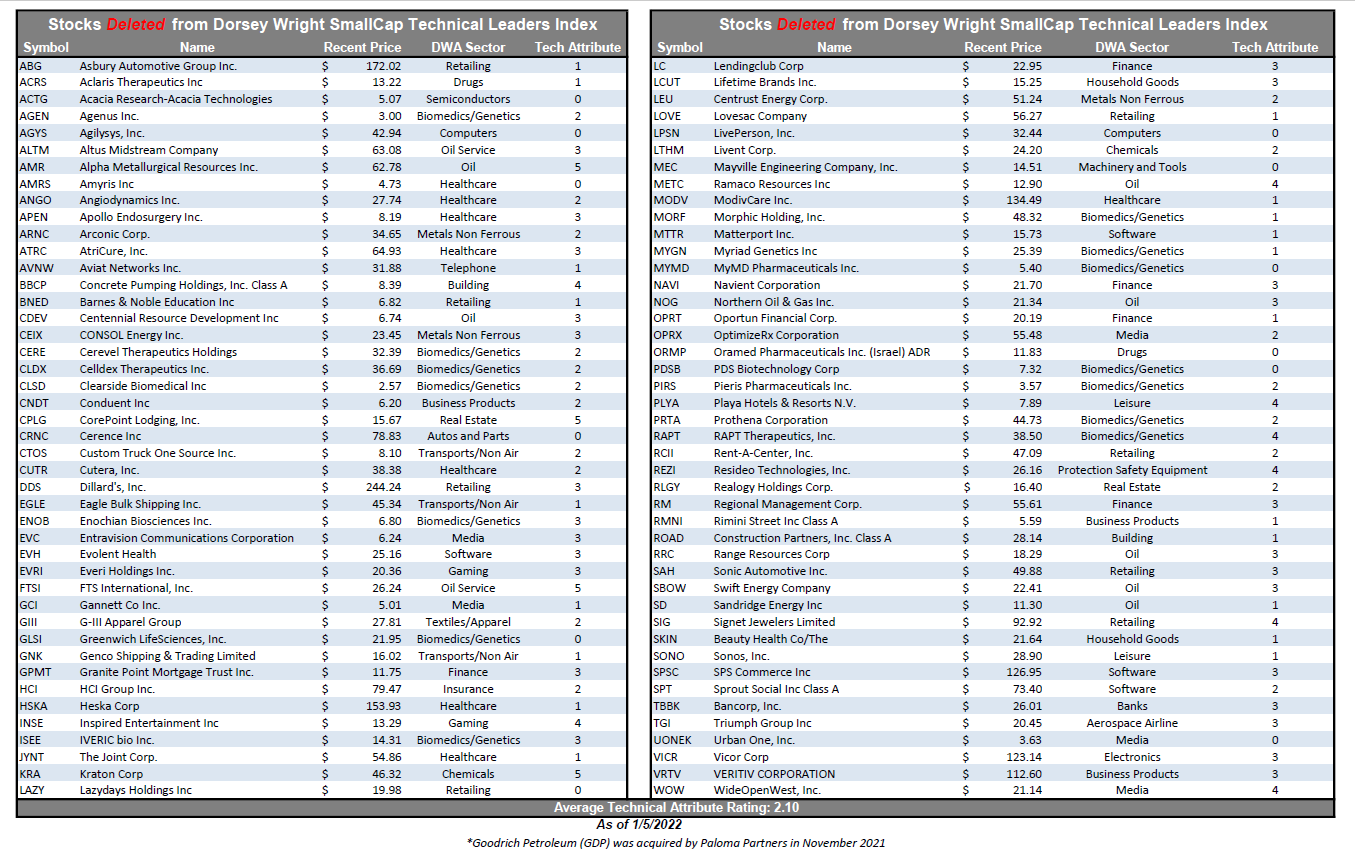
Dorsey Wright SmallCap Technical Leaders Index Process
The stock-selection process behind the Dorsey Wright SmallCap Technical Leaders Index is quite simple, yet robust. Every quarter, we apply the Relative Strength process to compare approximately 2,000 US-listed small-cap stocks and select the strongest 200 names. The quarterly reconstitution process's primary goal is to consistently weed out the relatively weak names and realign the portfolio toward strength. With this most recent reconstitution and rebalance, we removed 89 stocks and added 89 new stocks, which we've compiled in the table below. One of the more interesting observations is the "Average Technical Attribute Reading" for the two lists. As of 1/5/2022, the 89 stocks added to the strategy this quarter have an average technical attribute rating of 4.40. The 89 stocks that were removed, however, have a weaker average attribute rating of 2.10.
Dorsey Wright SmallCap Technical Leaders Index Changes
Dorsey Wright SmallCap Technical Leaders Index Stats:
The start of 2022 has seen a notable surge in strength from value areas of the market as rates and commodity prices have swiftly moved higher. One of the major sectors affected by this has been technology, which was touched on in yesterday’s Fund Score Overview. Energy and financials have been the two sectors that have benefitted the most to start the year. Utilities, consumer staples, and real estate are also areas that have had strong upticks so far this year. This has had a clear effect on the size & styles rankings. The groups with the worst score directions on the US Styles view are mid-cap growth, small-cap growth, micro-caps, and large-cap growth while we see value styles leading the way in terms of average scores. The S&P 500 Index Funds group firmly remains in the leadership role and it should be noted that many of the mega-cap growth stock names are still technically strong from a long-term perspective despite large-cap growth and technology weakening.
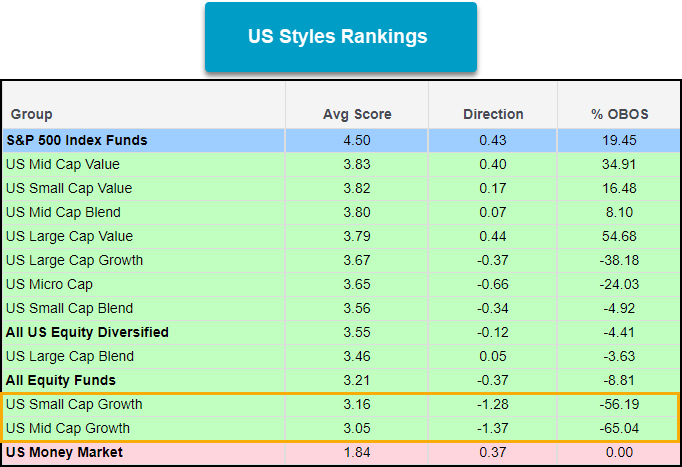
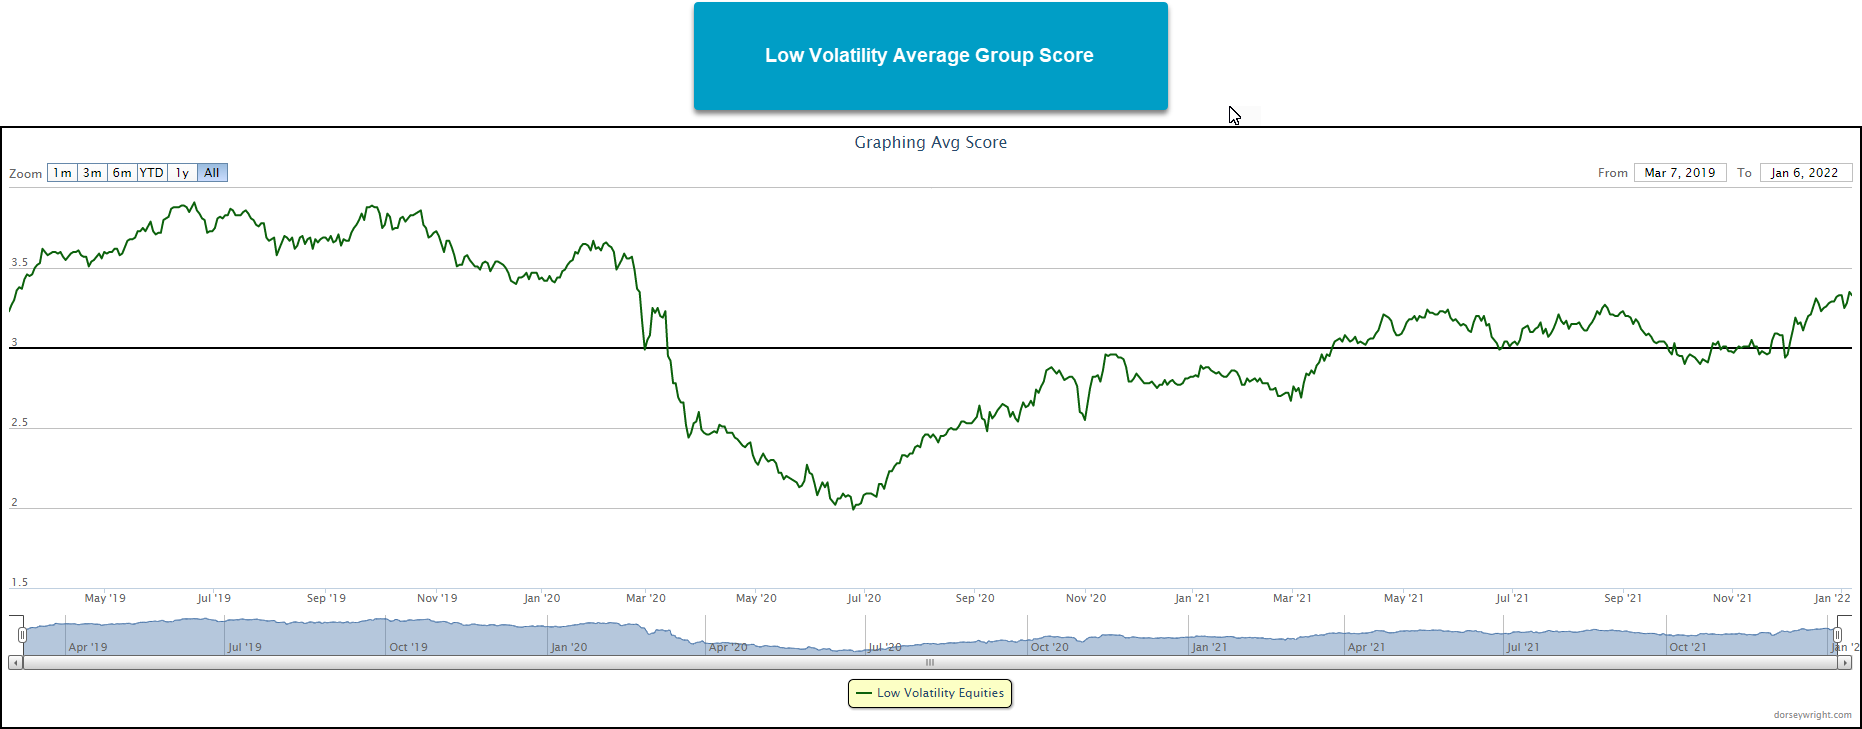
Low volatility equities have perked up after a long stretch of being dormant and the group has quietly moved up the rankings over the past few weeks. The group has an acceptable average score of 3.33 with a positive score direction of 0.45, one of the highest on the Asset Class Group Scores page. The group is at its highest level since February of 2020. One of the main drivers behind the move has been the strength of utilities and staples over the past month which make up roughly 40% of the underlying sector exposure for the Invesco S&P 500 Low Volatility ETF (SPLV). SPLV currently has a fund score of 3.52 along with a positive score direction of 1.02.
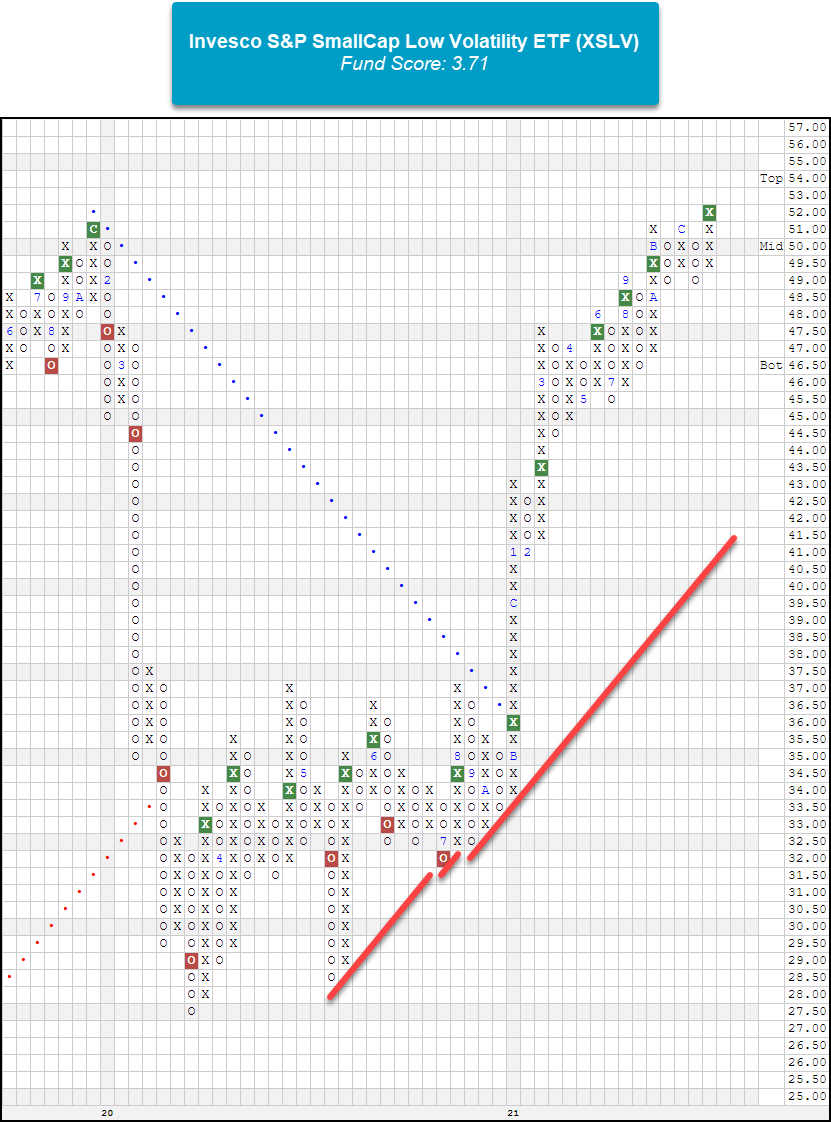
Large caps aren’t the only area to see their low volatility equities do well, small and mid-caps are also participating. The Invesco S&P SmallCap Low Volatility ETF (XSLV) possesses a fund score of 3.71 and a positive score direction of 0.91. Most notably, the fund broke a spread quadruple top to reach a new all-time high and is trading on seven consecutive buy signals. After a long period of relative weakness, the pick-up in strength in the low volatility shouldn’t be ignored especially given the current macroeconomic backdrop that seems to favor higher rates. When low volatility equities have acceptable levels of relative strength they can offer a unique way to add diversification to your clients' portfolios.

Average Level
-9.06
| AGG | iShares US Core Bond ETF |
| USO | United States Oil Fund |
| DIA | SPDR Dow Jones Industrial Average ETF |
| DVY | iShares Dow Jones Select Dividend Index ETF |
| DX/Y | NYCE U.S.Dollar Index Spot |
| EFA | iShares MSCI EAFE ETF |
| FXE | Invesco CurrencyShares Euro Trust |
| GLD | SPDR Gold Trust |
| GSG | iShares S&P GSCI Commodity-Indexed Trust |
| HYG | iShares iBoxx $ High Yield Corporate Bond ETF |
| ICF | iShares Cohen & Steers Realty ETF |
| IEF | iShares Barclays 7-10 Yr. Tres. Bond ETF |
| LQD | iShares iBoxx $ Investment Grade Corp. Bond ETF |
| IJH | iShares S&P 400 MidCap Index Fund |
| ONEQ | Fidelity Nasdaq Composite Index Track |
| QQQ | Invesco QQQ Trust |
| RSP | Invesco S&P 500 Equal Weight ETF |
| IWM | iShares Russell 2000 Index ETF |
| SHY | iShares Barclays 1-3 Year Tres. Bond ETF |
| IJR | iShares S&P 600 SmallCap Index Fund |
| SPY | SPDR S&P 500 Index ETF Trust |
| TLT | iShares Barclays 20+ Year Treasury Bond ETF |
| GCC | WisdomTree Continuous Commodity Index Fund |
| VOOG | Vanguard S&P 500 Growth ETF |
| VOOV | Vanguard S&P 500 Value ETF |
| EEM | iShares MSCI Emerging Markets ETF |
| XLG | Invesco S&P 500 Top 50 ETF |
| Symbol | Company | Sector | Current Price | Action Price | Target | Stop | Notes |
|---|---|---|---|---|---|---|---|
| AKR | Acadia Realty Trust | Real Estate | $22.25 | 20 - 22 | 28 | 18 | 4 for 5'er, #6 of 154 in REAL sector matrix, one box from RS buy signal, 2.7% yield, |
| STOR | Store Capital Corp. | Real Estate | $34.30 | mid-to-upper 30s | 47.50 | 30 | 5 for 5'er, multiple buy signals, one box from 52-week high, 4.1% yield, R-R>2.0 |
| FOE | Ferro Corp | Chemicals | $21.80 | high teens to low 20s | 35 | 16 | 4 for 5'er, 8 consec buy signals, pullback from recent high, pos trend, top of DWACHEM matrix |
| SC | Santander Consumer USA Holdings Inc. | Finance | $42.00 | high 30s to mid 40s | 57 | 34 | 5 for 5'er, top 10% of DWAFINA, 3 consec buy signals, all-time highs, 2.11% yield, |
| ESI | Element Solutions Inc. | Chemicals | $24.15 | mid to upper 20s | 37 | 20 | 5 for 5'er, multi-year high, 6 consec buy signals, top of DWACHEM |
| BAM | Brookfield Asset Management | Finance | $57.55 | mid to hi 50s | 70 | 47 | 5 for 5'er, top 20% of FINA sector matrix, LT pos mkt RS, multiple consecutive buy signals |
| SMCI | Super Micro Computer, Inc. | Computers | $45.10 | low 40s | 52 | 34 | 4 for 5'er, top 20% of COMP sector matrix, multiple buy signals, pullback from ATH Earnings 1/31 |
| UMC | United Microlectronics Corporation (Taiwan) ADR | Semiconductors | $11.51 | 11.50 - 12.50 | 19 | 10 | 4 for 5'er, top half of favored SEMI sector matrix, bullish catapult, 2.4% yield, R-R>3.0, pot. cov. write |
| SMPL | Simply Good Foods Co | Retailing | $38.98 | mid-to-upper $30s | 56 | 31 | 4 for 5'er top half of RETA sector matrix, bullish catapult, pullback from ATH Earnings 1/5 |
| IBKR | Interactive Brokers Group, Inc. | Wall Street | $77.30 | mid 70s to low 80s | 89 | 62 | 4 for 5'er, 5 consec buy signals, monthly momentum to positive Earnings 1/17 |
| UAA | Under Armour, Inc. | Textiles/Apparel | $20.83 | low-to-mid 20s | 41.50 | 19.50 | 4 for 5'er top third of TEXT sector matrix, spread triple top, pullback from ATH, R-R>4.0 |
| BRO | Brown & Brown, Inc. | Insurance | $68.54 | low to upper 60s | 77 | 55 | 5 for 5'er, pos trend since 2010, longterm market RS buy signal, one box from 4th consec buy signal Earnings 1/24 |
| SEE | Sealed Air Corporation | Business Products | $66.64 | low-to-mid 60s | 89 | 53 | 5 for 5'er, top 20% of BUSI sector matrix, multiple consec buy signals |
| SWCH | Switch, Inc. Class A | Internet | $26.70 | 25 - 28 | 54.50 | 22 | 4 for 5'er #6 of 51 in INET sector matrix, spread triple top, R-R>5.0 |
| HD | Home Depot, Inc. | Building | $405.76 | high 380s to 410s | 540 | 316 | 5 for 5'er, long-term market RS buy, 3 consec buy signals, pullback from all-time high, 3 mon pos monthly mom, 1.69% yield |
| IR | Ingersoll-Rand Inc. | Machinery and Tools | $60.30 | mid 50s to low 60s | 74 | 49 | 5 for 5'er, pullback from ATH, 3 consecutive buy signals, pos monthly momentum |
| CUBE | CubeSmart | Real Estate | $54.04 | mid to upper 50s | 68 | 47 | 5 for 5'er, top 10% of DWAREAL, 7 consec buy signals, LT market RS buy signal |
| WTFC | Wintrust Financial Corporation | Banks | $99.89 | 90S | 112 | 79 | 4 for 5'er, top 20% of favored BANK sector matrix, triple top, 1.35% yield Earnings 1/19 |
| LYV | Live Nation Entertainment Inc. | Leisure | $119.34 | low 120s to mid 130s | 142 | 98 | 5 for 5'er, pullback from ATH, long-term market RS buy signal, 2 consecutive buy signals, pos month and weekly momentum |
| EQH | Equitable Holdings Inc | Insurance | $35.12 | mid to upper 30s | 47.5 | 27 | 4 for 5'er, pullback from ATH, 3 consec buy signals, pos weekly momentum flip, 2.2% yield |
| OFG | Oriental Financial Group | Banks | $29.08 | mid-to-high 20s | 37 | 23 | 5 for 5'er, top 20% of favored BANK sector matrix, LT pos mkt RS, multiple consec buy signals, 1.75% yield, Earn 1/19 |
| COST | Costco Wholesale Corporation | Retailing | $549.80 | 530s to 580s | 672 | 432 | 5 for 5'er, 5 consec buy signals, pullback from all-time high, LT market RS buy signal since 2007. |
| STE | STERIS PLC | Healthcare | $238.46 | hi 220s - low 240s | 316 | 200 | 4 for 5'er, top 25% of HEAL sector matrix, LT pos mkt RS, triple top breakout, Earn. 1/31 |
| Symbol | Company | Sector | Current Price | Action Price | Target | Stop | Notes |
|---|
| Comment | |||||||
|---|---|---|---|---|---|---|---|
|
|
|||||||
STE STERIS PLC R ($234.78) - Healthcare - STE is a 4 for 5'er that ranks in the top quartile of the healthcare sector matrix and has been trading on a market RS buy signal since 2018.. Late last month, STE completed a shakeout pattern when it broke a triple top at $240. The stock continue higher, reaching a new all-time high earlier this week, before pulling slightly. Long exposure may be added in the high $220s to low $240s and we will set our initial stop at $200, which would take out two levels of support on STE's default chart. We will use the bullish price objective, $316, as our target price. Earnings are expected on 1/31.
| 21 | 22 | ||||||||||||||||||||||||||||||||||||||||||||||||||||
| 248.00 | 1 | 248.00 | |||||||||||||||||||||||||||||||||||||||||||||||||||
| 244.00 | X | O | 244.00 | ||||||||||||||||||||||||||||||||||||||||||||||||||
| 240.00 | X | O | 240.00 | ||||||||||||||||||||||||||||||||||||||||||||||||||
| 236.00 | X | X | X | O | 236.00 | ||||||||||||||||||||||||||||||||||||||||||||||||
| 232.00 | X | O | X | O | X | 232.00 | |||||||||||||||||||||||||||||||||||||||||||||||
| 228.00 | X | O | X | O | X | Mid | 228.00 | ||||||||||||||||||||||||||||||||||||||||||||||
| 224.00 | X | X | B | O | X | 224.00 | |||||||||||||||||||||||||||||||||||||||||||||||
| 220.00 | 8 | O | X | O | X | 220.00 | |||||||||||||||||||||||||||||||||||||||||||||||
| 216.00 | X | X | O | X | C | 216.00 | |||||||||||||||||||||||||||||||||||||||||||||||
| 212.00 | X | O | 7 | 9 | X | 212.00 | |||||||||||||||||||||||||||||||||||||||||||||||
| 208.00 | X | O | X | O | X | 208.00 | |||||||||||||||||||||||||||||||||||||||||||||||
| 204.00 | • | X | 5 | X | A | 204.00 | |||||||||||||||||||||||||||||||||||||||||||||||
| 200.00 | X | • | X | O | X | Bot | 200.00 | ||||||||||||||||||||||||||||||||||||||||||||||
| 198.00 | X | O | • | X | O | X | 198.00 | ||||||||||||||||||||||||||||||||||||||||||||||
| 196.00 | X | X | O | • | • | X | O | 6 | 196.00 | ||||||||||||||||||||||||||||||||||||||||||||
| 194.00 | X | X | O | X | O | X | X | • | • | X | X | O | X | • | 194.00 | ||||||||||||||||||||||||||||||||||||||
| 192.00 | X | X | O | X | O | X | O | X | O | X | O | X | • | • | X | O | X | O | X | • | 192.00 | ||||||||||||||||||||||||||||||||
| 190.00 | X | O | X | O | X | O | 1 | O | X | O | X | O | X | O | X | • | X | O | X | O | • | 190.00 | |||||||||||||||||||||||||||||||
| 188.00 | X | O | X | O | X | C | X | O | X | O | O | X | O | X | O | • | X | 4 | • | 188.00 | |||||||||||||||||||||||||||||||||
| 186.00 | X | O | X | X | O | O | X | O | X | O | X | O | X | O | • | X | • | 186.00 | |||||||||||||||||||||||||||||||||||
| 184.00 | X | O | X | O | X | O | X | O | X | 2 | • | O | X | O | X | • | 184.00 | ||||||||||||||||||||||||||||||||||||
| 182.00 | X | O | X | O | X | O | X | O | • | • | O | X | O | X | • | 182.00 | |||||||||||||||||||||||||||||||||||||
| 180.00 | X | O | B | O | X | O | • | O | X | O | X | • | 180.00 | ||||||||||||||||||||||||||||||||||||||||
| 178.00 | A | X | O | X | O | • | O | O | 3 | X | • | 178.00 | |||||||||||||||||||||||||||||||||||||||||
| 176.00 | X | X | O | X | O | X | • | O | X | O | X | • | 176.00 | ||||||||||||||||||||||||||||||||||||||||
| 174.00 | X | O | X | O | X | O | • | O | X | O | X | • | 174.00 | ||||||||||||||||||||||||||||||||||||||||
| 172.00 | X | O | X | O | • | O | O | • | 172.00 | ||||||||||||||||||||||||||||||||||||||||||||
| 170.00 | X | O | X | • | • | 170.00 | |||||||||||||||||||||||||||||||||||||||||||||||
| 168.00 | X | O | X | • | 168.00 | ||||||||||||||||||||||||||||||||||||||||||||||||
| 166.00 | X | X | O | • | 166.00 | ||||||||||||||||||||||||||||||||||||||||||||||||
| 164.00 | X | O | 8 | X | X | • | 164.00 | ||||||||||||||||||||||||||||||||||||||||||||||
| 162.00 | X | O | X | O | 9 | O | X | • | 162.00 | ||||||||||||||||||||||||||||||||||||||||||||
| 160.00 | X | 6 | X | O | X | X | O | X | • | 160.00 | |||||||||||||||||||||||||||||||||||||||||||
| 158.00 | O | X | O | X | O | X | O | X | O | X | • | 158.00 | |||||||||||||||||||||||||||||||||||||||||
| 156.00 | O | X | O | X | 7 | X | O | X | O | X | O | • | 156.00 | ||||||||||||||||||||||||||||||||||||||||
| 154.00 | O | X | O | X | O | X | O | X | O | O | X | • | 154.00 | ||||||||||||||||||||||||||||||||||||||||
| 152.00 | O | X | X | O | X | O | X | O | X | O | • | 152.00 | |||||||||||||||||||||||||||||||||||||||||
| 150.00 | O | X | O | X | O | O | X | O | X | • | 150.00 | ||||||||||||||||||||||||||||||||||||||||||
| 148.00 | O | X | O | X | O | O | • | 148.00 | |||||||||||||||||||||||||||||||||||||||||||||
| 146.00 | O | X | O | • | 146.00 | ||||||||||||||||||||||||||||||||||||||||||||||||
| 144.00 | O | X | • | 144.00 | |||||||||||||||||||||||||||||||||||||||||||||||||
| 142.00 | O | X | • | 142.00 | |||||||||||||||||||||||||||||||||||||||||||||||||
| 140.00 | 5 | • | 140.00 | ||||||||||||||||||||||||||||||||||||||||||||||||||
| 21 | 22 |

| AA Alcoa Inc. ($62.07) - Metals Non Ferrous - AA broke a double top at $62 for a third consecutive buy signal. The stock is a 5 for 5'er that ranks 2nd (out of 17) in the Metals Non Ferrous sector matrix. Okay to consider here on the breakout. Initial support lies at $58 with further support at $51. |
| BAC Bank of America ($49.14) - Banks - BAC shares moved higher today to break a double top at $49 to mark its fifth consecutive buy signal. This 5 for 5'er has been in a positive trend since June of 2020 and on an RS buy signal versus the market since March of 2012. BAC is actionable at current levels with a weekly overbought/oversold reading of 45%. From here, support is offered at $43. |
| BURL Burlington Stores, Inc. ($254.93) - Retailing - BURL broke a double bottom at 260 on Friday before falling lower to 252. This marks the stock’s second consecutive sell signal BURL is a weak 2 for 5’er within the unfavored retailing team that has been trading in a negative trend since late August. Avoid. |
| EFX Equifax Inc. ($267.15) - Business Products - Shares of EFX broke a double bottom at $268 on Friday, resulting in a second consecutive sell signal. The stock remains a 5 for 5'er yet the near-term picture is weakening. Investors may look toward the next level of support, currently offered at around $244. |
| EYE National Vision Holdings, Inc. ($43.30) - Retailing - EYE is an unacceptable 0 for 5’er within the retailing sector as it does not have any positive trending or relative strength metrics in its favor at this time. EYE broke a double bottom with today’s intraday action at $44, marking the second consecutive sell signal on the chart. Supply is in control. Avoid. From here, EYE has additional support at $42. |
| KR The Kroger Co. ($48.12) - Retailing - KR broke a triple top at $48 for a fourth consecutive buy signal and a new all-time high. The stock is a 4 for 5'er that ranks 17 (out of 92) in the Retailing sector matrix and is accompanied by a yield of roughly 1.8%. Okay to consider here on the breakout. Initial support lies at $44 with additional support at $39. |
| ROK Rockwell Automation, Inc. ($329.00) - Electronics - Shares of ROK broke a spread triple bottom at $328 on Friday, resulting in a second consecutive sell signal. ROK maintains a favorable 4 for 5 attribute rating and placement in the electronics stock sector matrix, but the near-term picture is weakening. ROK currently rests at support from November of 2021, but a break lower could signal trouble as the next support is distant, at around $292. |
| RPM RPM, Inc. ($92.41) - Chemicals - RPM gave an initial sell signal on Friday when it broke a double bottom at $93. The overall picture for RPM remains positive as it is a 3 for 5'er and ranks in the to half of the chemicals sector matrix. From here the next level of support sits at $91, while overhead resistance can be found at $100. |
| SEAS SeaWorld Entertainment, Inc. ($68.68) - Leisure - SEAS broke a triple top today at $69, marking the stock’s third consecutive buy signal. SEAS is a strong 5 for 5’er that ranks near the top of the leisure sector stock matrix. Weekly momentum just flipped positive while monthly momentum has been positive for two months. From here, SEAS faces resistance at $70, the stock’s all-time high printed in late November while support sits at $65. |
| SHW The Sherwin-Williams Company ($323.49) - Building - SHW gave an initial sell signal on Friday when it broke a double bottom at $328. The weight of the evidence for SHW remains decidedly positive as this the first sell signal in strong uptrend and the stock is a 5 for 5'er that ranks in the top third of the favored building sector matrix. It also worth noting that SHW has been on a market RS buy signal since 2001. From here, the next level of support sits at $324. |
| TXN Texas Instruments Incorporated ($179.99) - Semiconductors - TXN moved lower Friday to break a spread triple bottom at $182 before falling past further support to $180 intraday. This 2 for 5'er moved to a negative trend last month and ranks in the lower quintile of the semiconductors sector RS matrix. The weight of the technical evidence is negative here. Long exposure should be avoided. Further support may be found at $176, while the potential for overhead resistance is seen at $192. |
| Name | Option Symbol | Action | Stop Loss |
|---|---|---|---|
| Marvell Technology Inc. - $83.63 | O: 22E82.50D20 | Buy the May 82.50 calls at 8.85 | 80.00 |
| Name | Option | Action |
|---|---|---|
| The Charles Schwab Corporation ( SCHW) | Feb. 82.50 Calls | Initiate an option stop loss of 8.60 (CP: 10.60) |
| Bank of America ( BAC) | Mar. 44.00 Calls | Raise the option stop loss to 3.90 (CP: 5.90) |
| United Parcel Service, Inc. ( UPS) | Mar. 210.00 Calls | Raise the option stop loss to 12.40 (CP: 14.40) |
| Name | Option Symbol | Action | Stop Loss |
|---|---|---|---|
| JD.COM INC - $68.30 | O: 22O70.00D18 | Buy the March 70.00 puts at 7.20 | 72.00 |
| Name | Option | Action |
|---|---|---|
| Analog Devices, Inc. (ADI) | Mar. 180.00 Puts | Initiate an option stop loss of 0.00 (CP: 14.80) |
| Block Inc (SQ) | Mar. 165.00 Puts | Raise the option stop loss to 25.95 (CP: 27.95) |
| Crocs, Inc. (CROX) | Jun. 135.00 Puts | Initiate an option stop loss of 21.60 (CP: 23.60) |
| Name | Option Sym. | Call to Sell | Call Price | Investment for 500 Shares | Annual Called Rtn. | Annual Static Rtn. | Downside Protection |
|---|---|---|---|---|---|---|---|
| On Semiconductor Corp. $67.25 | O: 22B65.00D18 | Feb. 65.00 | 4.20 | $30,589.45 | 45.09% | 49.88% | 5.43% |
| Name | Action |
|---|---|
| EQT Corporation (EQT) - 21.78 | Sell the March 23.00 Calls. |
| Extreme Networks, Inc. (EXTR) - 15.11 | Sell the March 15.00 Calls. |
| Advanced Micro Devices, Inc. (AMD) - 136.23 | Sell the March 145.00 Calls. |
| Xilinx, Inc. (XLNX) - 204.04 | Sell the March 230.00 Calls. |
| SeaWorld Entertainment, Inc. (SEAS) - 67.66 | Sell the March 70.00 Calls. |
| Alcoa Inc. (AA) - 58.45 | Sell the March 65.00 Calls. |
| Macy's Inc. (M) - 26.74 | Sell the May 28.00 Calls. |
| Seagate Technology (STX) - 112.38 | Sell the March 115.00 Calls. |
| Jabil Circuit, Inc. (JBL) - 70.17 | Sell the June 75.00 Calls. |
| Teck Resources Limited (TECK) - 29.10 | Sell the May 31.00 Calls. |
| Builders FirstSource, Inc. (BLDR) - 82.46 | Sell the May 85.00 Calls. |
| Name | Covered Write |
|---|---|
| Arista Networks Inc ( ANET - 132.67 ) | May 150.00 covered write. |
Daily Equity & Market Analysis
Loading, Please Wait...
