
With the change from one quarter to the next, we have reconstituted and rebalanced the suite of Dorsey Wright Technical Leaders indices. Today, we will review the stocks that moved in and out of the DWA Technical Leaders Index as well as the DWA SmallCap Technical Leaders Index.
Broad domestic equity markets had quite an impressive run in 2021, with the S&P 500 Index TR.SPXX posting a total return of 28.71%. This was the third-highest annual return since the year 2000 and the ninth highest gain in any year since 1950. In the final week of Q4, the SPX marked its 70th new all-time high of the year with the close at 4793.06. There have only been two other years that have seen more ATHs, with 73 in 1954 and 77 in 1995. In fact, there have only been 25 years where the S&P 500 has printed at least 25 new ATHs.
When we focus on total returns during the final quarter of 2021, we find that the S&P 500 finished strong with a double-digit gain of 11.03%, while the Nasdaq Composite XCMP and Dow Jones Industrial Average .DINDR finished up 8.45% and 7.87%, respectively. Like what we saw take place in the second and third quarters, small-cap stocks continued to lag their large and mega-cap counterparts. Despite this relative underperformance, iShares S&P SmallCap 600 Index Fund IJR.TR and the iShares Russell 2000 ETF IWM.TR managed to finish the quarter in positive territory with respective gains of 5.56% and 2.00%. While we saw broad US market indexes hit new all-time highs in Q4, momentum-based strategies continued to struggle as they had throughout much of the year with the Dorsey Wright Technical Leaders Index TLLARGE.TR posting a total return of 5.84%, underperforming the S&P 500 Index and iShares Russell 1000 ETF IWB.TR benchmarks by -5.19% and -3.89%, respectively. In the end, elevated volatility and choppy market action caused the TLLARGE.TR Index to significantly underperform both benchmarks on a total return basis in 2021 as trends were more difficult to capture. The Dorsey Wright SmallCap Technical Leaders Index TLR2000.TR finished the fourth quarter in the black with a gain of 3.12%, outperforming the iShares Russell 2000 ETF IWM.TR by 1.12% while underperforming the iShares S&P SmallCap 600 Index Fund IJR.TR by -2.44% in Q4. When all was said and done in 2021, the TL2000.TR Index posted a gain of 20.65%, outpacing the IWM benchmark by over 6% while underperforming the IJR benchmark by -5.93%.
As you've heard us discuss before, every investment strategy, whether it is value investing, growth investing, fundamental, or even trend following, goes through periods of underperformance, and Relative Strength investing (RS) is no different. RS laggard periods can be uncomfortable, and when looking in the rearview mirror (early 2016, late 2018, or 2021), it serves as an unfriendly reminder of this. As you discuss your process with prospects and clients, it's important for them to understand that sometimes RS-based strategies such as the Dorsey Wright Technical Leaders Index and the Dorsey Wright SmallCap Technical Leaders Index, are not immune to periods of underperformance, however, we have found that RS has tended to rebound out of these laggard periods, providing, at times, consistent and robust returns. As a result of shifting strength, we saw 46 changes (out of 100 holdings) in the TLLARGE.TR with this most reconstitution and 89 changes (out of 200 holdings) in TLR2000.TR, repositioning both portfolios toward areas of leadership.

Below you'll find an update to the changes made in both strategies with the most recent index reconstitution. Keep in mind that positions that have been removed no longer maintain characteristics of superior Relative Strength. Meanwhile, additions have improved to a place of leadership and may even be ideas to consider on an individual stock basis.
Dorsey Wright Technical Leaders Index Process
The stock-selection process behind the Dorsey Wright Technical Leaders Index strategy is quite simple yet robust. Every quarter, we apply the Relative Strength process to compare approximately 1,000 large and mid-cap US stocks and select the strongest 100 names. The quarterly reconstitution process's primary goal is to consistently weed out the weak names and realign the portfolio toward strength. With this most recent reconstitution and rebalance, we removed 46 stocks and added 46 new stocks, which we've compiled in the tables below. One of the more interesting observations is the "Average Technical Attribute Reading" for the two lists. As of 1/5/2022, the 46 stocks added to the strategy this quarter have an average technical attribute rating of 4.61. The 46 stocks that were removed, however, have a weaker average attribute rating of 1.87.
Dorsey Wright Technical Leaders Index Changes
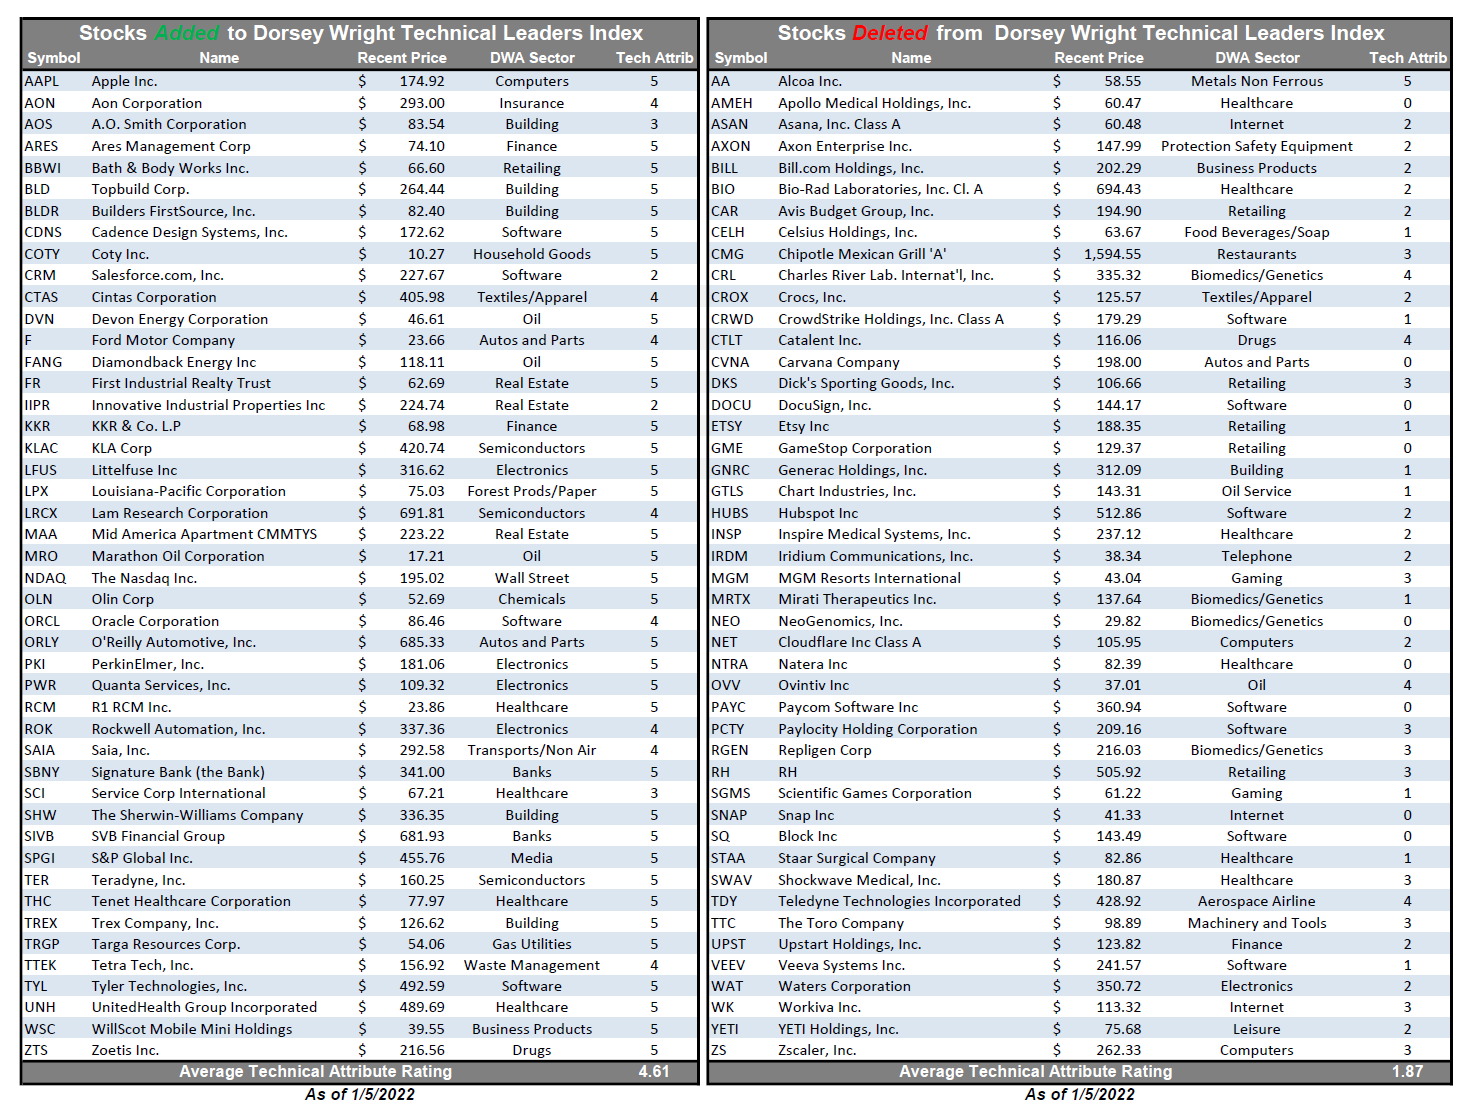
Dorsey Wright Technical Leaders Index Stats:
- Out of the 46 stocks added, the industrials sector accounted for the most at 28.3% followed by the technology sector at 17.4%. Financials made up 13%.
- Of the 46 stocks removed, Upstart Holdings, Inc. UPST was the worst-performing in Q4 with a loss of -52.19%, followed by DocuSign Inc. DOCU, down -40.83%.
- Technology accounted for the majority (26.1%) of the removals this quarter, followed by the healthcare sector (23.9%).
- Of the 46 new additions to the strategy this quarter, 34 are perfect 5 for 5'ers while 44 are high attribute names (3, 4, and 5'ers). With the exception of Salesforce.com, Inc. CRM and Innovative Industrial Properties, Inc. IIPR, all newly added names are trading in overall positive trends (above their respective bullish support lines).
Dorsey Wright SmallCap Technical Leaders Index Process
The stock-selection process behind the Dorsey Wright SmallCap Technical Leaders Index is quite simple, yet robust. Every quarter, we apply the Relative Strength process to compare approximately 2,000 US-listed small-cap stocks and select the strongest 200 names. The quarterly reconstitution process's primary goal is to consistently weed out the relatively weak names and realign the portfolio toward strength. With this most recent reconstitution and rebalance, we removed 89 stocks and added 89 new stocks, which we've compiled in the table below. One of the more interesting observations is the "Average Technical Attribute Reading" for the two lists. As of 1/5/2022, the 89 stocks added to the strategy this quarter have an average technical attribute rating of 4.40. The 89 stocks that were removed, however, have a weaker average attribute rating of 2.10.
Dorsey Wright SmallCap Technical Leaders Index Changes
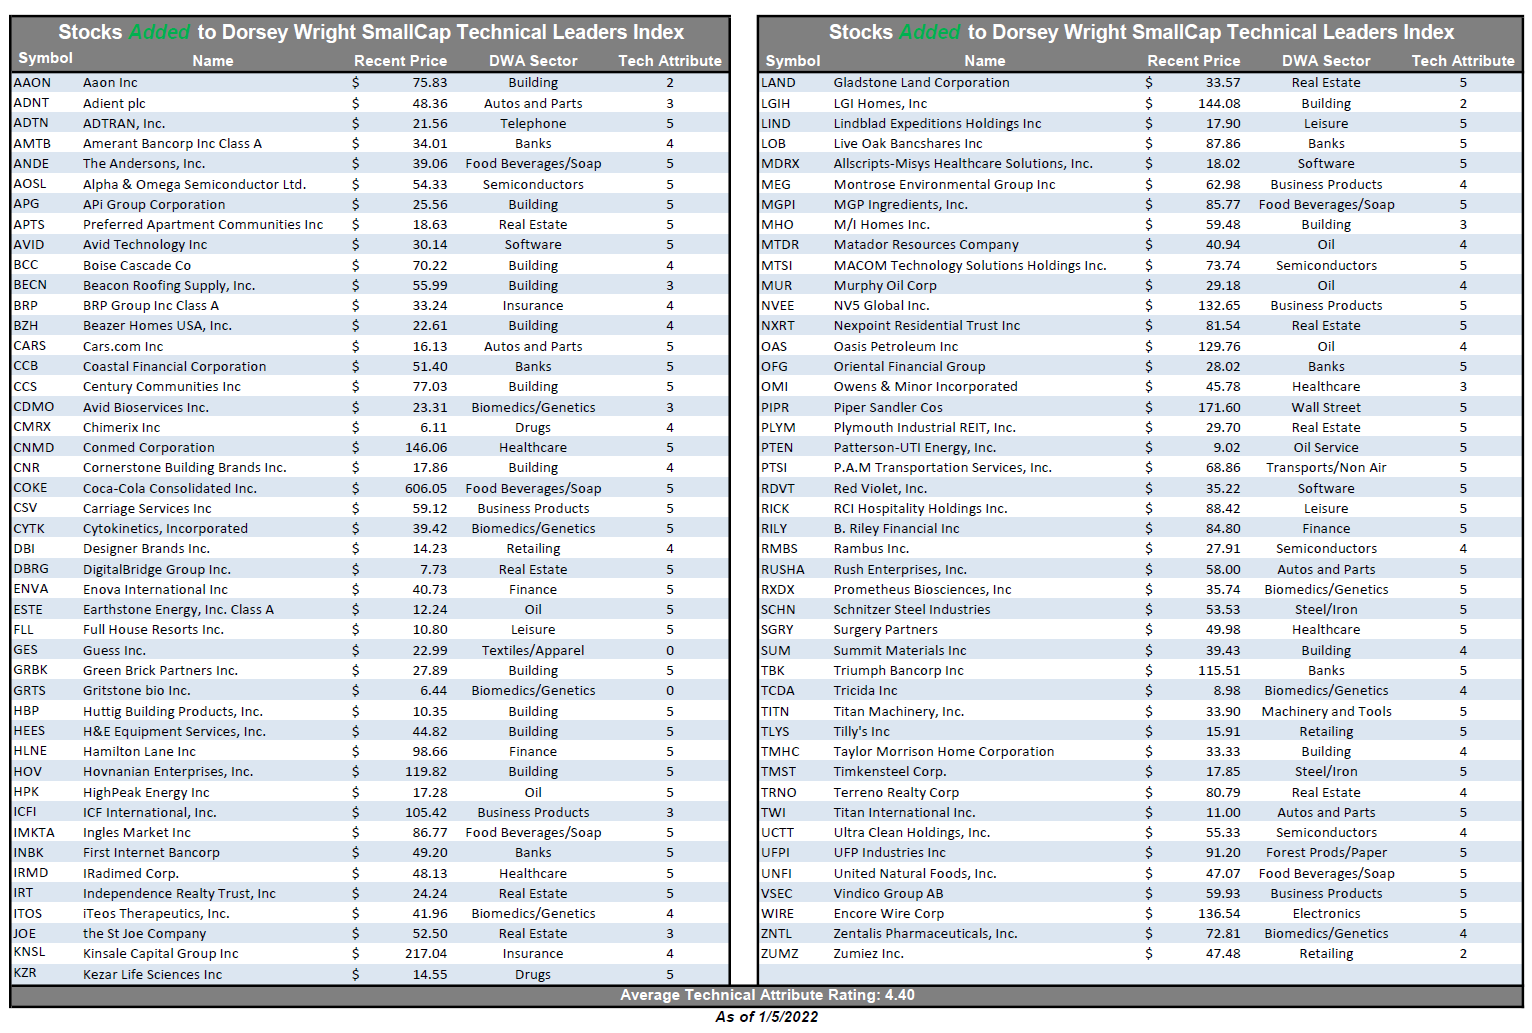
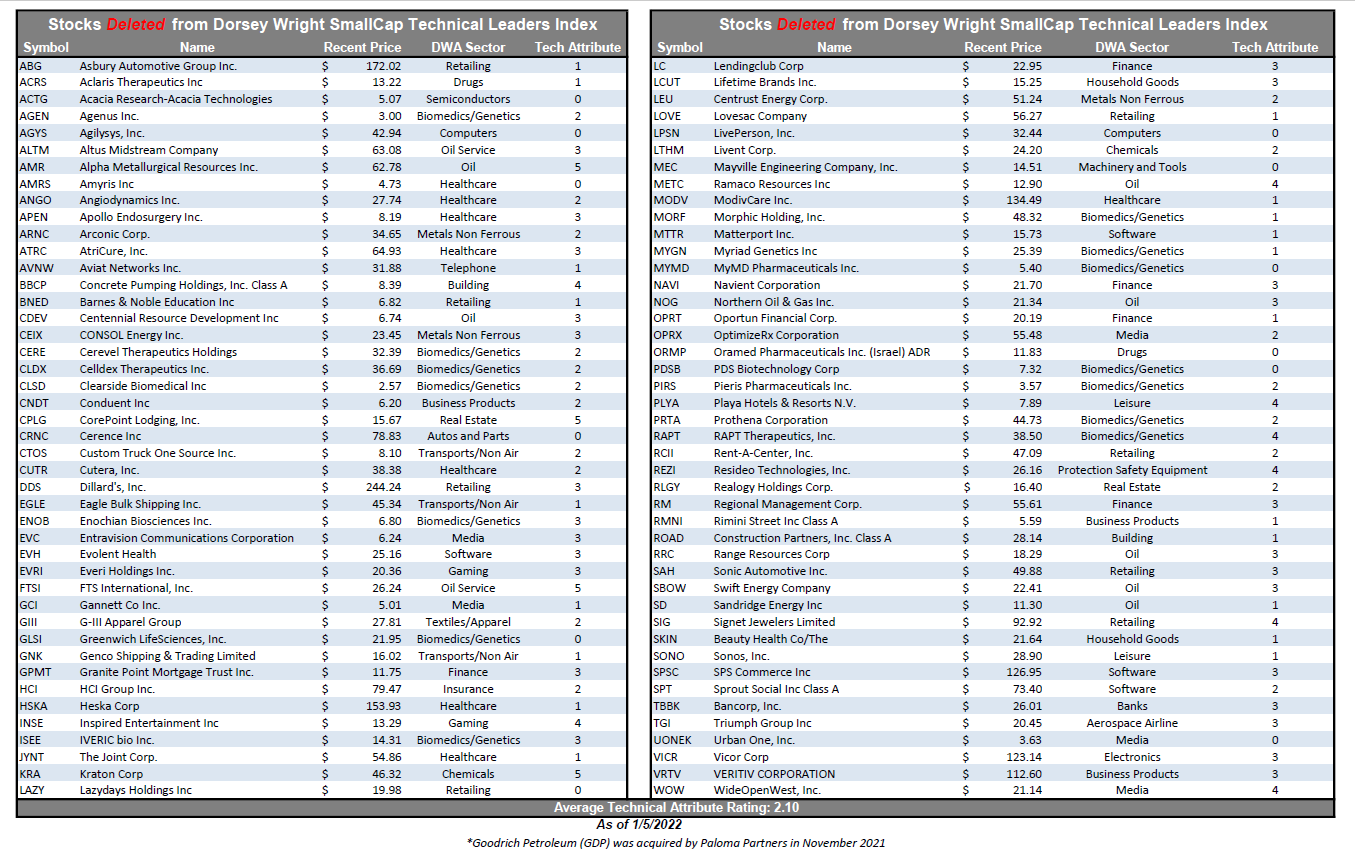
Dorsey Wright SmallCap Technical Leaders Index Stats:
- Out of the 89 stocks added, the cyclicals sector accounted for the most additions at 20.2%, followed by industrials at 19.1%.
- Of the 89 stocks removed, Amyris Inc. AMRS was the worst-performing in Q4 with a loss of -60.60%, followed by Clearside Biomedical CLSD, down -54.17%.
- Healthcare accounted for the majority (27.3%) of the removals this quarter, followed by consumer cyclicals (20.5%) and industrials (12.5%).
- Of the 89 new additions to the strategy this quarter, 57 are perfect 5 for 5'ers while 84 are high attribute names (3, 4, and 5'ers).
