Most Requested Symbols

With just 19 trading days left in the year, we review the historical performance dispersion between the first half and the second half of December.
The average distribution reading is -17.65% oversold.
Today's featured stock is United Microlectronics Corporation (Taiwan) ADR (UMC).
ABBV, ABT, DHI, EVTC, GPI, JACK, ORLY, WIRE & WOLF
Call: Apple Inc (AAPL); Put: Intel (INTC); Covered Write: The Kroger Co (KR).
Year-End Review Webinar with RIA Database: With inflation concerns impacting many facets of the US markets in 2021, we will address how leadership trends across major asset classes and US equity sectors have adapted to these pressures in an upcoming webinar with RIA Database. The discussion will take place on December 8th at 2pm ET and is approved for one hour of CFP®, CFA® & CIMA®, CIMC® or CPWA® CE Credit for webcast attendees. Click Here to Register.
Markets rebounded to start the trading week - the S&P 500 (SPX) gained 1.17%, the Dow jumped 1.87%, and the Nasdaq edged up 0.93%. However, Friday’s (12/3) selloff brought further damage to a handful of our technical indicators and resulted in some notable upside breakouts for defensive assets.
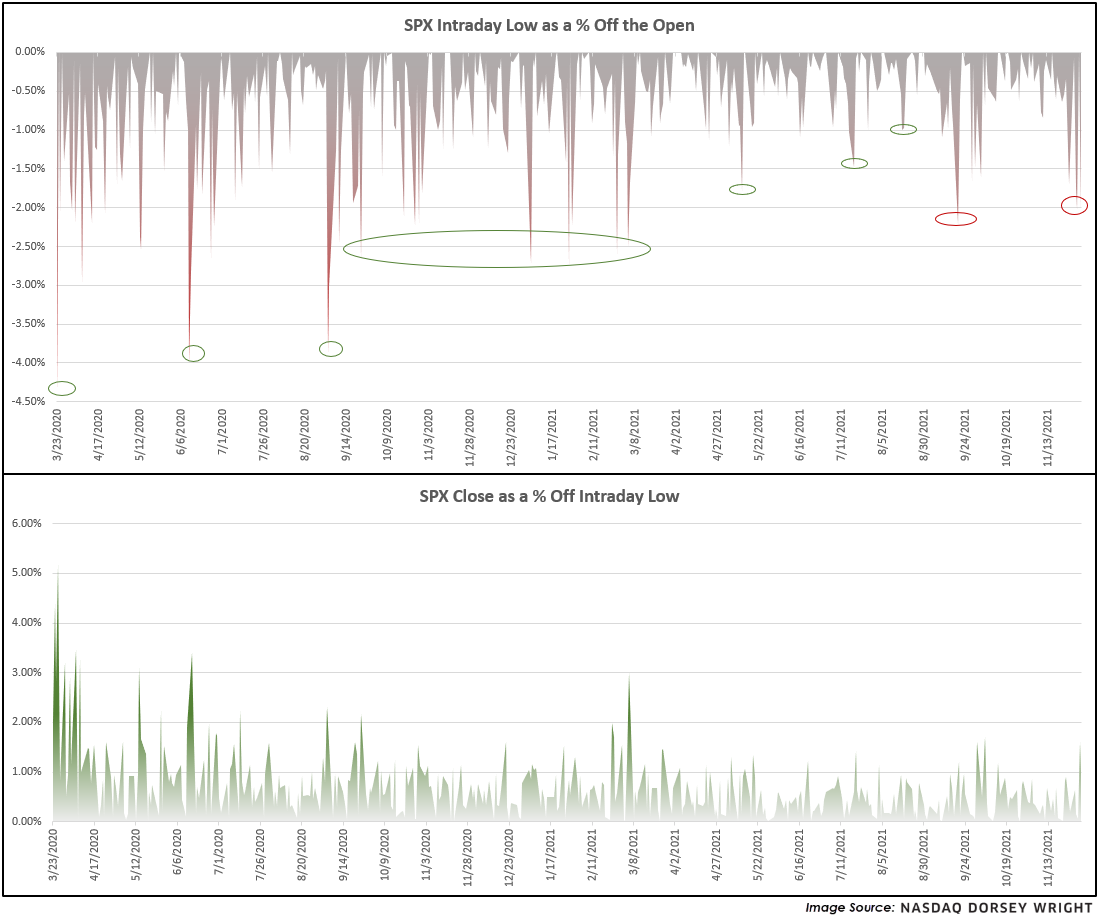
Something else to pay attention to is the temporarily fading “buy the dip” mentality, at least as it relates to the cap-weighted S&P 500 (SPX). The top chart below plots the intraday low for SPX as a percentage off the opening price. After the COVID bottom in March of 2020 we saw less severe intraday drawdowns relative to the open, implying that people were quickly buying dips, but that trend seems to have recently broken down as highlighted in red. The current magnitude coincides with the September 2020 and March 2021 market environments - a movement of greater magnitude/deeper than these levels could be interpreted as troublesome.
Much remains unknown at this time with conflicting themes at play, and markets hate uncertainty. Although near-term indicators are approaching oversold territory and prices are coinciding with previous bottoms, we have not seen demand meaningfully reenter the picture...yet.

As we enter the first full trading week of December, we are now in the final stretch of 2021 with just 19 trading days left in the year after Monday. Those who are regular readers of our reports know that there are several market tendencies or historical biases that we highlight throughout the year. One such study is the tendency for December to produce strong returns for major domestic equity market indices. We have seen this from the S&P 500 Index, as December has produced the third-best average returns of any month using data from 1950 through 2020 at a gain of 1.30%. This has also been demonstrated by the Russell 2000 Index, as December has produced the second-best returns of any month on average using data since 1979 at a 2.14% improvement.
The first few trading days of December 2021 have seen a sharp uptick in volatility that has led most major indices to post declines over the first three trading days of the month, bringing this historical bias into question as we look toward the final few weeks of the year. However, it is often believed that much of the positive returns in prior months of December come in the latter half of the month. The Stock Trader’s Almanac mentions the strong end of month performance as a part of the Santa Claus Rally Study, stating, “Santa Claus tends to come to Wall Street nearly every year, bringing a short, sweet, and respectable rally within the last five days of the year and the first two in January.” We will discuss the Santa Claus Rally in more detail later in the month, but today we wanted to address the historical performance dispersion between the first half and the second half of December.
We have gathered data below for the SPX and RUT over three different segments: the first half of the month, the second half of the month, and the entire month. The performance comparison for each index confirms that almost the entirety of the average net gains for large-caps and small-caps occurs in the second half of the month. Some interesting observations from the yearly performance comparison are provided below, along with the average return summary.
Historical December Performance Observations:
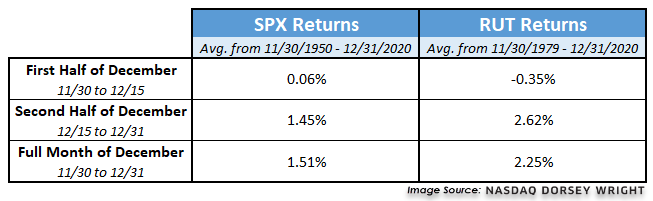
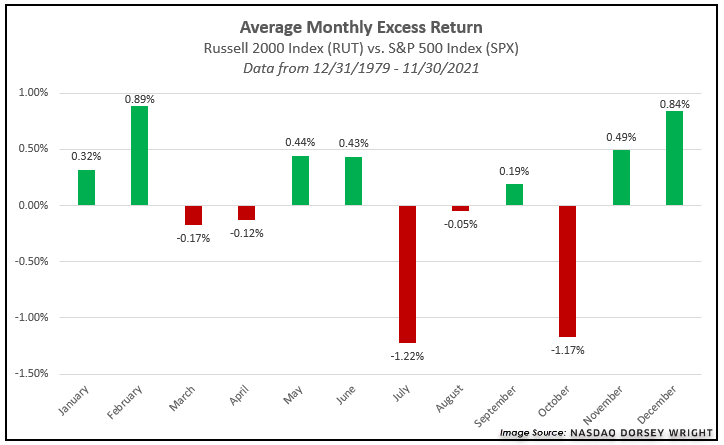
As we can see from the data above, the effect of outperformance in the second half of December is amplified for small-caps relative to large caps. We saw this in our “Modified January Effect” study, which looked at the outperformance of small-caps during holding periods from mid-December through mid-January of each new year. One explanation for this trend is that small stocks being sold for tax-loss purposes begin to rebound toward the end of December and into January as investors are willing to accept more risk in their portfolios. Regardless of the reasoning behind the theme, we see that December has had the second-highest average excess return between RUT and SPX of any month since 1979.
When we think about these December biases in context with the current market, the first half of the current month is certainly setting itself up nicely to demonstrate underperformance. We have seen an uptick in volatility over the past week that has led most major domestic equity indices to begin the month in the red. Despite this volatility, the broad domestic equities asset class has continued to demonstrate resilience across our long-term relative strength rankings such as DALI and the Asset Class Group Scores page. We have also seen some recent relative strength improvement from the small-cap space, as small-cap growth just moved back into the top-ranked position in the domestic equity size and style breakdown in DALI. We will continue to monitor the markets for any material changes in supply and demand relationships, however, keep these historical tendencies of late-December improvement in mind as we look toward the end of the year.
Average Level
-17.65
| AGG | iShares US Core Bond ETF |
| USO | United States Oil Fund |
| DIA | SPDR Dow Jones Industrial Average ETF |
| DVY | iShares Dow Jones Select Dividend Index ETF |
| DX/Y | NYCE U.S.Dollar Index Spot |
| EFA | iShares MSCI EAFE ETF |
| FXE | Invesco CurrencyShares Euro Trust |
| GLD | SPDR Gold Trust |
| GSG | iShares S&P GSCI Commodity-Indexed Trust |
| HYG | iShares iBoxx $ High Yield Corporate Bond ETF |
| ICF | iShares Cohen & Steers Realty ETF |
| IEF | iShares Barclays 7-10 Yr. Tres. Bond ETF |
| LQD | iShares iBoxx $ Investment Grade Corp. Bond ETF |
| IJH | iShares S&P 400 MidCap Index Fund |
| ONEQ | Fidelity Nasdaq Composite Index Track |
| QQQ | Invesco QQQ Trust |
| RSP | Invesco S&P 500 Equal Weight ETF |
| IWM | iShares Russell 2000 Index ETF |
| SHY | iShares Barclays 1-3 Year Tres. Bond ETF |
| IJR | iShares S&P 600 SmallCap Index Fund |
| SPY | SPDR S&P 500 Index ETF Trust |
| TLT | iShares Barclays 20+ Year Treasury Bond ETF |
| GCC | WisdomTree Continuous Commodity Index Fund |
| VOOG | Vanguard S&P 500 Growth ETF |
| VOOV | Vanguard S&P 500 Value ETF |
| EEM | iShares MSCI Emerging Markets ETF |
| XLG | Invesco S&P 500 Top 50 ETF |

| Symbol | Company | Sector | Current Price | Action Price | Target | Stop | Notes |
|---|---|---|---|---|---|---|---|
| AKR | Acadia Realty Trust | Real Estate | $21.03 | 20 - 22 | 28 | 18 | 4 for 5'er, #6 of 154 in REAL sector matrix, one box from RS buy signal, 2.7% yield, |
| STOR | Store Capital Corp. | Real Estate | $32.86 | mid-to-upper 30s | 47.50 | 30 | 5 for 5'er, multiple buy signals, one box from 52-week high, 4.1% yield, R-R>2.0 |
| FOE | Ferro Corp | Chemicals | $21.57 | high teens to low 20s | 35 | 16 | 4 for 5'er, 8 consec buy signals, pullback from recent high, pos trend, top of DWACHEM matrix |
| SC | Santander Consumer USA Holdings Inc. | Finance | $42.40 | high 30s to mid 40s | 57 | 34 | 5 for 5'er, top 10% of DWAFINA, 3 consec buy signals, all-time highs, 2.11% yield, |
| KR | The Kroger Co. | Retailing | $43.43 | hi 30s - low 40s | 50 | 35 | 4 for 5'er, #7 of 97 in RETA sector matrix, multiple buy signals, pullback from ATH, 18% yield |
| NEE | NextEra Energy, Inc. | Utilities/Electricity | $88.03 | low to high 80s | 102 | 68 | 4 for 5'er, 1 box from all-time high, 3 consec buy signals, LT market RS buy signal, pos trend, monthly & weekly momentum |
| GSL | Global Ship Lease Inc. | Transports/Non Air | $21.96 | mid to upper 20s | 40 | 20 | 5 for 5'er, top 10% DWATRAN, 3 consec buy signals, rally highs, 1box from 4th buy signal, 4.34% yield |
| LH | Laboratory Corp. of America Holdings | Healthcare | $290.32 | 280s - low 300s | 336 | 256 | 5 for 5'er, top half of HEAL sector matrix, LT pos mkt RS, pos wkly mom flip |
| ABT | Abbott Laboratories | Drugs | $130.27 | low 120s - low 130s | 174 | 104 | 4 for 5'er, top half of DRUG sector matrix, LT pos mkt RS, spread triple top, pos monthly mom flip, 1.4% yield |
| ESI | Element Solutions Inc. | Chemicals | $22.68 | mid to upper 20s | 37 | 20 | 5 for 5'er, multi-year high, 6 consec buy signals, top of DWACHEM |
| BAM | Brookfield Asset Management | Finance | $55.50 | mid to hi 50s | 70 | 47 | 5 for 5'er, top 20% of FINA sector matrix, LT pos mkt RS, multiple consecutive buy signals |
| BJ | BJ's Wholesale Club Holdings Inc | Retailing | $65.03 | mid-to-upper 60s | 78 | 56 | 4 for 5'er, #10 of 91 in RETA sector matrix, multiple consec buys, pullback from ATH |
| SMCI | Super Micro Computer, Inc. | Computers | $43.23 | low 40s | 52 | 34 | 4 for 5'er, top 20% of COMP sector matrix, multiple buy signals, pullback from ATH |
| TGT | Target Corporation | Retailing | $247.57 | 240s - 260s | 31 | 200 | 5 for 5'er, top half of RETA sector matrix, LT pos mkt RS, multiple consec buy signals, pull back from ATH, 1.5% yield. |
| UMC | United Microlectronics Corporation (Taiwan) ADR | Semiconductors | $12.08 | 11.50 - 12.50 | 19 | 10 | 4 for 5'er, top half of favored SEMI sector matrix, bullish catapult, 2.4% yield, R-R>3.0, pot. cov. write |
| Symbol | Company | Sector | Current Price | Action Price | Target | Stop | Notes |
|---|---|---|---|---|---|---|---|
| LUV | Southwest Airlines Co. | Aerospace Airline | $44.28 | mid 40s | 37 | 53 | 1 for 5'er, consec sell signals, negative trend, low in the unfavored DWAAERO matrix |
| GKOS | Glaukos Corp. | Healthcare | $40.27 | mid 40s | 34 | 50 | 1 for 5'er, market RS in Os this week, consec sell signals, bottom of DWAHEAL, controlled by supply |
| Symbol | Company | Sector | Current Price | Action Price | Target | Stop | Notes |
|---|---|---|---|---|---|---|---|
| COUR | Coursera Inc | Business Products | $26.36 | mid 30s | 21 | 41 | COUR has moved into heavily oversold territory. OK to hold here. Lower buy stop to $38. |
| AMAT | Applied Materials, Inc. | Semiconductors | $145.83 | 140s - low 150s | 212 | 122 | AMAT fell to a sell signal in Monday's trading. OK to hold here. Maintain $122 stop. |
| Comment | |||||||
|---|---|---|---|---|---|---|---|
|
|
|||||||
UMC United Microlectronics Corporation R (Taiwan) ADR ($12.05) - Semiconductors - UMC is a 4 for 5'er that ranks in the top half of the favored semiconductors sector matrix. On its default chart, UMC has given two consecutive buy signals, most recently completing a bullish catapult at $12. The stock also carries a 2.4% yield and offers a potential covered write opportunity on the April '22 call options. Long exposure may be added in the $11.50 - $12.50 range and we will set our initial stop at $10. We will use the bullish price objective, $19, as our target price, giving us a reward-to-risk ratio north of 3.0
| 03 | 04 | 05 | 06 | 07 | 08 | 09 | 10 | 11 | 12 | 14 | 15 | 17 | 19 | 21 | |||||||||||||||||||||||||||||||||||||||
| 12.50 | X | X | 12.50 | ||||||||||||||||||||||||||||||||||||||||||||||||||
| 12.00 | X | O | C | 12.00 | |||||||||||||||||||||||||||||||||||||||||||||||||
| 11.50 | X | 9 | O | X | 11.50 | ||||||||||||||||||||||||||||||||||||||||||||||||
| 11.00 | X | X | 8 | O | X | A | X | Mid | 11.00 | ||||||||||||||||||||||||||||||||||||||||||||
| 10.50 | X | 2 | O | X | O | X | O | X | O | 10.50 | |||||||||||||||||||||||||||||||||||||||||||
| 10.00 | X | O | X | O | 4 | O | 7 | O | 10.00 | ||||||||||||||||||||||||||||||||||||||||||||
| 9.50 | 1 | O | X | O | X | 5 | 6 | 9.50 | |||||||||||||||||||||||||||||||||||||||||||||
| 9.00 | X | O | O | X | O | X | Bot | 9.00 | |||||||||||||||||||||||||||||||||||||||||||||
| 8.50 | • | X | 3 | O | X | 8.50 | |||||||||||||||||||||||||||||||||||||||||||||||
| 8.00 | 4 | • | X | O | 8.00 | ||||||||||||||||||||||||||||||||||||||||||||||||
| 7.50 | X | O | • | C | 7.50 | ||||||||||||||||||||||||||||||||||||||||||||||||
| 7.00 | 3 | O | • | X | 7.00 | ||||||||||||||||||||||||||||||||||||||||||||||||
| 6.50 | X | 5 | • | X | 6.50 | ||||||||||||||||||||||||||||||||||||||||||||||||
| 6.00 | X | 6 | • | B | 6.00 | ||||||||||||||||||||||||||||||||||||||||||||||||
| 5.50 | O | • | • | X | 5.50 | ||||||||||||||||||||||||||||||||||||||||||||||||
| 5.00 | 7 | • | X | 4 | • | A | 5.00 | ||||||||||||||||||||||||||||||||||||||||||||||
| 4.75 | O | X | A | 3 | O | X | O | • | X | • | 4.75 | ||||||||||||||||||||||||||||||||||||||||||
| 4.50 | O | X | O | X | O | X | O | X | O | • | • | X | X | • | 4.50 | ||||||||||||||||||||||||||||||||||||||
| 4.25 | O | X | O | 9 | O | X | O | 5 | • | X | • | • | 8 | O | 9 | • | 4.25 | ||||||||||||||||||||||||||||||||||||
| 4.00 | O | X | O | B | 8 | C | O | 7 | • | • | X | O | • | 1 | • | X | O | X | • | 4.00 | |||||||||||||||||||||||||||||||||
| 3.75 | • | 8 | X | O | X | O | 7 | O | X | O | 4 | 1 | • | A | O | 5 | • | 9 | O | • | X | O | X | • | 3.75 | ||||||||||||||||||||||||||||
| 3.50 | O | 9 | X | O | 6 | • | O | 6 | O | 3 | O | X | O | X | B | 3 | O | • | X | 8 | O | 1 | • | X | O | • | 3.50 | ||||||||||||||||||||||||||
| 3.25 | O | X | C | 5 | • | 7 | X | 9 | X | O | X | O | X | C | X | O | • | 5 | O | 7 | 2 | B | O | • | X | • | 3.25 | ||||||||||||||||||||||||||
| 3.00 | O | X | O | X | • | A | X | A | X | 6 | • | 8 | • | 1 | X | 6 | • | 4 | O | X | 5 | X | O | • | 6 | 7 | • | 3.00 | |||||||||||||||||||||||||
| 2.75 | A | X | 1 | X | • | 4 | O | • | • | • | O | 7 | • | X | 6 | X | 8 | X | 3 | 3 | • | 5 | O | X | • | 2.75 | |||||||||||||||||||||||||||
| 2.50 | O | 2 | • | • | 8 | X | X | 3 | O | O | • | O | X | O | 7 | • | 7 | O | C | • | 2.50 | ||||||||||||||||||||||||||||||||
| 2.25 | • | 9 | X | O | X | O | X | • | • | 7 | X | O | X | O | 6 | A | X | • | 2.25 | ||||||||||||||||||||||||||||||||||
| 2.00 | O | X | O | X | O | X | • | 8 | 6 | X | O | X | O | X | • | 2.00 | |||||||||||||||||||||||||||||||||||||
| 1.75 | O | X | B | • | O | • | B | 7 | X | B | • | 1.75 | |||||||||||||||||||||||||||||||||||||||||
| 1.50 | A | • | • | • | 8 | • | • | 1.50 | |||||||||||||||||||||||||||||||||||||||||||||
| 03 | 04 | 05 | 06 | 07 | 08 | 09 | 10 | 11 | 12 | 14 | 15 | 17 | 19 | 21 |
| ABBV AbbVie Inc. ($121.31) - Drugs - ABBV shares moved higher today to break a double top at $122 to return to a buy signal. This 3 for 5'er has been in a positive trend since November of 2020 and on an RS buy signal versus its peer group since March of 2020. ABBV is actionable at current levels with a weekly overbought/oversold reading of 60%. From here, support is offered at $106. Note that ABBV offers a yield of 4.83%. |
| ABT Abbott Laboratories ($132.59) - Drugs - ABT shares moved higher today to break a double top at $132 to mark its third consecutive buy signal. This 4 for 5'er has been in a positive trend since March of 2020 and on an RS buy signal versus the market since September of 2018. ABT is actionable at current levels with a weekly overbought/oversold reading of 42%. From here, support is offered at $124. |
| DHI D.R. Horton, Inc. ($105.82) - Building - DHI is a 3 for 5’er within the building sector that broke a double top today at $106, marking the fourth consecutive buy signal on the chart. This also matches the stock’s all-time high printed in May. Demand is in control. Support sits at $97. |
| EVTC Evertec Inc ($48.99) - Finance - EVTC rose Monday to break a double top at $48 before reaching a new all-time high at $49 intraday. This 4 for 5'er moved to a positive trend in May 2020 and has been on an RS buy signal against the market since May 2018. Weekly momentum recently flipped positive as well, suggesting the potential for further upside from here. Exposure may be considered on this breakout, with initial support offered at $42. |
| GPI Group 1 Automotive, Inc. ($207.23) - Autos and Parts - GPI returned to a buy signal on Monday with a double top breakout at $208 before moving through additional resistance to mark a new all-time high at $212. This stock is a 4 for 5’er within the autos and parts sector that is controlled by demand. Support sits at $190, the bullish support line. |
| JACK Jack in the Box, Inc. ($80.98) - Restaurants - JACK broke a double bottom at $80 before moving lower to $78, marking the fourth consecutive sell signal. JACK is controlled by supply and has just one attribute in its favor. Avoid. |
| ORLY O'Reilly Automotive, Inc. ($661.42) - Autos and Parts - ORLY is a 5 for 5’er within the autos and parts sector that has maintained a long-term market RS buy signal since September 2002. Today, ORLY broke a double top at 672, marking the stock’s third consecutive buy signal and a new all-time high. From here, support sits at $616. |
| WIRE Encore Wire Corp ($129.85) - Electronics - Shares of WIRE fell 7.61% on Monday, breaking a double bottom at $138 and falling past subsequent support offered at $134. The 5 for 5'er will likely maintain its lofty rank in the electronics stock sector matrix and its high attribute rating, but the near-term flag is yellow. The next level of support is offered at around $124. Demand would reenter the picture with a reversal back up into Xs. |
| WOLF Wolfspeed Inc. ($115.42) - Semiconductors - WOLF broke a double bottom at $122 for a fourth consecutive sell signal and brought the stock back to the middle of its trading band. The stock is still a 3 for 5'er, but holders may seek to trim here or step away depending on cost basis. Support lies at $97, the bullish support line, on the default chart. |

| Name | Option Symbol | Action | Stop Loss |
|---|---|---|---|
| Apple Inc. - $165.32 | O: 22C165.00D18 | Buy the March 165.00 calls at 11.10 | 156.00 |
| Name | Option | Action |
|---|---|---|
| Abbott Laboratories ( ABT) | Feb. 125.00 Calls | Raise the option stop loss to 8.75 (CP: 10.75) |
| Applied Materials, Inc. ( AMAT) | Mar. 150.00 Calls | Stopped at 142.00 (CP: 147.91) |
| Name | Option Symbol | Action | Stop Loss |
|---|---|---|---|
| Intel Corporation - $50.99 | O: 22O52.50D18 | Buy the March 52.50 puts at 4.55 | 57.00 |
| Name | Option | Action |
|---|---|---|
| Tripadvisor Inc (TRIP) | Dec. 35.00 Puts | Stopped at 8.20 (CP: 7.60) |
| Carnival Corporation (CCL) | Feb. 25.00 Puts | Stopped at 6.80 (CP: 6.80) |
| DraftKings Inc Class A (DKNG) | Feb. 45.00 Puts | Stopped at 15.45 (CP: 15.05) |
| Medtronic PLC (MDT) | Feb. 120.00 Puts | Stopped at 12.75 (CP: 11.00) |
| Qorvo Inc. (QRVO) | Feb. 155.00 Puts | Stopped at 0.00 (CP: 153.00) |
| Twilio Inc (TWLO) | Feb. 270.00 Puts | Stopped at 38.90 (CP: 37.15) |
| United Airlines Holdings Inc. (UAL) | Feb. 41.00 Puts | Stopped at 45.00 (CP: 44.15) |
| Name | Option Sym. | Call to Sell | Call Price | Investment for 500 Shares | Annual Called Rtn. | Annual Static Rtn. | Downside Protection |
|---|---|---|---|---|---|---|---|
| The Kroger Co. $43.43 | O: 22C46.00D18 | Mar. 46.00 | 2.70 | $21,444.05 | 22.20% | 18.54% | 4.93% |
| Name | Action |
|---|---|
| Mosaic Company (MOS) - 34.41 | Sell the March 37.00 Calls. |
| Bath & Body Works Inc. (BBWI) - 72.96 | Sell the February 80.00 Calls. |
| EQT Corporation (EQT) - 19.57 | Sell the March 23.00 Calls. |
| Crocs, Inc. (CROX) - 162.38 | Sell the March 190.00 Calls. |
| Alcoa Inc. (AA) - 44.07 | Sell the February 48.00 Calls. |
| Apache Corporation (APA) - 25.58 | Sell the January 27.50 Calls. |
| General Motors (GM) - 59.71 | Sell the March 62.50 Calls. |
| Macy's Inc. (M) - 26.80 | Sell the February 31.00 Calls. |
| The Buckle, Inc. (BKE) - 46.88 | Sell the March 50.00 Calls. |
| Extreme Networks, Inc. (EXTR) - 13.21 | Sell the March 15.00 Calls. |
| Name | Covered Write |
|---|---|
| KeyCorp ( KEY - 22.41 ) | March 23.00 covered write. |
Daily Equity & Market Analysis
NDW MORNING UPDATE
Dec 17, 2025
Loading, Please Wait...
