Markets rebounded to start the trading week, but we are seeing signs that “buy the dip” mentality is fading.
Year-End Review Webinar with RIA Database: With inflation concerns impacting many facets of the US markets in 2021, we will address how leadership trends across major asset classes and US equity sectors have adapted to these pressures in an upcoming webinar with RIA Database. The discussion will take place on December 8th at 2pm ET and is approved for one hour of CFP®, CFA® & CIMA®, CIMC® or CPWA® CE Credit for webcast attendees. Click Here to Register.
Markets rebounded to start the trading week - the S&P 500 (SPX) gained 1.17%, the Dow jumped 1.87%, and the Nasdaq edged up 0.93%. However, Friday’s (12/3) selloff brought further damage to a handful of our technical indicators and resulted in some notable upside breakouts for defensive assets.
- The iShares US Core Bond ETF (AGG) gave a second consecutive buy signal at $115.20. Note this is the first time AGG has been on consecutive Point & Figure buy signals in over three months.
- The NYSE Bullish Percent has been in a column of Os since November 22nd and is approaching the 40-yard line, its lowest level since May of 2020. The NDX Bullish Percent chart returned to “Bear Confirmed” status on Friday and is also near 40%.
- However, major HiLo charts are inching towards washed out territory, although still in deep columns of Os. (NYSEHILO) sits at 24% while (OTCHILO) is down at 15%. Watch for reversals up from these levels.
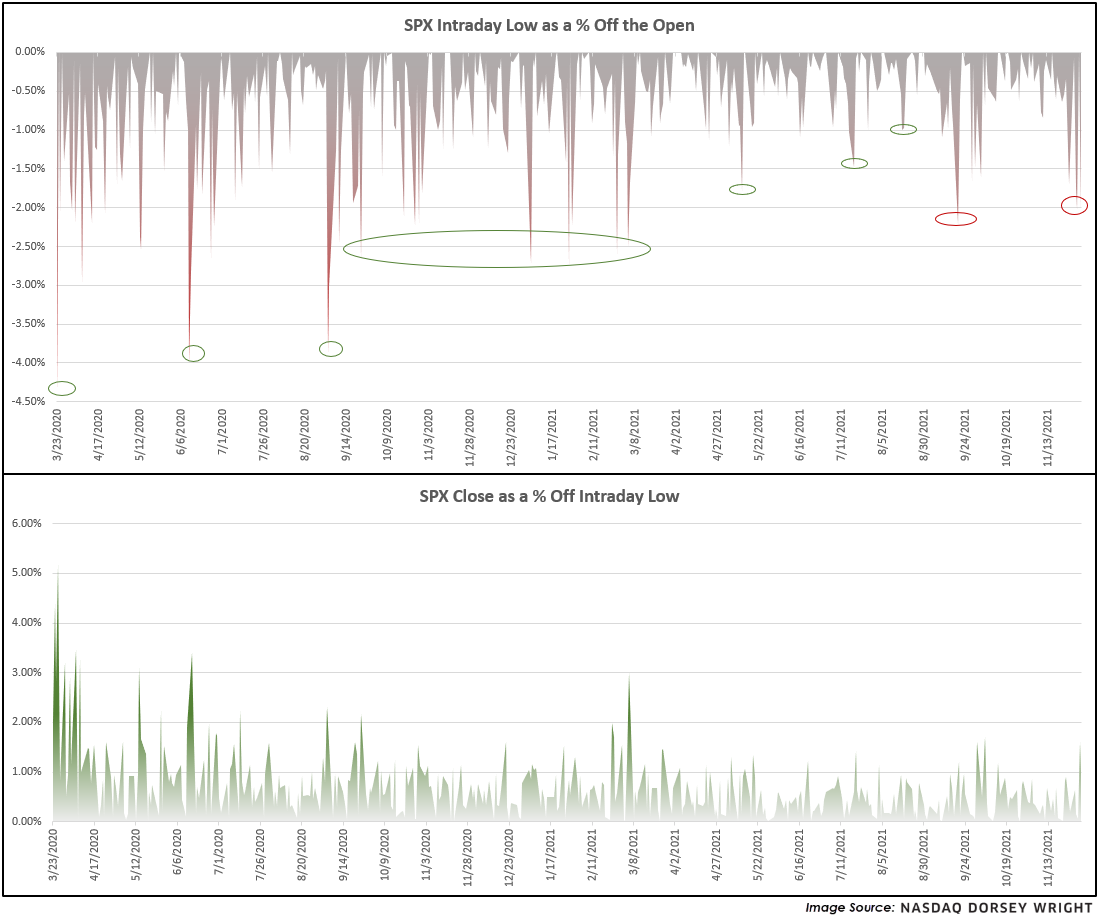
Something else to pay attention to is the temporarily fading “buy the dip” mentality, at least as it relates to the cap-weighted S&P 500 (SPX). The top chart below plots the intraday low for SPX as a percentage off the opening price. After the COVID bottom in March of 2020 we saw less severe intraday drawdowns relative to the open, implying that people were quickly buying dips, but that trend seems to have recently broken down as highlighted in red. The current magnitude coincides with the September 2020 and March 2021 market environments - a movement of greater magnitude/deeper than these levels could be interpreted as troublesome.
Much remains unknown at this time with conflicting themes at play, and markets hate uncertainty. Although near-term indicators are approaching oversold territory and prices are coinciding with previous bottoms, we have not seen demand meaningfully reenter the picture...yet.