
With the change from one quarter to the next, we have reconstituted and rebalanced the suite of Dorsey Wright Technical Leaders indices. Today, we will focus specifically on the DWA Technical Leaders Index, which experienced 44 changes.
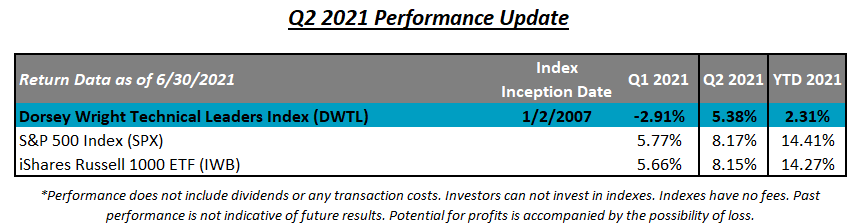
As we head into the second half of the year, we do so with an undoubtedly strong domestic equity market. Both the S&P 500 SPX and Nasdaq NASD reached new all-time highs this week, while the Dow DJIA sits about 450 points or a bit over 1% off of the all-time high it reached in May. After trailing in Q1, the Nasdaq played catch up in the second quarter gaining 9.49%, while SPX was up 8.17%. As a result, NASD now trails the S&P by about 1.7% for the year (through 6/30) after being behind by about 3% at the end of March. We saw a shakeup in Q2 as small-cap stocks lagged their larger-cap counterparts, despite still hanging on to the second-best year-to-date return. We also saw a shift back towards growth stocks after a sharp pivot to value in the prior two quarters. Momentum managed to regain some of its footings throughout the second quarter after having been crowned the worst-performing factor in Q1 and is now back in positive territory for the year. Despite this performance rebound, the Dorsey Wright Technical Leaders Index DWTL finished the second quarter with a gain of 5.38%, causing it to once again underperform the S&P 500 Index SPX by -2.79% as well as the iShares Russell 1000 ETF IWB by -2.77%. As you've heard us discuss before, every investment strategy, whether it is value investing, growth investing, fundamental, or even trend following, goes through periods of underperformance, and Relative Strength investing (RS) is no different. RS laggard periods can be uncomfortable, and when looking in the rearview mirror (early 2016, late 2018, or early 2021), it serves as an unfriendly reminder of this. As you discuss your process with prospects and clients, it's important for them to understand that sometimes RS based strategies such as the Dorsey Wright Technical Leaders Index are not immune to periods of underperformance, however, we have found that the RS has tended to rebound out of these laggard periods, providing, at times, consistent and robust returns. As a result of changing strength, we saw 44 changes (out of 100 holdings) with this most reconstitution in order to reposition the portfolio to areas of leadership which we'll discuss below.
Dorsey Wright Technical Leaders Index Process
The stock-selection process behind the Dorsey Wright Technical Leaders Index DWTL strategy is quite simple yet robust. Every quarter, we apply the Relative Strength process to compare approximately 1,000 large and mid-cap US stocks and select the strongest 100 names. The quarterly reconstitution process's primary goal is to consistently weed out the weak names and realign the portfolio toward strength. With this most recent reconstitution and rebalance, we removed 44 stocks and added 44 new stocks, which we've compiled in the table below. One of the more interesting observations is the "Average Technical Attribute Reading" for the two lists. As of 7/1/2021, the 44 stocks added to the strategy this quarter have an average technical attribute rating of 4.45. The 44 stocks that were removed, however, have a weaker average attribute rating of 2.55. Moving into the third quarter of 2021, the average technical attribute rating for the stocks currently held in the index is now a favorable 4.42. For a full list of the Q3 2021 DWTL holdings, click here.
Dorsey Wright Technical Leaders Index Changes

Dorsey Wright Technical Leaders Index Stats:
- Technology, which caused the most drag on the DWTL's performance last quarter, accounted for 2.61% of the Q2 total return, the most of any broad sector. Real estate caused the most drag at -0.31%. Healthcare was the second-largest contributor, adding 1.11%. (Source: Bloomberg)
- Currently, the Dorsey Wright Technical Leaders Index is overweight industrials at 21%, followed by technology at 19% and consumer discretionary at 17%.
- Out of the 44 stocks added, the healthcare and technology sectors accounted for most additions at 20.5%, followed by consumer cyclical at 18.2%.
- Of the 44 stocks removed, Discovery, Inc. DISCA was the worst-performing in Q2 with a loss of -29.41%, followed by Penn National Gaming PENN, down -27.04%.
- Consumer cyclical accounted for the majority (34.1%) of the removals this quarter, followed by the industrials sector (20.5%).
- Of the 44 new additions to the strategy this quarter, 27 are perfect 5 for 5'ers while all 44 are high attribute names (3, 4, and 5’ers) trading in overall positive trends (above their respective bullish support lines).
Dorsey Wright Technical Leaders Index Attribution
As mentioned above, momentum-based strategies such as the DWTL rebounded in the second quarter of 2021 after a rough start to 2021. Although the Q2 total return of 5.48% was enough to push the DWTL back into positive territory for the year, it was not enough to outperform the SPY’s Q2 total return of 8.52%. The table below breaks down the Q2 2021 performance of the DWTL versus the SPDR S&P 500 ETF Trust SPY, providing a closer look into what sectors drove each higher (or lower) over the last three months. (Note: DWTL’s total return will be different than the actual return because of the way the performance attribution program calculates returns).

- Technology was DWTL’s largest average sector weighting over the second quarter at 29.39% and ended as the top contributing sector on a total return basis, adding 2.61%. Technology was also the SPY’s largest average weighted sector as well as its strongest contributing sector, adding 3.07%, 46bps more than DWTL as broad tech exposure outpaced a more concentrated portfolio.
- Despite being underweight healthcare when compared to the SPY benchmark, healthcare added 1.11% to DWTL’s total return, while it added just 1.07% to the SPY. Concentrated exposure to high RS healthcare names helped drive the portfolio higher despite its relative underweight versus the benchmark.
- There were only two sectors that contributed negatively to the total return of DWTL – real estate and consumer staples, which had respective average weightings of 2.03% and 6.64% in Q2. Real estate’s total return of -12.04% caused the most drag on the portfolio at -0.31%, followed by the consumer staples sector at -0.12%. These remain weaker sectors that sit in the bottom half of the DALI rankings and are areas we would continue to underweight or avoid.
- The industrials sector was the third-largest contributor in Q2, adding 0.61% to DWTL’s total return, and had the second-highest average sector weighting of 19.80% behind tech.
- High RS materials names outpaced broad materials exposure by 5.15% on a total return basis. With an average weighting of 5.23%, industrials added 0.53% to DWTL’s performance.
- DWTL’s average exposure to energy throughout Q2 was 2.49%, which was right in line with the SPY’s average weighting of 2.80%. Despite having nearly the same amount of energy exposure as its benchmark, DWTL’s concentrated exposure to high RS energy stocks ended the quarter with a total return of 23.16%, which added 0.53% to DWTL’s performance. SPY’s broad energy exposure saw a total return of just 11.32%, adding 0.31% to the SPY’s Q2 total return, 22bps less than that of the DWTL.
- Unlike the SPY’s average weighting of 2.58%, DWTL did not have any utilities exposure throughout Q2 as our last reconstitution and rebalance was unable to identify any high momentum stocks in this space. As we’ve mentioned before, sometimes it is not about what you own, but about what you do not own. Utilities remains a low-RS sector that ranks in the basement of the DALI rankings.
- Moving into Q3, DWTL maintains its relative overweight to the industrials, technology, and consumer discretionary sectors and has exposure to all 11 broad sectors with the exception of utilities.
