Most Requested Symbols

The average distribution reading is 26.61% overbought.
Today's featured stock is Select Medical Holdings Corporation (SEM).
AN, APH, MANH, JAKK, & VSTO.
Call: Schlumberger Limited (SLB); Put: Vuzix Corporation (VUZI); Covered Write: Wendy's Company (WEN).
Replay Available - Inflation and Relative Strength Investing Webinar: In this webinar from Tuesday, June 29th, we explored key areas of the market that have shown strong growth potential, and which areas of the market may be poised to participate in an inflationary environment.
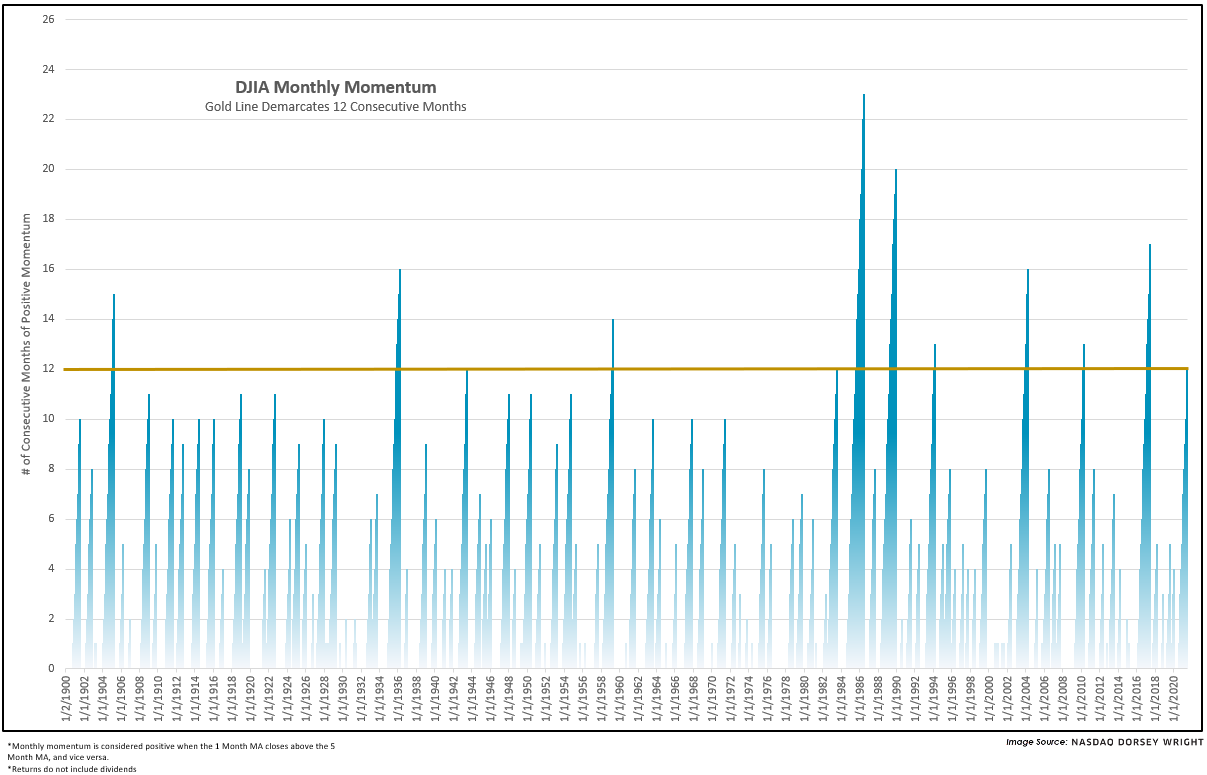
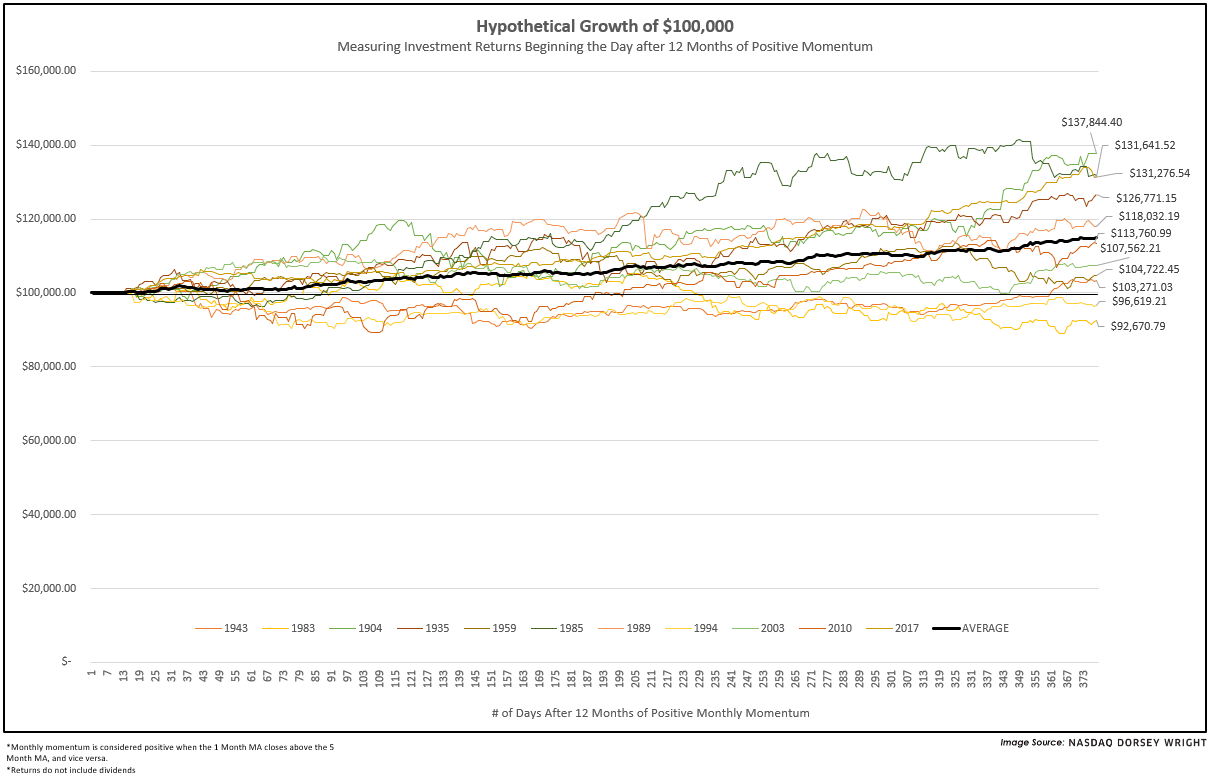
Given Monday’s Were You Aware, which looked at forward returns after the S&P 500 (SPX) experienced 12 months of positive monthly momentum, it may not be a surprise to find the Dow (DJIA) in the same boat.
In fact, the Dow has experienced 12 months of positive momentum 12 times since 1905, with the most recent occurrence taking place almost exactly four years ago (6/30). Historically, the Dow has continued this streak past the one-year mark 82% of the time; the greatest run came in 1986 with 23 consecutive months of positive monthly momentum. As you may expect given the lead up and precedence of the SPX study, historically this has also been a bullish sign for markets. DJIA posted a loss in only two of the 12 calendar years following a streak of 12 consecutive months of positive momentum. Furthermore, the mean and median return were 14.92% and 14.01%, respectively, which are both above the longer-term market averages. Of the two negative years, note that each came after instances where the momentum streak ended at the 12-month mark or one month thereafter. Any streak of 14 or more months had a positive return from its initial 12-month date. The charts below help depict the rarity and forward performance, respectively, of past occurrences.

We're excited to announce the launch of our new NDW Morning Video Update Series! Videos are recorded daily, and our goal for the series is to highlight the previous day’s action, touch on changes we are seeing within the market, and provide a learning avenue for users on how to efficiently and effectively navigate the NDW Research Platform through an analyst-guided format. The daily videos are posted by 9 a.m. ET on the NDW Morning Video Update page under the Research tab and are linked directly on the Daily Equity & Market Report. Videos and video archives can also be accessed via the Media & Education page under "Videos".
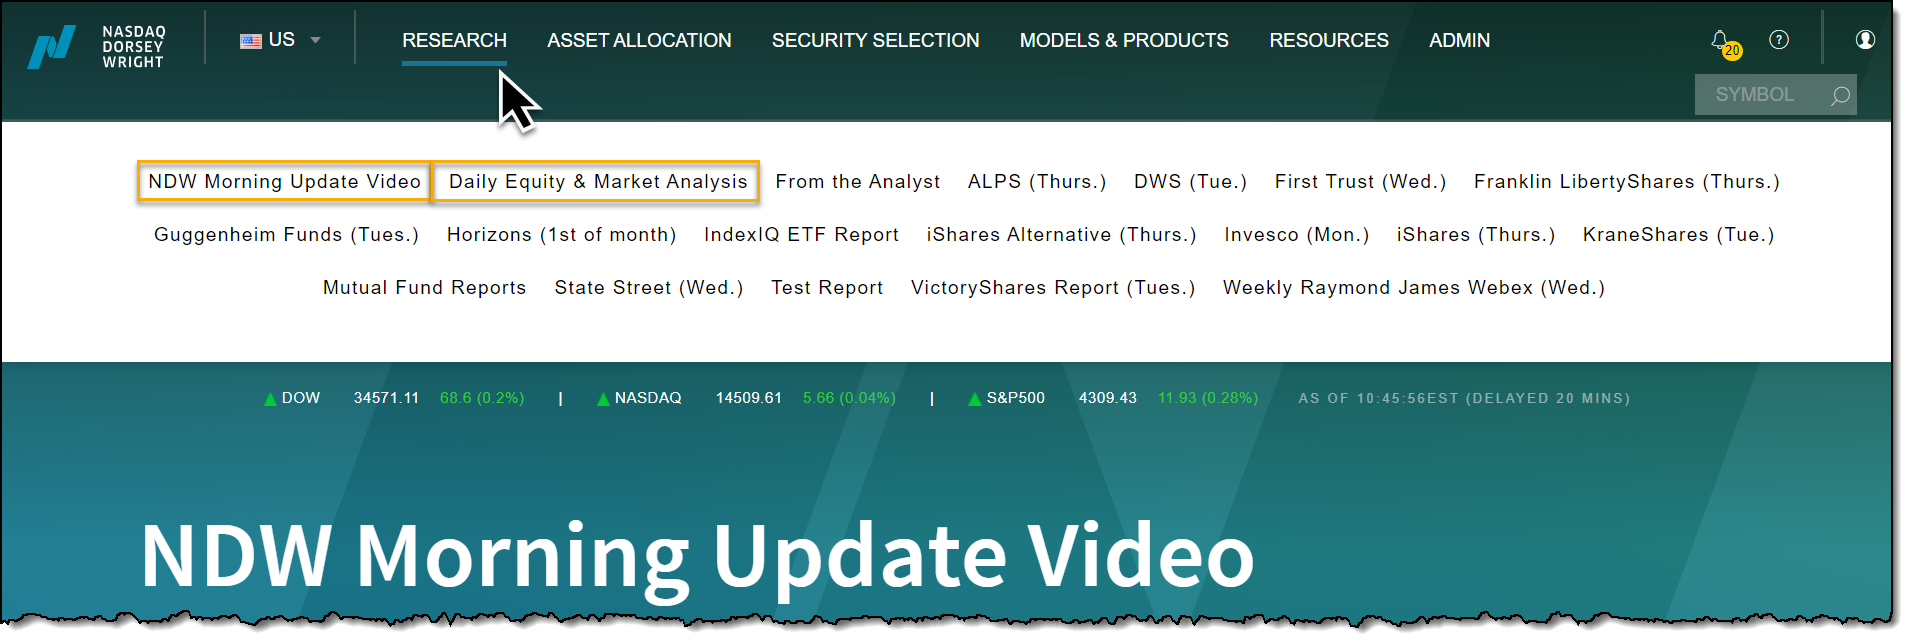
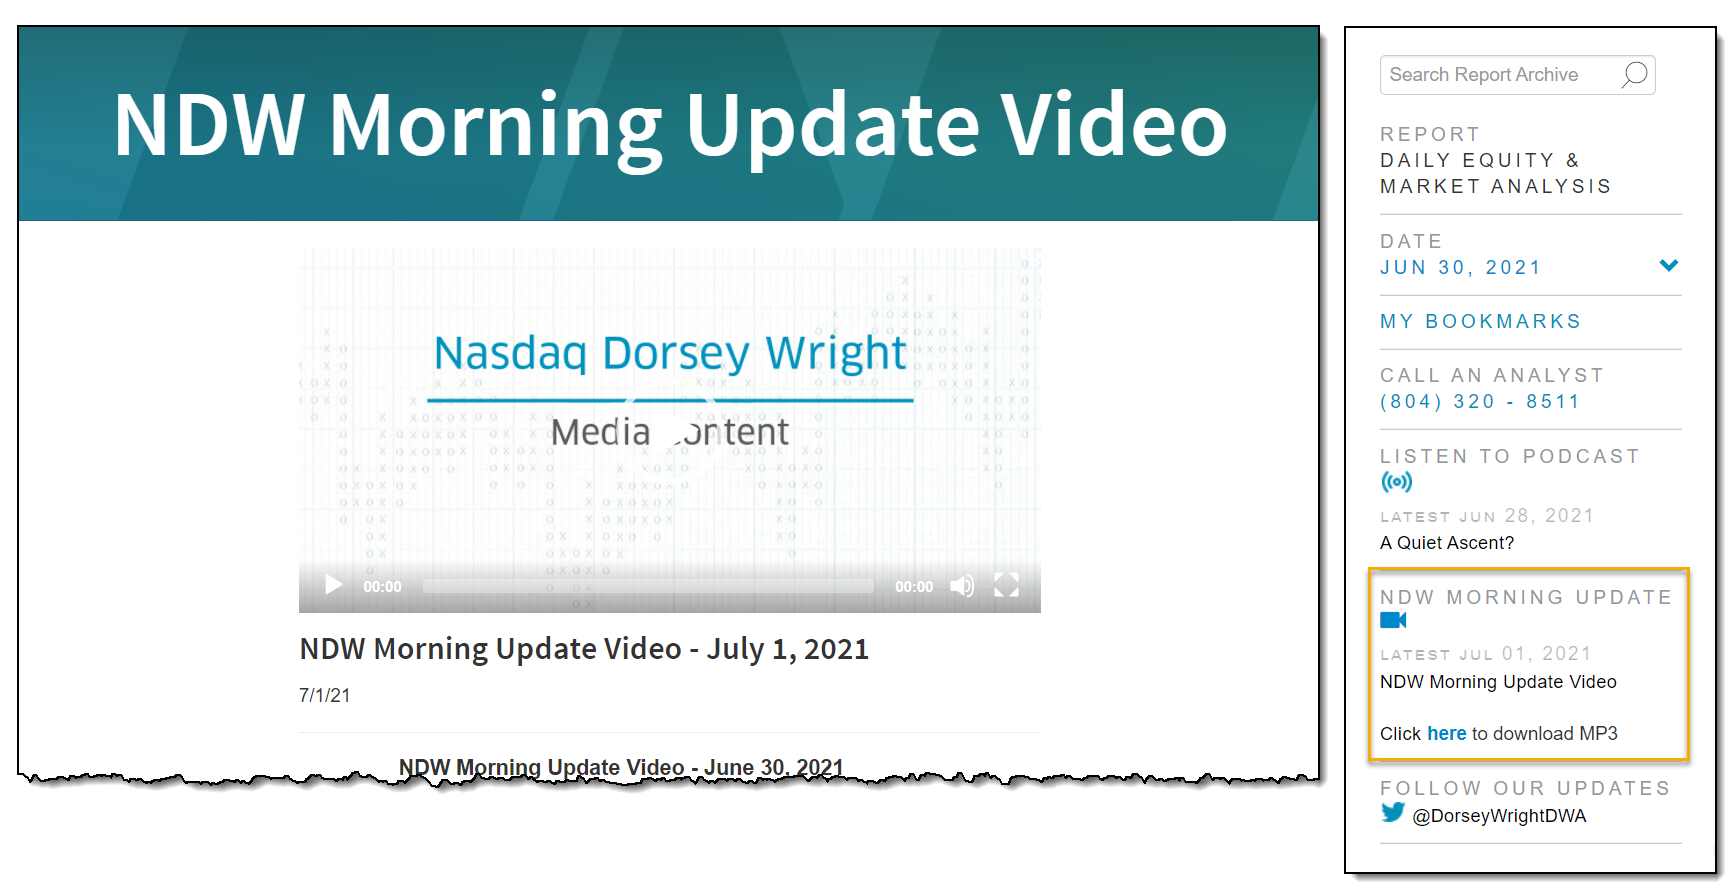
On the NDW Morning Video Update page located under the Research tab, the most current video is displayed at the very top while an archive of past videos is displayed below. Here, users have the ability to view the videos and download the audio files. When scrolling through the Daily Equity and Market Report, users can quickly access the NDW Morning Video Update page by clicking the "NDW Morning Update" link located on the report's right-hand sidebar. Additionally, the NDW Morning Video Update and video archives are housed on the Media & Education page (located under the Resources menu) under "Videos". If you have any questions on where to find the videos or if you want to learn more about the information discussed within the videos, please call the DWA Analyst Team at (804) 320-8511 or email dwa@dorseywright.com.
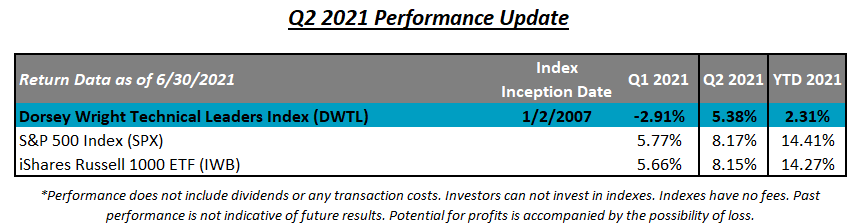
As we head into the second half of the year, we do so with an undoubtedly strong domestic equity market. Both the S&P 500 SPX and Nasdaq NASD reached new all-time highs this week, while the Dow DJIA sits about 450 points or a bit over 1% off of the all-time high it reached in May. After trailing in Q1, the Nasdaq played catch up in the second quarter gaining 9.49%, while SPX was up 8.17%. As a result, NASD now trails the S&P by about 1.7% for the year (through 6/30) after being behind by about 3% at the end of March. We saw a shakeup in Q2 as small-cap stocks lagged their larger-cap counterparts, despite still hanging on to the second-best year-to-date return. We also saw a shift back towards growth stocks after a sharp pivot to value in the prior two quarters. Momentum managed to regain some of its footings throughout the second quarter after having been crowned the worst-performing factor in Q1 and is now back in positive territory for the year. Despite this performance rebound, the Dorsey Wright Technical Leaders Index DWTL finished the second quarter with a gain of 5.38%, causing it to once again underperform the S&P 500 Index SPX by -2.79% as well as the iShares Russell 1000 ETF IWB by -2.77%. As you've heard us discuss before, every investment strategy, whether it is value investing, growth investing, fundamental, or even trend following, goes through periods of underperformance, and Relative Strength investing (RS) is no different. RS laggard periods can be uncomfortable, and when looking in the rearview mirror (early 2016, late 2018, or early 2021), it serves as an unfriendly reminder of this. As you discuss your process with prospects and clients, it's important for them to understand that sometimes RS based strategies such as the Dorsey Wright Technical Leaders Index are not immune to periods of underperformance, however, we have found that the RS has tended to rebound out of these laggard periods, providing, at times, consistent and robust returns. As a result of changing strength, we saw 44 changes (out of 100 holdings) with this most reconstitution in order to reposition the portfolio to areas of leadership which we'll discuss below.
Dorsey Wright Technical Leaders Index Process
The stock-selection process behind the Dorsey Wright Technical Leaders Index DWTL strategy is quite simple yet robust. Every quarter, we apply the Relative Strength process to compare approximately 1,000 large and mid-cap US stocks and select the strongest 100 names. The quarterly reconstitution process's primary goal is to consistently weed out the weak names and realign the portfolio toward strength. With this most recent reconstitution and rebalance, we removed 44 stocks and added 44 new stocks, which we've compiled in the table below. One of the more interesting observations is the "Average Technical Attribute Reading" for the two lists. As of 7/1/2021, the 44 stocks added to the strategy this quarter have an average technical attribute rating of 4.45. The 44 stocks that were removed, however, have a weaker average attribute rating of 2.55. Moving into the third quarter of 2021, the average technical attribute rating for the stocks currently held in the index is now a favorable 4.42. For a full list of the Q3 2021 DWTL holdings, click here.
Dorsey Wright Technical Leaders Index Changes

Dorsey Wright Technical Leaders Index Stats:
Dorsey Wright Technical Leaders Index Attribution
As mentioned above, momentum-based strategies such as the DWTL rebounded in the second quarter of 2021 after a rough start to 2021. Although the Q2 total return of 5.48% was enough to push the DWTL back into positive territory for the year, it was not enough to outperform the SPY’s Q2 total return of 8.52%. The table below breaks down the Q2 2021 performance of the DWTL versus the SPDR S&P 500 ETF Trust SPY, providing a closer look into what sectors drove each higher (or lower) over the last three months. (Note: DWTL’s total return will be different than the actual return because of the way the performance attribution program calculates returns).


One of the major themes over the last couple of months has been the resurgence from growth and in particular mega cap growth. This has led the S&P 500 Index Funds group to find itself as the 5th ranked group out of the 135 groups tracked on the Asset Class Group Scores page. Another way to view this is the US Equity Core Percentile Rank which sits at a hot 97.18%, its highest reading since February of 2020. A high core equity percentile rank conveys two major messages, the core equity market is in strong standing, and there just aren’t many other asset classes that offer more than the core US equity market. For longer-term investors, this is a market where you can lean on broad equity exposure with satellite exposure to diversify the portfolio.

For context, when the core ranks this high it can pose risk for a pullback. Examining the recent rankings on the Asset Class Groups scores page, the S&P 500 Index Funds group has improved, but much of the groups that ranked above it a month ago have deteriorated. So, while it may seem like the core equity market is excessively strong, the short-term shift in leadership from value to growth has played a large role in the S&P 500 Index Funds group having such a high ranking. Most of the groups that ranked above the S&P 500 Index Funds group a month ago were groups associated with value like Financials, Basic Materials, Industrials, Small Cap Blend, and Transportation. As we’ve seen these groups deteriorate while the core market maintains its strong positioning has created an environment where the core percentile rank is at elevated levels.

The core reading will likely not remain at this elevated level, but over the last year, the core equity percentile rank has remained around the 90th percentile with the 10% of asset classes ranked above it seeing a couple of rotations. We seem to be in the middle of yet another growth/value rotation and the core keeps chugging along. This is why when there’s a strong S&P 500 Index, it is beneficial, especially for longer-term investors, to build their portfolios around the core equity market with satellite strategies surrounding it. As long as the core is strong, it’s best not to fight it and even better to take advantage.

Average Level
26.61
| AGG | iShares US Core Bond ETF |
| USO | United States Oil Fund |
| DIA | SPDR Dow Jones Industrial Average ETF |
| DVY | iShares Dow Jones Select Dividend Index ETF |
| DX/Y | NYCE U.S.Dollar Index Spot |
| EFA | iShares MSCI EAFE ETF |
| FXE | Invesco CurrencyShares Euro Trust |
| GLD | SPDR Gold Trust |
| GSG | iShares S&P GSCI Commodity-Indexed Trust |
| HYG | iShares iBoxx $ High Yield Corporate Bond ETF |
| ICF | iShares Cohen & Steers Realty ETF |
| IEF | iShares Barclays 7-10 Yr. Tres. Bond ETF |
| LQD | iShares iBoxx $ Investment Grade Corp. Bond ETF |
| IJH | iShares S&P 400 MidCap Index Fund |
| ONEQ | Fidelity Nasdaq Composite Index Track |
| QQQ | Invesco QQQ Trust |
| RSP | Invesco S&P 500 Equal Weight ETF |
| IWM | iShares Russell 2000 Index ETF |
| SHY | iShares Barclays 1-3 Year Tres. Bond ETF |
| IJR | iShares S&P 600 SmallCap Index Fund |
| SPY | SPDR S&P 500 Index ETF Trust |
| TLT | iShares Barclays 20+ Year Treasury Bond ETF |
| GCC | WisdomTree Continuous Commodity Index Fund |
| VOOG | Vanguard S&P 500 Growth ETF |
| VOOV | Vanguard S&P 500 Value ETF |
| EEM | iShares MSCI Emerging Markets ETF |
| XLG | Invesco S&P 500 Top 50 ETF |

| Symbol | Company | Sector | Current Price | Action Price | Target | Stop | Notes |
|---|---|---|---|---|---|---|---|
| GTES | Gates Industrial Corporation plc | Business Products | $18.04 | high 10s | 22 | 14 | 4 for 5'er, top 1/3 of business products sector RS matrix, bullish triangle, multi-year highs, consec buys |
| GRMN | Garmin Ltd. | Electronics | $146.09 | high 130s to high 140s | 177 | 116 | 5 for 5'er, 5 consec buy signals, double top at ATH,LT market RS buy signal |
| ASML | Asm Lithograpghy HLDG NV (Netherlands) ADR | Semiconductors | $679.31 | mid-to-upper 600s | 856 | 592 | 5 for 5'er, top 10% of SEMI sector matrix, LT pos mkt RS, R-R>2.0 |
| GFL | GFL Environmental Inc | Waste Management | $32.19 | low to upper 30s | 38 | 26 | 5 for 5'er, 5 consec buy signals, pullback from ATH |
| AKR | Acadia Realty Trust | Real Estate | $22.37 | 20 - 22 | 28 | 18 | 4 for 5'er, #6 of 154 in REAL sector matrix, one box from RS buy signal, 2.7% yield |
| CAL | Caleres Inc. | Textiles/Apparel | $28.00 | mid to upper 20s | 32 | 23 | 5 for 5'er, 6 consec buy signals, multi-year high, top 10% of DWATEXT |
| SPR | Spirit Aerosystems Holdings Inc. | Aerospace Airline | $47.65 | high 40s - low 50s | 78 | 40 | 4 for 5'er, top third of AERO sector matrix, bearish signal reversal, R-R>2.5 |
| FHN | First Horizon Corp. | Banks | $17.33 | high 10s | 25.5 | 15.5 | 4 for 5'er, 4 consec buy signals, at multi-year highs, top 15% of DWABANK matrix, 3.28% yield |
| MGM | MGM Resorts International | Gaming | $43.52 | low-to-mid 40s | 59 | 34 | 4 for 5'er, top half of GAME sector matrix, quad top breakout, R-R>2.0 |
| STOR | Store Capital Corp. | Real Estate | $35.63 | mid-to-upper 30s | 47.50 | 30 | 5 for 5'er, multiple buy signals, one box from 52-week high, 4.1% yield, R-R>2.0 |
| OLN | Olin Corp | Chemicals | $46.50 | hi 40s - low 50s | 66 | 38 | 5 for 5'er, #2 of 55 names in chemicals sector matrix, triple top breakout, pullback from ATH, 1.75% yield. |
| WHD | Cactus, Inc. Class A | Oil Service | $39.23 | hi 30s - low 40s | 51.50 | 32 | 5 for 5'er, #2 of 29 in favored OILS sector matrix, bullish triangle, pullback from ATH |
| RVNC | Revance Therapeutics, Inc | Biomedics/Genetics | $30.57 | hi 20s - low 30s | 40 | 26 | 4 for 5'er, top 25% of BIOM sector matrix, quad top breakout, positive trend change, pos monthly mom flip |
| NDLS | Noodles & Company | Restaurants | $12.77 | 11.50 - 13.50 | 20 | 10 | 5 for 5'er, #1 of 28 in REST sector matrix, triple top, pullback to mid of trading band, R-R>2.5 |
| ANF | Abercrombie & Fitch Co. | Retailing | $46.29 | mid-to-hi 60s | 59 | 36 | 5 for 5'er, #6 of 97 names in favored RETA sector matrix, triple top breakout, pos wkly mom flip |
| CRWD | CrowdStrike Holdings, Inc. Class A | Software | $251.16 | 230s-260s | 320 | 204 | 5 for 5'er, pullback from ATH, bullish catapult, top 10% DWASOFT, pos monthly momentum |
| SEM | Select Medical Holdings Corporation | Healthcare | $42.29 | hi 30s - low 40s | 58 | 35 | 5 for 5'er, #8 of 116 names in favored HEAL sector matrix, multiple buy signals, good R-R, Earn. 7/28 |
| Symbol | Company | Sector | Current Price | Action Price | Target | Stop | Notes |
|---|---|---|---|---|---|---|---|
| OPEN | Opendoor Technologies Inc. | Wall Street | $17.09 | low to mid 10s | 2 | 19.50 | 0 for 5'er, 4 consecutive sell signals, negative trend, bottom of DWAWALL matrix, negative monthly momentum |
| Comment | |||||||
|---|---|---|---|---|---|---|---|
|
|
|||||||
SEM Select Medical Holdings Corporation R ($42.64) - Healthcare - SEM is a 5 for 5'er that ranks 8th out of 116 names in the favored healthcare sector matrix. On its default chart, SEM has given six consecutive buy signals and reached a new all-time high last month. Long exposure may be added in the high $30s to low $40s and we will set our initial stop at $35, the first potential sell signal on SEM's default chart. Using a modified vertical price objective based on the most recent buy signal, we will set our target price at $58. Earnings are expected on 7/28.
| 18 | 19 | 20 | 21 | ||||||||||||||||||||||||||||||||||||||||||||||||||
| 43.00 | X | 43.00 | |||||||||||||||||||||||||||||||||||||||||||||||||||
| 42.00 | X | 42.00 | |||||||||||||||||||||||||||||||||||||||||||||||||||
| 41.00 | 6 | 41.00 | |||||||||||||||||||||||||||||||||||||||||||||||||||
| 40.00 | X | 40.00 | |||||||||||||||||||||||||||||||||||||||||||||||||||
| 39.00 | 5 | X | Mid | 39.00 | |||||||||||||||||||||||||||||||||||||||||||||||||
| 38.00 | X | O | X | 38.00 | |||||||||||||||||||||||||||||||||||||||||||||||||
| 37.00 | X | X | O | X | 37.00 | ||||||||||||||||||||||||||||||||||||||||||||||||
| 36.00 | X | O | 4 | O | 36.00 | ||||||||||||||||||||||||||||||||||||||||||||||||
| 35.00 | X | O | X | 35.00 | |||||||||||||||||||||||||||||||||||||||||||||||||
| 34.00 | X | O | X | 34.00 | |||||||||||||||||||||||||||||||||||||||||||||||||
| 33.00 | 3 | O | Bot | 33.00 | |||||||||||||||||||||||||||||||||||||||||||||||||
| 32.00 | X | 32.00 | |||||||||||||||||||||||||||||||||||||||||||||||||||
| 31.00 | X | X | 31.00 | ||||||||||||||||||||||||||||||||||||||||||||||||||
| 30.00 | X | O | X | 30.00 | |||||||||||||||||||||||||||||||||||||||||||||||||
| 29.00 | • | X | O | 2 | 29.00 | ||||||||||||||||||||||||||||||||||||||||||||||||
| 28.00 | X | • | 1 | O | X | 28.00 | |||||||||||||||||||||||||||||||||||||||||||||||
| 27.00 | X | O | • | X | O | X | 27.00 | ||||||||||||||||||||||||||||||||||||||||||||||
| 26.00 | 2 | O | • | C | O | 26.00 | |||||||||||||||||||||||||||||||||||||||||||||||
| 25.00 | X | O | • | X | 25.00 | ||||||||||||||||||||||||||||||||||||||||||||||||
| 24.00 | 1 | O | • | B | 24.00 | ||||||||||||||||||||||||||||||||||||||||||||||||
| 23.00 | C | 3 | • | X | 23.00 | ||||||||||||||||||||||||||||||||||||||||||||||||
| 22.00 | • | X | O | X | • | X | 22.00 | ||||||||||||||||||||||||||||||||||||||||||||||
| 21.00 | X | • | • | X | O | X | O | • | X | X | A | 21.00 | |||||||||||||||||||||||||||||||||||||||||
| 20.00 | X | O | X | • | X | O | X | O | • | X | O | X | O | X | 20.00 | ||||||||||||||||||||||||||||||||||||||
| 19.50 | • | • | X | O | X | O | • | X | O | X | O | • | X | X | O | X | O | X | 19.50 | ||||||||||||||||||||||||||||||||||
| 19.00 | X | X | • | 5 | • | 7 | 8 | X | O | • | X | O | O | X | • | X | O | X | 8 | X | 9 | X | • | 19.00 | |||||||||||||||||||||||||||||
| 18.50 | • | • | X | O | X | O | X | O | X | 9 | X | O | • | B | O | X | O | • | X | O | X | O | O | • | 18.50 | ||||||||||||||||||||||||||||
| 18.00 | 1 | • | X | • | • | X | O | X | O | X | O | X | O | X | C | • | • | X | O | X | O | • | X | O | X | • | 18.00 | ||||||||||||||||||||||||||
| 17.50 | X | O | X | O | X | • | X | 3 | O | X | 6 | • | A | B | O | X | • | X | O | X | O | • | 6 | O | X | • | 17.50 | ||||||||||||||||||||||||||
| 17.00 | X | O | X | O | X | O | X | • | 4 | • | • | O | X | O | X | X | O | X | O | X | O | X | X | X | • | X | O | X | • | 17.00 | |||||||||||||||||||||||
| 16.50 | • | O | • | 2 | X | O | X | • | • | O | X | O | X | O | 9 | O | X | O | • | O | X | O | X | O | X | X | O | X | O | X | • | 16.50 | |||||||||||||||||||||
| 16.00 | • | O | O | • | O | O | 2 | 7 | O | X | A | • | • | O | X | O | X | O | X | O | X | O | X | O | X | • | 16.00 | ||||||||||||||||||||||||||
| 15.50 | • | O | X | O | 6 | 8 | X | • | O | X | O | X | O | X | O | X | 5 | X | O | 7 | • | 15.50 | |||||||||||||||||||||||||||||||
| 15.00 | O | X | O | 5 | O | • | O | X | O | X | O | O | X | O | X | O | X | • | 15.00 | ||||||||||||||||||||||||||||||||||
| 14.50 | 1 | 3 | X | • | O | X | 4 | X | O | O | X | O | X | • | 14.50 | ||||||||||||||||||||||||||||||||||||||
| 14.00 | O | X | • | O | X | O | X | O | X | O | • | 14.00 | |||||||||||||||||||||||||||||||||||||||||
| 13.50 | 4 | X | • | O | X | X | O | X | O | X | • | 13.50 | |||||||||||||||||||||||||||||||||||||||||
| 13.00 | O | • | O | X | O | X | O | X | O | • | 13.00 | ||||||||||||||||||||||||||||||||||||||||||
| 12.50 | • | O | X | O | X | O | X | • | 12.50 | ||||||||||||||||||||||||||||||||||||||||||||
| 12.00 | O | X | O | X | O | 12.00 | |||||||||||||||||||||||||||||||||||||||||||||||
| 11.50 | O | X | O | X | 11.50 | ||||||||||||||||||||||||||||||||||||||||||||||||
| 11.00 | O | X | O | 11.00 | |||||||||||||||||||||||||||||||||||||||||||||||||
| 10.50 | O | X | 10.50 | ||||||||||||||||||||||||||||||||||||||||||||||||||
| 10.00 | O | 10.00 | |||||||||||||||||||||||||||||||||||||||||||||||||||
| 18 | 19 | 20 | 21 |
| AN Autonation Inc. ($99.53) - Autos and Parts - AN broke a double top at $99 to complete a bearish signal reversal and return to a near-term buy signal. AN is a 5 for 5'er that ranks in the top quintile of the Autos and Parts sector matrix. Okay to consider here on the breakout. Note resistance lies in the $104 to $106 range, the May 2021 rally highs. Initial support lies at $89, while additional support lies in the $85 to $86 range. |
| APH Amphenol Corporation ($70.12) - Electronics - APH broke a spread quadruple top at $70 to reach a new all-time high. APH is a 4 for 5'er that maintains long-term positive RS versus the market and its peers. Okay to consider here on a breakout or on a pullback to $67. Initial support lies in the $65 to $66 range, and at $63. |
| JAKK Jakks Pacific ($11.81) - Leisure - JAKK broke a double top at $12.50, marking the stock’s second consecutive buy signal. JAKK is a 5 for 5’er that has support available at $10.50 with overhead resistance at $13.50. |
| MANH Manhattan Associates, Inc. ($147.61) - Software - MANH broke a spread quadruple top at $148 and reached a new all-time high. MANH is a 4 for 5'er that ranks just outside the top decile of the Software sector matrix. Okay to consider on a pullback to $142. Initial support lies at $140, while additional support lies at $130. |
| VSTO Vista Outdoor Inc ($41.32) - Leisure - VSTO formed a double top at $47 with yesterday’s action and today, the stock moved to a sell signal at $43 before moving lower to $42. This sets the chart up for a potential shakeout pattern. From here, the action point of the shakeout would trigger with a reversal up into Xs while the pattern would complete with a triple top at $48. |
| Name | Option Symbol | Action | Stop Loss |
|---|---|---|---|
| Schlumberger Limited - $32.79 | O: 21J32.50D15 | Buy the October 32.50 calls at 3.05 | 30.00 |
| Name | Option | Action |
|---|---|---|
| Tempur Sealy International Inc. ( TPX) | Sep. 35.00 Calls | Initiate an option stop loss of 5.70 (CP: 7.70) |
| Microsoft Corporation ( MSFT) | Sep. 250.00 Calls | Raise the option stop loss to 28.10 (CP: 30.10) |
| Accenture PLC ( ACN) | Nov. 300.00 Calls | Initiate an option stop loss of 13.40 (CP: 15.40) |
| Name | Option Symbol | Action | Stop Loss |
|---|---|---|---|
| Vuzix Corporation - $17.73 | O: 21V18.00D15 | Buy the October 18.00 puts at 3.50 | 19.00 |
| Name | Option | Action |
|---|---|---|
| NRG Energy, Inc. (NRG) | Sep. 38.00 Puts | Stopped at 42.00 (CP: 41.46) |
| Liveramp Holdings Inc. (RAMP) | Aug. 50.00 Puts | Initiate an option stop loss of 4.30 (CP: 6.30) |
| Name | Option Sym. | Call to Sell | Call Price | Investment for 500 Shares | Annual Called Rtn. | Annual Static Rtn. | Downside Protection |
|---|---|---|---|---|---|---|---|
| Wendy's Company $23.19 | O: 21K24.00D19 | Nov. 24.00 | 23.19 | $11,007.85 | 20.75% | 13.67% | 4.98% |
| Name | Action |
|---|---|
| The Gap, Inc. (GPS) - 33.52 | Sell the September 38.00 Calls. |
| International Game Technology (IGT) - 23.98 | Sell the October 25.00 Calls. |
| Timkensteel Corp. (TMST) - 13.86 | Sell the August 15.00 Calls. |
| The Gap, Inc. (GPS) - 33.52 | Sell the September 33.00 Calls. |
| Caesars Entertainment Inc. (CZR) - 102.90 | Sell the September 110.00 Calls. |
| Tanger Factory Outlet Centers (SKT) - 19.31 | Sell the September 20.00 Calls. |
| Himax Technologies, Inc. ADR (Taiwan) (HIMX) - 15.91 | Sell the September 16.00 Calls. |
| Devon Energy Corporation (DVN) - 29.96 | Sell the October 30.00 Calls. |
| Hawaiian Holdings, Inc. (HA) - 24.89 | Sell the October 28.00 Calls. |
| Allegheny Technologies, Inc. (ATI) - 21.18 | Sell the October 22.50 Calls. |
| Cleveland-Cliffs Inc. (CLF) - 22.06 | Sell the October 22.00 Calls. |
| Olin Corp (OLN) - 46.50 | Sell the August 47.00 Calls. |
| Marathon Oil Corporation (MRO) - 14.17 | Sell the September 14.00 Calls. |
| Antero Resources Corp (AR) - 15.06 | Sell the November 15.00 Calls. |
| Macy's Inc. (M) - 18.83 | Sell the November 20.00 Calls. |
| Avantor, Inc. (AVTR) - 36.21 | Sell the November 37.50 Calls. |
| Name | Covered Write |
|---|---|
|
|
|
Daily Equity & Market Analysis
LISTEN TO PODCAST
Apr 02, 2026
Loading, Please Wait...
