
Most Requested Symbols

Some recent short-term changes suggest investors may be realigning their equity exposure away from the reflation trade.
The average distribution reading is 22.59% overbought.
Today's featured stock is Diamondback Energy Inc (FANG)
CRTO, DLTH, LEN, MIDD, PII, RGEN, SGMS, TER, VRNS & XYL
Call: Arbor Realty Trust (ABR); Put: Vertex Pharmaceuticals (VRTX); Covered Write: Antero Resources (AR).
The June 2021 June consumer confidence index leaped to 127.3 from 117.2 in May, an over 8% increase month-over-month. The index measures how optimistic or pessimistic consumers are about the state of the economy through spending habits. The benchmark value for the index in order to be viewed as positive is 100, the beginning value when the index began in 1985. The confidence index’s rally above the 120 level is the first time since February of 2020 when the index ended a 32-month consecutive period with a reading above 120. The June increase in consumer confidence also comes after an over 20% increase in March, which was the largest month-over-month increase since November of 2011.
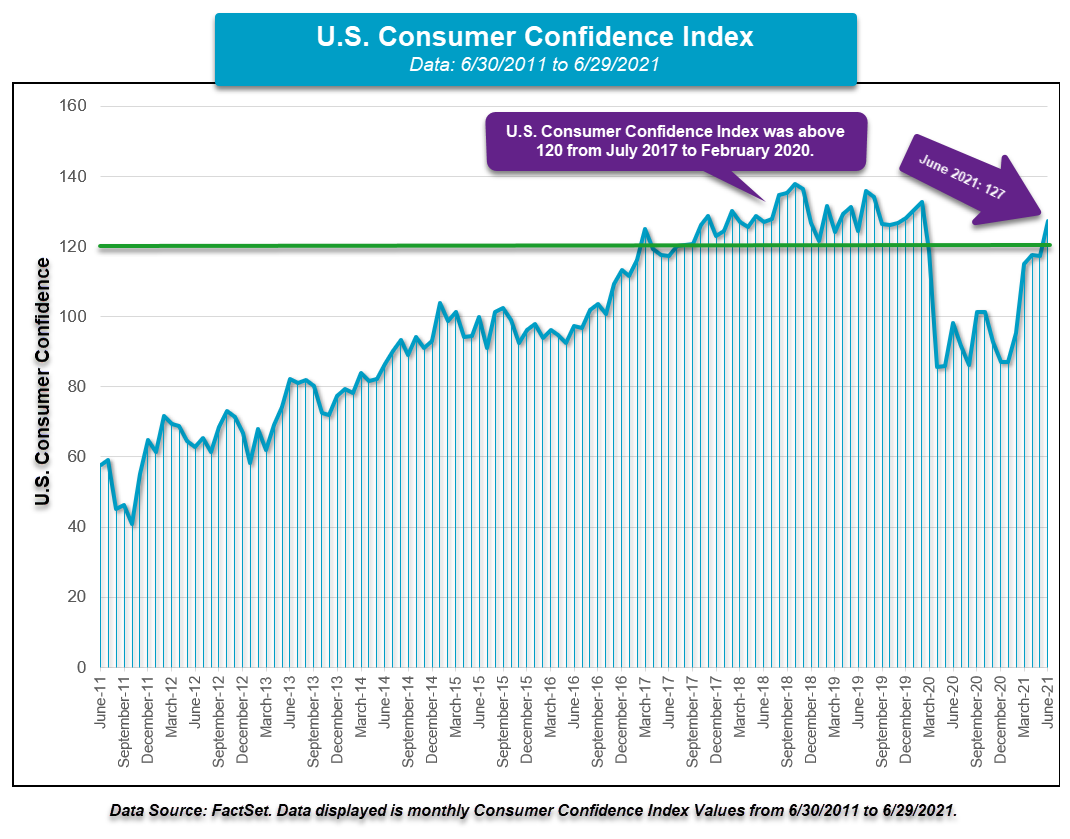
Considering the rally above 120 by the consumer confidence index, we examined the broader asset class and sector performance during the periods within the last 10 years that the index has had monthly readings above 120. From an asset class standpoint, international equities experience positive performance in March 2017, but for the preceding roughly three-year period beginning in July of 2017, domestic equities and fixed income were the only asset classes to outperform even our cash representative. Most notably, this period of high consumer confidence and positive performance by our domestic equity proxy encompasses a time in which domestic equities was the top-ranked asset class. From a sector view, technology and consumer discretionary exhibited the highest level of positive performance during March 2017 and from July 2017 to February 2020. It is worth noting that during that three-year period, 8 out of eleven sectors showed positive performance. The only sectors in negative territory over this time were energy, telecom, and materials.
While we have no way of knowing if consumer confidence will remain high for the foreseeable future – much less for the next 30+ months – we can gather from the performance table that technology and consumer discretionary may be the sectors to watch if consumer confidence is able to remain at elevated levels.


The Federal Reserve announced last week that large banking institutions underwent a stress test and passed easily with many well above the required capital requirements. Riding on the coattails of the announcement, many large American banks announced they would increase dividends and/or share buybacks Monday, June 29th. For much of the year financials, and in particular banks, have exhibited strong signs of relative and absolute strength for the most part despite some shorter-term weakness over the past month. Most analysts did anticipate banks hiking dividends and share buybacks before the announcement, but the announcements were larger than expected. Morgan Stanley doubled its dividend as well as committing $12 billion to share buybacks until 2022, JPMorgan Chase raised its dividend by 11%, Goldman Sachs plans on boosting its dividend by 60%, Wells Fargo plans to double its dividend, and Bank of America will raise its dividend by 17% (CNBC).

All of the banks above are acceptable to buy and/or hold as all have tech attributes of 3 or above. One in particular that has a strong trend chart that is actionable is J.P. Morgan Chase (JPM). JPM is currently a 5 for 5’er that offers support at $148. The stock is actionable at current levels, trading in slightly oversold territory with a weekly overbought/oversold reading of -23%. J.P. Morgan also has the second-highest projected yield on the list of 2.60%, only behind Morgan Stanley.

(Source: etf.com)

This year, the dominant theme in the US equity market has probably been the reopening or “reflation” trade. The hallmark of this trade has been a resurgence in areas of the market that had underperformed during the COVID-19 shutdown and are expected to benefit the most from the resumption of normal economic activity. This theme has been exhibited in the general outperformance of small cap over large, value over growth and at a sector level by strong gains from areas such as energy, financials, and consumer cyclicals. It has also been characterized by an underperforming technology sector, which had been the best performing sector of the market during the COVID shutdown and had led the DALI sector rankings almost continuously for the last few years.
However, recently there has been evidence that the technology sector may be turning around. After hitting a multi-year low around 3.1 in May, the average fund score for the technology group, within the Asset Class Group Scores (ACGS), has rebounded and crossed above the 4.0 threshold earlier this month and now has continued higher to its current level of 4.33. Its average group score places technology second among the macro sectors behind energy, and seventh out of all 135 groups in the ACGS system. Within the DALI sector rankings, which tend to move a bit more slowly than the Asset Class Group Scores, the technology sector remains in the middle of the pack in fifth place, however, we have seen the sector’s buy signal tally stop falling and pick up a few signals over the last few weeks.

We’ve also seen another shift in the existing dynamic, albeit over the very short-term. Since 6/15, following the Federal Reserve’s June meeting when members of the FOMC increased their median projection for interest rates in 2023, we have seen outperformance by large stocks, especially those in the mega cap category. Between 6/15 and 6/28, the Invesco S&P 500 Top 50 ETF XLG has gained 1.88% outperforming, while the S&P 100 ETF OEF gained 1.60%, and the S&P 500 SPX has returned 1.04% over the period. Meanwhile, the S&P iShares Russell 2000 ETF IWM is up just 0.03% over the same period. Of course, this cannot be completely separated from sector themes. As we mentioned above, the technology sector has gained relative strength recently and it is also home to many mega cap stocks. The technology sector accounts for 37.7% of XLG, while it’s only around 27% of the S&P 500.

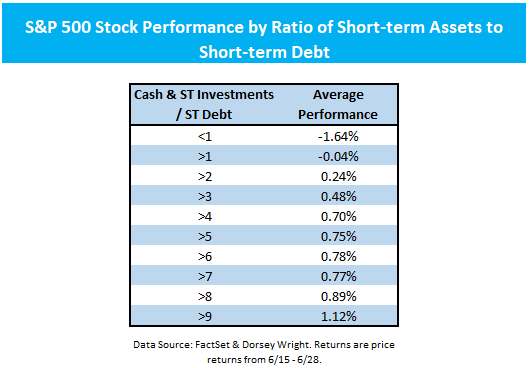
Over the same period, there has also been stronger performance by companies with stronger balance sheets. The table below shows the average (equal weighted) performance for stocks in the S&P 500 (excluding banks) broken out by their ratio of cash and short-term investments to short-term debt. We can see that generally as the ratio of cash and short-term investments to debt increases performance also rises. On average, stocks with a ratio of less than 1.0, i.e. their short-term debts exceed their short-term assets, have returned -1.64%. Meanwhile, at the other end of the spectrum, those with a ratio greater than 9.0 have returned 1.12% on average.
The items we’ve outlined above – the technology sector gaining relative strength, large/mega cap stocks outperforming their smaller counterparts, and stronger performance by firms with better debt profiles – indicate that investors may be adjusting their equity positions away from some of the more speculative areas of the market toward larger more mature stocks with more stability. Bear in mind, however, that in each case we’re talking only about very short-term events that shouldn’t be taken as an immediate call to action, but warrant our attention to see if they develop into sustained trends.

First Trust Feature: Cybersecurity CIBR
With Tuesday’s action, the First Trust NASDAQ Cybersecurity ETF CIBR rallied above $47 to achieve a new all-time high and rally above resistance that dates to February of this year. The tracking index for CIBR seeks to invest in the cybersecurity segment of the broader technology and industrials sector. The chart has been in a column of X’s since mid-May and has added 6.00% during the month of June (5/28/2021 to 6/22/2021), which is much of the ETF’s gain on a year-to-date basis at 6.26%. Overall, CIBR possesses a fund... (Read more)
Invesco Highlight: Invesco Buyback Achievers ETF PKW
There are no changes to any of the Invesco models this week. Year-to-date (through 6/25) value is the best performing factor in our factor ETFs quilt; ranking second is buyback, which is represented by the Invesco Buyback Achievers ETF PKW. PKW tracks an index that is comprised of US securities issued by corporations that have effected a net reduction in shares outstanding of 5% or more in the trailing 12 months (Source: Invesco)... (Read more)
KraneShares MSCI China Environment Index ETF
The past week has seen continued movement to the upside for the KraneShares MSCI China Environment Index ETF KGRN, which pushed higher last Friday to give its second consecutive buy signal in June at $46.50, before rising to $47. This fund saw a sharp drawdown beginning in late February that ran through most of May, but has moved significantly higher in recent weeks to arrive at a recent fund score posting of 4.83, besting the average emerging market equity fund (3.59) as well as the average Chinese equity fund (2.58). This favorable fund score is also paired with a positive 2.83 score direction, which provides further.. (Read more)

Average Level 22.59
| AGG | iShares US Core Bond ETF |
| USO | United States Oil Fund |
| DIA | SPDR Dow Jones Industrial Average ETF |
| DVY | iShares Dow Jones Select Dividend Index ETF |
| DX/Y | NYCE U.S.Dollar Index Spot |
| EFA | iShares MSCI EAFE ETF |
| FXE | Invesco CurrencyShares Euro Trust |
| GLD | SPDR Gold Trust |
| GSG | iShares S&P GSCI Commodity-Indexed Trust |
| HYG | iShares iBoxx $ High Yield Corporate Bond ETF |
| ICF | iShares Cohen & Steers Realty ETF |
| IEF | iShares Barclays 7-10 Yr. Tres. Bond ETF |
| LQD | iShares iBoxx $ Investment Grade Corp. Bond ETF |
| IJH | iShares S&P 400 MidCap Index Fund |
| ONEQ | Fidelity Nasdaq Composite Index Track |
| QQQ | Invesco QQQ Trust |
| RSP | Invesco S&P 500 Equal Weight ETF |
| IWM | iShares Russell 2000 Index ETF |
| SHY | iShares Barclays 1-3 Year Tres. Bond ETF |
| IJR | iShares S&P 600 SmallCap Index Fund |
| SPY | SPDR S&P 500 Index ETF Trust |
| TLT | iShares Barclays 20+ Year Treasury Bond ETF |
| GCC | WisdomTree Continuous Commodity Index Fund |
| VOOG | Vanguard S&P 500 Growth ETF |
| VOOV | Vanguard S&P 500 Value ETF |
| EEM | iShares MSCI Emerging Markets ETF |
| XLG | Invesco S&P 500 Top 50 ETF |
| Symbol | Company | Sector | Current Price | Action Price | Target | Stop | Notes |
|---|---|---|---|---|---|---|---|
| GTES | Gates Industrial Corporation plc | Business Products | $17.95 | high 10s | 22 | 14 | 4 for 5'er, top 1/3 of business products sector RS matrix, bullish triangle, multi-year highs, consec buys |
| GRMN | Garmin Ltd. | Electronics | $144.27 | high 130s to high 140s | 177 | 116 | 5 for 5'er, 5 consec buy signals, double top at ATH,LT market RS buy signal |
| ASML | Asm Lithograpghy HLDG NV (Netherlands) ADR | Semiconductors | $704.11 | mid-to-upper 600s | 856 | 592 | 5 for 5'er, top 10% of SEMI sector matrix, LT pos mkt RS, R-R>2.0 |
| GFL | GFL Environmental Inc | Waste Management | $31.53 | low to upper 30s | 38 | 26 | 5 for 5'er, 5 consec buy signals, pullback from ATH |
| AKR | Acadia Realty Trust | Real Estate | $21.94 | 20 - 22 | 28 | 18 | 4 for 5'er, #6 of 154 in REAL sector matrix, one box from RS buy signal, 2.7% yield |
| CAL | Caleres Inc. | Textiles/Apparel | $26.89 | mid to upper 20s | 32 | 23 | 5 for 5'er, 6 consec buy signals, multi-year high, top 10% of DWATEXT |
| SPR | Spirit Aerosystems Holdings Inc. | Aerospace Airline | $47.41 | high 40s - low 50s | 78 | 40 | 4 for 5'er, top third of AERO sector matrix, bearish signal reversal, R-R>2.5 |
| FHN | First Horizon Corp. | Banks | $17.45 | high 10s | 25.5 | 15.5 | 4 for 5'er, 4 consec buy signals, at multi-year highs, top 15% of DWABANK matrix, 3.28% yield |
| MGM | MGM Resorts International | Gaming | $42.39 | low-to-mid 40s | 59 | 34 | 4 for 5'er, top half of GAME sector matrix, quad top breakout, R-R>2.0 |
| MSFT | Microsoft Corporation | Software | $268.72 | 250s - mid 260s | 288 | 208 | 4 for 5'er, top half of SOFT sector matrix, multiple buy signals, LT pos trend and mkt RS, 0.9% yield |
| STOR | Store Capital Corp. | Real Estate | $35.06 | mid-to-upper 30s | 47.50 | 30 | 5 for 5'er, multiple buy signals, one box from 52-week high, 4.1% yield, R-R>2.0 |
| OLN | Olin Corp | Chemicals | $46.48 | hi 40s - low 50s | 66 | 38 | 5 for 5'er, #2 of 55 names in chemicals sector matrix, triple top breakout, pullback from ATH, 1.75% yield. |
| WHD | Cactus, Inc. Class A | Oil Service | $36.24 | hi 30s - low 40s | 51.50 | 32 | 5 for 5'er, #2 of 29 in favored OILS sector matrix, bullish triangle, pullback from ATH |
| RVNC | Revance Therapeutics, Inc | Biomedics/Genetics | $30.28 | hi 20s - low 30s | 40 | 26 | 4 for 5'er, top 25% of BIOM sector matrix, quad top breakout, positive trend change, pos monthly mom flip |
| NDLS | Noodles & Company | Restaurants | $12.09 | 11.50 - 13.50 | 20 | 10 | 5 for 5'er, #1 of 28 in REST sector matrix, triple top, pullback to mid of trading band, R-R>2.5 |
| FANG | Diamondback Energy Inc | Oil | $92.47 | low to high 90s | 107 | 74 | 5 for 5'er, 3 consec buy signals, pullback from rally high, favored DWAOIL sector, pos weekly mom. |
| Symbol | Company | Sector | Current Price | Action Price | Target | Stop | Notes |
|---|---|---|---|---|---|---|---|
| AVNS | Avanos Medical, Inc. | Healthcare | $37.60 | low 40s - upper 30s | 35 | 47 | 0 for 5'er, negative trend, 3 consecutive sell signals, bottom 25% of DWAHEAL, negative monthly momentum |
| OPEN | Opendoor Technologies Inc. | Wall Street | $17.86 | low to mid 10s | 2 | 19.50 | 0 for 5'er, 4 consecutive sell signals, negative trend, bottom of DWAWALL matrix, negative monthly momentum |
| Comment | |||||||
|---|---|---|---|---|---|---|---|
|
|
|||||||
FANG Diamondback Energy Inc R ($92.95) - Oil - FANG is a perfect 5 for 5’er within the favored oil sector that has given three consecutive buy signals and most recently printed a new 52 week high at $96 before pulling back to support at $92. With today’s action, the chart of FANG has reversed back up into Xs to $95. From here, a move to $97 would mark the fourth consecutive buy signal and a new rally high. Furthermore, weekly momentum has been positive for three weeks, suggesting the potential for higher prices. Okay to add exposure in the low to upper 90s. We will set our initial stop at $74 and will use FANG’s bullish price objective of $107 as our near-term price target.
| 96.00 | X | 96.00 | ||||||||||||||||||||||||||||||||||||||||||||||||||||
| 95.00 | X | X | O | x | 95.00 | |||||||||||||||||||||||||||||||||||||||||||||||||
| 94.00 | X | O | X | O | x | 94.00 | ||||||||||||||||||||||||||||||||||||||||||||||||
| 93.00 | X | O | X | O | x | 93.00 | ||||||||||||||||||||||||||||||||||||||||||||||||
| 92.00 | X | X | X | O | O | 92.00 | ||||||||||||||||||||||||||||||||||||||||||||||||
| 91.00 | X | O | X | X | O | X | 91.00 | |||||||||||||||||||||||||||||||||||||||||||||||
| 90.00 | X | O | X | O | X | O | X | 90.00 | ||||||||||||||||||||||||||||||||||||||||||||||
| 89.00 | X | X | O | X | O | X | O | 89.00 | ||||||||||||||||||||||||||||||||||||||||||||||
| 88.00 | X | X | O | X | O | X | O | X | 88.00 | |||||||||||||||||||||||||||||||||||||||||||||
| 87.00 | X | O | X | X | X | O | X | O | X | O | X | 87.00 | ||||||||||||||||||||||||||||||||||||||||||
| 86.00 | X | O | X | O | X | X | O | X | O | X | O | O | X | 86.00 | ||||||||||||||||||||||||||||||||||||||||
| 85.00 | X | O | X | X | O | X | O | X | O | X | X | O | O | 85.00 | ||||||||||||||||||||||||||||||||||||||||
| 84.00 | X | O | X | O | X | O | X | O | X | O | X | O | X | 84.00 | ||||||||||||||||||||||||||||||||||||||||
| 83.00 | X | O | X | O | X | O | X | O | X | O | X | O | X | Mid | 83.00 | |||||||||||||||||||||||||||||||||||||||
| 82.00 | X | O | X | O | X | O | X | O | X | O | X | O | X | • | 82.00 | |||||||||||||||||||||||||||||||||||||||
| 81.00 | X | O | X | O | X | X | X | 5 | X | O | X | O | X | O | X | 6 | • | 81.00 | ||||||||||||||||||||||||||||||||||||
| 80.00 | X | O | X | O | X | O | X | O | X | O | X | O | O | X | O | X | O | X | • | 80.00 | ||||||||||||||||||||||||||||||||||
| 79.00 | X | O | O | X | X | O | X | O | X | O | O | X | O | X | O | X | X | • | 79.00 | |||||||||||||||||||||||||||||||||||
| 78.00 | X | O | X | O | X | O | X | O | X | O | O | X | O | X | O | X | • | 78.00 | ||||||||||||||||||||||||||||||||||||
| 77.00 | X | O | X | O | X | X | X | O | X | O | X | O | X | O | X | O | X | • | 77.00 | |||||||||||||||||||||||||||||||||||
| 76.00 | X | O | X | O | X | O | X | O | 4 | O | X | O | X | O | O | X | O | • | 76.00 | |||||||||||||||||||||||||||||||||||
| 75.00 | X | O | O | X | O | X | O | X | O | X | O | X | O | • | 75.00 | |||||||||||||||||||||||||||||||||||||||
| 74.00 | X | X | X | O | X | O | X | O | X | O | O | X | • | 74.00 | ||||||||||||||||||||||||||||||||||||||||
| 73.00 | X | O | X | O | X | O | X | O | X | O | O | • | 73.00 | |||||||||||||||||||||||||||||||||||||||||
| 72.00 | X | X | O | X | O | X | O | O | X | • | 72.00 | |||||||||||||||||||||||||||||||||||||||||||
| 71.00 | X | O | X | O | X | O | X | O | X | • | 71.00 | |||||||||||||||||||||||||||||||||||||||||||
| 70.00 | X | O | X | O | X | O | O | • | 70.00 | |||||||||||||||||||||||||||||||||||||||||||||
| 69.00 | X | X | O | X | O | 3 | • | 69.00 | ||||||||||||||||||||||||||||||||||||||||||||||
| 68.00 | X | O | X | O | X | O | X | • | 68.00 | |||||||||||||||||||||||||||||||||||||||||||||
| 67.00 | X | O | X | O | X | O | X | • | 67.00 | |||||||||||||||||||||||||||||||||||||||||||||
| 66.00 | X | O | O | X | O | • | 66.00 | |||||||||||||||||||||||||||||||||||||||||||||||
| 65.00 | X | O | • | 65.00 | ||||||||||||||||||||||||||||||||||||||||||||||||||
| 64.00 | X | X | • | 64.00 | ||||||||||||||||||||||||||||||||||||||||||||||||||
| 63.00 | O | X | O | X | • | Bot | 63.00 | |||||||||||||||||||||||||||||||||||||||||||||||
| 62.00 | O | X | O | X | • | 62.00 | ||||||||||||||||||||||||||||||||||||||||||||||||
| 61.00 | O | X | O | X | • | 61.00 | ||||||||||||||||||||||||||||||||||||||||||||||||
| 60.00 | O | X | O | X | 2 | • | 60.00 | |||||||||||||||||||||||||||||||||||||||||||||||
| 59.00 | O | X | O | X | O | X | • | 59.00 | ||||||||||||||||||||||||||||||||||||||||||||||
| 58.00 | O | O | X | O | X | • | 58.00 | |||||||||||||||||||||||||||||||||||||||||||||||
| 57.00 | O | O | • | 57.00 |
| CRTO Criteo SA ($45.15) - Internet - CRTO broke a double top at $45 before rally up to $46, bringing the chart up to levels not seen since 2018. CRTO is a 5 for 5'er that ranks in the top third of the Internet sector matrix. Okay to consider on a pullback to $43 on the default chart. Initial support lies at $38, while additional support can be found at $34. |
| DLTH Duluth Holdings Inc ($18.45) - Retailing - DLTH broke a spread triple top at $18.50 on Tuesday, marking the stock’s seventh consecutive buy signal. DLTH is a 4 for 5’er within the favored retailing sector that has experienced two months of positive monthly momentum and two weeks of positive weekly momentum. Demand is in control. From here, support sits at $16. |
| LEN Lennar Corporation ($99.47) - Building - LEN is a 4 for 5’er within the building sector that returned to a buy signal today with a double top breakout at $100. LEN is now testing resistance at the $100 level where a triple top has formed. Initial support sits at $96. |
| MIDD The Middleby Corporation ($171.52) - Household Goods - MIDD broke a double top at $174 to complete a bearish signal reversal pattern. MIDD is a 3 for 5'er that ranks in the top third of the Household Goods sector matrix. Weekly momentum has also flipped positive for the first time in 7 weeks. Okay to consider here on the breakout. Note resistance lies at $176 and in the mid $180s. Support lies in the $158 to $160 range, as well as at $154. |
| PII Polaris Inc. ($135.23) - Leisure - PII is a 4 for 5’er within the leisure sector that returned to a buy signal today at $136. PII has experienced two weeks of positive weekly momentum and is trading in a positive trend. From here, support sits at $124 while PII faces resistance at the $144 level. |
| RGEN Repligen Corp ($204.20) - Biomedics/Genetics - RGEN shares moved higher today to break a double top at $204 to mark its fourth consecutive buy signal. This 4 for 5'er moved to a positive trend earlier this month and has been on an RS buy signal versus the market since August of 2018. RGEN shares are actionable at current levels with a weekly overbought/oversold reading of 20%. From here, support is offered at $190 and $188. |
| SGMS Scientific Games Corporation ($78.10) - Gaming - SGMS completed a bullish catapult pattern on Tuesday with a double top breakout at $80. This move also marked a new all-time high on the chart. SGMS is a 5 for 5’er that ranks 2nd out of 17 names in the gaming sector stock matrix. From here, support sits at $74. Note SGMS expects earnings on 7/21. |
| TER Teradyne, Inc. ($134.58) - Semiconductors - Shares of TER moved higher Tuesday to break a double top at $134. This 5 for 5'er moved back to a positive trend in October and has maintained an RS buy signal against the market since early-2019. Weekly momentum also recently flipped positive, suggesting the potential for further upside from here. The overall technical picture is positive and improving. Initial support can be found at $124 with further support offered at $116 and $114, the current location of the bullish support line. Note that the stock is currently at overhead resistance from earlier this month, with the potential for further resistance seen at $138. |
| VRNS Varonis Systems Inc. ($60.15) - Software - Shares of VRNS advanced Tuesday to break a double top at $60. This 4 for 5'er moved back to a positive trend earlier this month and ranks in the top half of the software sector RS matrix. The weight of the technical evidence is favorable and continues to strengthen, however, the stock is now entering overbought territory so those looking to add exposure may be best served to wait for a pullback or normalization of the trading band. Initial support can be found at $55. |
| XYL Xylem Inc ($119.13) - Machinery and Tools - The chart of XYL reversed back up into a column of Xs on Tuesday, forming a triple top at $120. The 4 for 5'er ranks near the top half of the machinery and tools stock sector matrix and currently trades on three consecutive buy signals. Demand is in control yet those looking for additional bullish confirmation may wait for the triple top break which would occur with a move to $122. Initial support is offered at around $114. |
| Name | Option Symbol | Action | Stop Loss |
|---|---|---|---|
| Arbor Realty Trust, Inc. - $18.07 | ABR2115J17.5 | Buy the October 17.50 calls at 1.30 | 16.00 |
| Name | Option | Action |
|---|---|---|
| Microsoft Corporation ( MSFT) | Sep. 250.00 Calls | Raise the option stop loss to 22.65 (CP: 24.65) |
| Applied Materials, Inc. ( AMAT) | Oct. 135.00 Calls | Raise the option stop loss to 12.35 (CP: 14.35) |
| Name | Option Symbol | Action | Stop Loss |
|---|---|---|---|
| Vertex Pharmaceuticals Incorporated - $196.78 | VRTX2115V200 | Buy the October 200.00 puts at 15.50 | 224.00 |
| Name | Option | Action |
|---|---|---|
|
|
||
| Name | Option Sym. | Call to Sell | Call Price | Investment for 500 Shares | Annual Called Rtn. | Annual Static Rtn. | Downside Protection |
|---|---|---|---|---|---|---|---|
| Antero Resources Corp $14.49 | AR2119K15 | Nov. 15.00 | 2.10 | $6,373.90 | 42.16% | 38.69% | 13.16% |
| Name | Action |
|---|---|
| The Gap, Inc. (GPS) - 32.66 | Sell the September 38.00 Calls. |
| International Game Technology (IGT) - 23.74 | Sell the October 25.00 Calls. |
| Timkensteel Corp. (TMST) - 13.92 | Sell the August 15.00 Calls. |
| The Gap, Inc. (GPS) - 32.66 | Sell the September 33.00 Calls. |
| Caesars Entertainment Inc. (CZR) - 100.54 | Sell the September 110.00 Calls. |
| Tanger Factory Outlet Centers (SKT) - 18.43 | Sell the September 20.00 Calls. |
| Himax Technologies, Inc. ADR (Taiwan) (HIMX) - 15.08 | Sell the September 16.00 Calls. |
| Devon Energy Corporation (DVN) - 28.41 | Sell the October 30.00 Calls. |
| Hawaiian Holdings, Inc. (HA) - 25.41 | Sell the October 28.00 Calls. |
| Allegheny Technologies, Inc. (ATI) - 20.71 | Sell the October 22.50 Calls. |
| Cleveland-Cliffs Inc. (CLF) - 20.62 | Sell the October 22.00 Calls. |
| Olin Corp (OLN) - 46.48 | Sell the August 47.00 Calls. |
| Marathon Oil Corporation (MRO) - 13.39 | Sell the September 14.00 Calls. |
| Name | Covered Write |
|---|---|
|
|
|
Daily Equity & Market Analysis
LISTEN TO PODCAST
Apr 02, 2026
Loading, Please Wait...
