
Most Requested Symbols

The second quarter of 2021 has seen volatility in the core domestic equity market continue to decline, even as movement underneath the hood has remained elevated.
The average distribution reading is 20.13% overbought.
Today's featured stock is Noodles & Company (NDLS).
ADI, BRKR, CPK, CSTL, EXPE, FMC, LYB, WYNN & ZBRA
Call: Centene Corporation (CNC); Put: Penn National Gaming Inc (PENN); Covered Write: Marathon Oil Corp (MRO).
Inflation and Relative Strength Investing: May CPI numbers increased the most they have on a month-over-month basis since the 2008 timeframe. The Fed has also recently provided guidance moving up their timeline of interest rate hikes because of inflation picking up quicker than expected. While the impacts to consumers are pretty clear, what does an increase in inflation mean for investors? In this webinar on Tuesday, June 29th, we will explore some key areas of the market that have shown strong growth potential, and which areas of the market may be poised to participate in an inflationary environment. Click here to register.
Speakers:
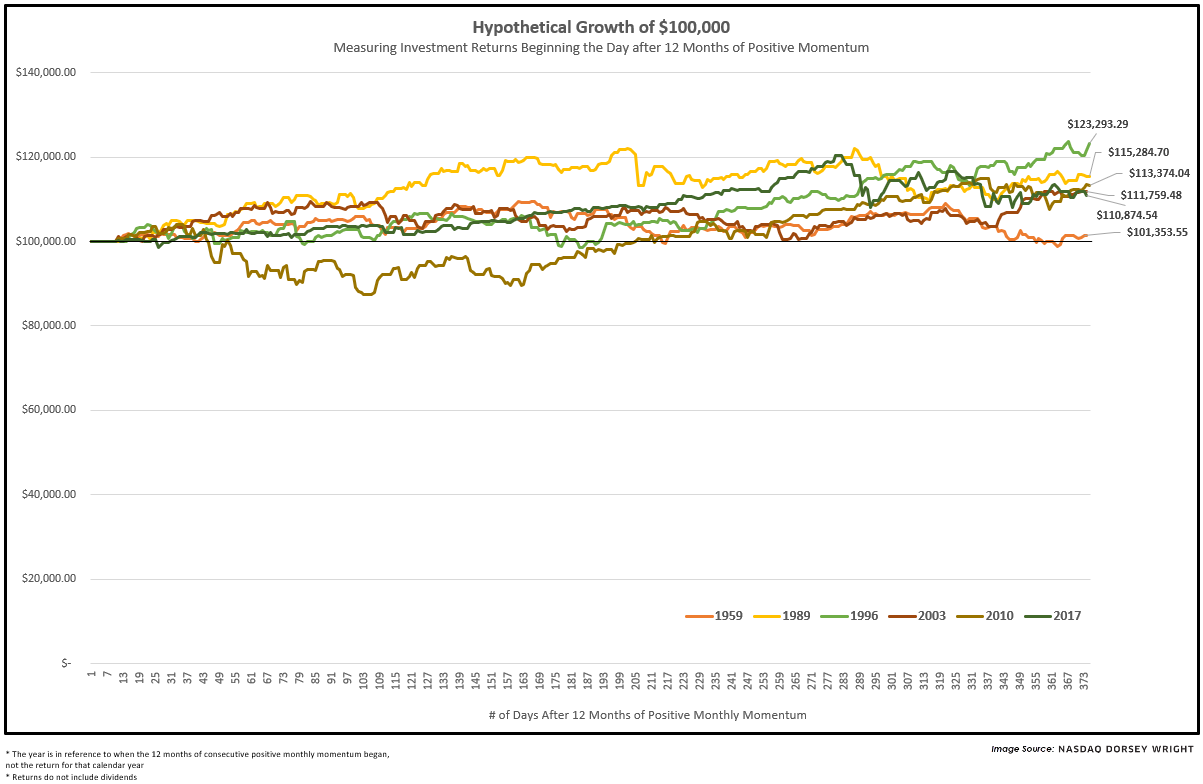
As we inch towards the end of June, we find the S&P 500 (SPX) in strong field position – holding on to a double-digit return and avoiding a material drawdown in the first half of the year. In addition, and arguably as a result, SPX has now experienced 12 months, or one straight year said otherwise, of positive monthly momentum for just the seventh time ever since 1957. Although a rarity, this has not historically led to or indicated meltdowns in the months and year ahead for the index; in fact, all of the past six instances led to positive returns for the S&P 500 in the following year. The longest run of positive monthly momentum on record ended in October of 1989 after 18 consecutive months.


The second quarter of 2021 has seen volatility in the core domestic equity market continue to decline, even as movement underneath the hood has remained elevated. One of the most frequently used ways to measure the volatility of domestic equities is through the CBOE SPX Volatility Index VIX, which moved back to a negative trend last week in its descent to a near-term low of $14.50, the lowest level we have seen for the index since before the pandemic began. As we touched on last Friday, the index did reverse up from this level but continues to remain in a low field position relative to the past few months, having made a series of lower highs since February of this year. Another way to measure market volatility is through the number of extreme daily moves for the S&P 500 Index SPX, which we define as a daily gain or loss of at least 1% in our SPX Volatility Study. This study measures the number of extreme days for the core market benchmark and how that count relates to prior timeframes.
Last year saw an outsized number of extreme daily moves for SPX at a count of 111, significantly more than the 66-day average and the highest number of extreme days in a calendar year since 2009. Most of those days came early last year, as 68 daily moves were exceeded 1% in the first half of 2020. As we transitioned into 2021, we saw 18 extreme days in the first quarter, which was not nearly as many as 2020 but still higher than the average count at roughly 16 days. The second quarter has seen a continued reduction in the number of extreme days, as we sit at a count of just 11 days through movement on June 25, leaving us at 29 volatile days at this point in the first half of the year. While there are still technically 2 trading days in the first half of 2021 following movement Monday, we are currently below the average number of extreme days in the first six calendar months, which is roughly 33 days.
This theme is continued if we look at the number of daily gains or losses exceeding 2% for SPX, which climbed to a count of 45 days in 2020, 39 of which came in the first half of that year. We now sit at only 4 such days so far in 2021, which is lower than the average number of 2% daily moves at just over 7 days since our test began in April 1987.

This data certainly plays well with the movement seen in volatility indices such as the VIX, with large spikes last year being followed by subsequently declining volatility readings over the past six months. However, that is not to say that we have been immune to significant market moves this year. The continued rotation among sectors, sizes, and styles in domestic equity markets has made the level of volatility certainly feel much more elevated than the broad market readings portray. One of the most important relationships to monitor this year has been the ongoing battle between growth and value. The value camp has been one of the market leaders from a performance standpoint throughout much of the recovery rally, after having previously been out of favor for most of the past several years. Growth names encountered substantial headwinds with the sell-off in technology names during the first quarter but have demonstrated improvement over the past few weeks as the technology sector shows resilience. The back-and-forth movement for these two style classifications has also led to increased volatility readings for these breakdowns of the domestic equity market. This can be seen by applying the extreme daily moves approach toward representatives for growth (RPG) and value (RPV), to determine just how much the two areas have moved around relative to the broader market. For this test, we are limited to data from July 3, 1995, through June 25, 2021.
Interestingly enough, both RPV and RPG have had 51 daily moves of at least 1% so far this year, which is far more than the SPX count of 29. The value representative typically shows lower extreme movement in the first half, with an average count of just over 37 days, while the growth representative sees an average of just over 45 daily moves of 1% or more in the first half of a calendar year. These readings are each substantially lower than the numbers seen in the first half of 2020, with RPV and RPG seeing respective extreme daily move counts of 89 and 74 days over the first six months of last year.
While the actual count of extreme moves for each fund is the same at this point in the year, one would not expect the actual moves to occur at the same time. By looking at the quarter-by-quarter breakdown of 1% days for RPV and RPG, we can see that RPV has been relatively consistent from a volatility perspective, with 27 extreme days in the first quarter and 24 extreme days in the second quarter. Each of these quarterly counts was above the quarterly averages. On the other hand, RPG saw 33 extreme days in the first quarter which was higher than average, and only 18 in the second quarter, which was below average.

While each of the prior market environments examined had its own unique set of circumstances surrounding the movement between value and growth names, it is important to be aware of how the current environment relates to those timeframes. It is also important to note how the value and growth representatives performed during periods of enhanced or reduced volatility and how the two representatives behaved after such occurrences. Interestingly enough, RPV only saw its count of extreme days in the second quarter be higher than the average during 9 out of the 27 years examined. The value fund posted an average gain of 6.58% during those years, which was the highest average return for any quarter that saw more than 18 extreme days. We were slightly below that performance over the past three months, as RPV sits at a quarterly gain of 5.85% through last Friday. Interestingly enough, the average forward return for the third quarter following those 9 instances arrives at a gain of 8.99%. While we will have to wait and see how the next three months play out, this does provide a positive indication for the value camp over the next few months.
As previously mentioned, the growth fund saw its extreme day count fall below the quarterly average over the past three months. This happened in the second quarter for 15 out of the 27 years examined for RPG, producing an average second-quarter return of 2.87% in those years. The return over the past three months has been substantially higher, coming in at a gain of 10.14%. In looking at the forward third-quarter returns from those 15 instances, we actually see an average loss for RPG of -0.69%. Again, this does not necessarily mean that we should expect RPG to decline in the next three months, but it does point toward the potential for more muted returns for growth names following a period of more muted movement.
Average Level
20.13
| AGG | iShares US Core Bond ETF |
| USO | United States Oil Fund |
| DIA | SPDR Dow Jones Industrial Average ETF |
| DVY | iShares Dow Jones Select Dividend Index ETF |
| DX/Y | NYCE U.S.Dollar Index Spot |
| EFA | iShares MSCI EAFE ETF |
| FXE | Invesco CurrencyShares Euro Trust |
| GLD | SPDR Gold Trust |
| GSG | iShares S&P GSCI Commodity-Indexed Trust |
| HYG | iShares iBoxx $ High Yield Corporate Bond ETF |
| ICF | iShares Cohen & Steers Realty ETF |
| IEF | iShares Barclays 7-10 Yr. Tres. Bond ETF |
| LQD | iShares iBoxx $ Investment Grade Corp. Bond ETF |
| IJH | iShares S&P 400 MidCap Index Fund |
| ONEQ | Fidelity Nasdaq Composite Index Track |
| QQQ | Invesco QQQ Trust |
| RSP | Invesco S&P 500 Equal Weight ETF |
| IWM | iShares Russell 2000 Index ETF |
| SHY | iShares Barclays 1-3 Year Tres. Bond ETF |
| IJR | iShares S&P 600 SmallCap Index Fund |
| SPY | SPDR S&P 500 Index ETF Trust |
| TLT | iShares Barclays 20+ Year Treasury Bond ETF |
| GCC | WisdomTree Continuous Commodity Index Fund |
| VOOG | Vanguard S&P 500 Growth ETF |
| VOOV | Vanguard S&P 500 Value ETF |
| EEM | iShares MSCI Emerging Markets ETF |
| XLG | Invesco S&P 500 Top 50 ETF |

| Symbol | Company | Sector | Current Price | Action Price | Target | Stop | Notes |
|---|---|---|---|---|---|---|---|
| GTES | Gates Industrial Corporation plc | Business Products | $18.01 | high 10s | 22 | 14 | 4 for 5'er, top 1/3 of business products sector RS matrix, bullish triangle, multi-year highs, consec buys |
| GRMN | Garmin Ltd. | Electronics | $144.37 | high 130s to high 140s | 177 | 116 | 5 for 5'er, 5 consec buy signals, double top at ATH,LT market RS buy signal |
| ASML | Asm Lithograpghy HLDG NV (Netherlands) ADR | Semiconductors | $686.21 | mid-to-upper 600s | 856 | 592 | 5 for 5'er, top 10% of SEMI sector matrix, LT pos mkt RS, R-R>2.0 |
| GFL | GFL Environmental Inc | Waste Management | $32.00 | low to upper 30s | 38 | 26 | 5 for 5'er, 5 consec buy signals, pullback from ATH |
| AKR | Acadia Realty Trust | Real Estate | $22.16 | 20 - 22 | 28 | 18 | 4 for 5'er, #6 of 154 in REAL sector matrix, one box from RS buy signal, 2.7% yield |
| CAL | Caleres Inc. | Textiles/Apparel | $27.92 | mid to upper 20s | 32 | 23 | 5 for 5'er, 6 consec buy signals, multi-year high, top 10% of DWATEXT |
| SPR | Spirit Aerosystems Holdings Inc. | Aerospace Airline | $49.80 | high 40s - low 50s | 78 | 40 | 4 for 5'er, top third of AERO sector matrix, bearish signal reversal, R-R>2.5 |
| FHN | First Horizon Corp. | Banks | $17.86 | high 10s | 25.5 | 15.5 | 4 for 5'er, 4 consec buy signals, at multi-year highs, top 15% of DWABANK matrix, 3.28% yield |
| MGM | MGM Resorts International | Gaming | $43.89 | low-to-mid 40s | 59 | 34 | 4 for 5'er, top half of GAME sector matrix, quad top breakout, R-R>2.0 |
| MSFT | Microsoft Corporation | Software | $265.02 | 250s - mid 260s | 288 | 208 | 4 for 5'er, top half of SOFT sector matrix, multiple buy signals, LT pos trend and mkt RS, 0.9% yield |
| STOR | Store Capital Corp. | Real Estate | $35.53 | mid-to-upper 30s | 47.50 | 30 | 5 for 5'er, multiple buy signals, one box from 52-week high, 4.1% yield, R-R>2.0 |
| OLN | Olin Corp | Chemicals | $46.66 | hi 40s - low 50s | 66 | 38 | 5 for 5'er, #2 of 55 names in chemicals sector matrix, triple top breakout, pullback from ATH, 1.75% yield. |
| WHD | Cactus, Inc. Class A | Oil Service | $38.56 | hi 30s - low 40s | 51.50 | 32 | 5 for 5'er, #2 of 29 in favored OILS sector matrix, bullish triangle, pullback from ATH |
| RVNC | Revance Therapeutics, Inc | Biomedics/Genetics | $30.82 | hi 20s - low 30s | 40 | 26 | 4 for 5'er, top 25% of BIOM sector matrix, quad top breakout, positive trend change, pos monthly mom flip |
| NDLS | Noodles & Company | Restaurants | $12.74 | 11.50 - 13.50 | 20 | 10 | 5 for 5'er, #1 of 28 in REST sector matrix, triple top, pullback to mid of trading band, R-R>2.5 |
| Symbol | Company | Sector | Current Price | Action Price | Target | Stop | Notes |
|---|---|---|---|---|---|---|---|
| AVNS | Avanos Medical, Inc. | Healthcare | $38.83 | low 40s - upper 30s | 35 | 47 | 0 for 5'er, negative trend, 3 consecutive sell signals, bottom 25% of DWAHEAL, negative monthly momentum |
| OPEN | Opendoor Technologies Inc. | Wall Street | $17.11 | low to mid 10s | 2 | 19.50 | 0 for 5'er, 4 consecutive sell signals, negative trend, bottom of DWAWALL matrix, negative monthly momentum |
| Comment | |||||||
|---|---|---|---|---|---|---|---|
|
|
|||||||
NDLS Noodles & Company R ($12.05) - Restaurants - NDLS is a 5 for 5'er that ranks first out of 28 names in the restaurants sector matrix. In trading earlier this month, NDLS broke a triple top at $13 and continued higher, to $13.50, taking out resistance that had been in place since 2018. In Monday's trading, the stock reversed down to the middle of its trading, offering an entry point for long exposure. Positions may be added in the $11.50 - $13.50 range and we will set our initial stop at $10, the first potential sell signal on NDLS's default chart. We will use the bullish price objective, $20, as our target price, giving us a reward-to-risk ratio in excess of 2.5.
| 17 | 18 | 19 | 20 | 21 | ||||||||||||||||||||||||||||||||||||||||||||||||||
| 13.50 | X | X | • | • | X | 13.50 | ||||||||||||||||||||||||||||||||||||||||||||||||
| 13.00 | X | O | 3 | O | • | X | X | • | 6 | o | 13.00 | |||||||||||||||||||||||||||||||||||||||||||
| 12.50 | 2 | O | X | O | • | X | O | X | X | O | • | X | 5 | X | o | 12.50 | ||||||||||||||||||||||||||||||||||||||
| 12.00 | X | O | X | O | • | X | O | X | O | X | O | • | X | O | X | O | X | o | Mid | 12.00 | ||||||||||||||||||||||||||||||||||
| 11.50 | X | O | O | • | X | 7 | 8 | O | X | O | • | X | X | O | X | O | X | 11.50 | ||||||||||||||||||||||||||||||||||||
| 11.00 | X | 4 | • | X | O | X | A | X | O | • | X | O | X | O | X | O | X | 11.00 | ||||||||||||||||||||||||||||||||||||
| 10.50 | X | O | X | O | X | O | O | • | 3 | O | X | O | X | O | 10.50 | |||||||||||||||||||||||||||||||||||||||
| 10.00 | X | 5 | 6 | O | O | • | X | O | 4 | X | 10.00 | |||||||||||||||||||||||||||||||||||||||||||
| 9.50 | O | X | O | • | • | 2 | O | 9.50 | ||||||||||||||||||||||||||||||||||||||||||||||
| 9.00 | 7 | X | O | X | X | • | X | • | X | 1 | 9.00 | |||||||||||||||||||||||||||||||||||||||||||
| 8.50 | O | 5 | B | X | O | 7 | X | O | X | O | • | X | O | A | C | • | Bot | 8.50 | ||||||||||||||||||||||||||||||||||||
| 8.00 | O | X | O | 2 | X | O | X | O | X | O | X | O | • | X | O | X | O | B | • | 8.00 | ||||||||||||||||||||||||||||||||||
| 7.50 | O | X | C | X | O | 5 | O | X | O | 2 | O | 3 | • | 8 | 9 | X | O | X | • | 7.50 | ||||||||||||||||||||||||||||||||||
| 7.00 | 8 | 3 | O | X | O | X | 6 | 8 | X | O | • | X | 7 | O | O | X | • | 7.00 | ||||||||||||||||||||||||||||||||||||
| 6.50 | O | 2 | O | 3 | X | O | 1 | O | X | 6 | O | X | O | • | 6.50 | |||||||||||||||||||||||||||||||||||||||
| 6.00 | 9 | 4 | 1 | • | 4 | O | X | O | X | O | X | O | X | • | 6.00 | |||||||||||||||||||||||||||||||||||||||
| 5.50 | O | X | O | C | • | O | B | O | X | X | O | X | O | • | 5.50 | |||||||||||||||||||||||||||||||||||||||
| 5.00 | O | B | X | X | O | X | X | • | A | X | O | X | O | X | 5 | X | • | 5.00 | ||||||||||||||||||||||||||||||||||||
| 4.75 | O | X | O | C | O | X | X | 5 | X | O | A | X | • | O | X | O | X | O | X | O | X | • | 4.75 | |||||||||||||||||||||||||||||||
| 4.50 | A | X | O | X | O | X | O | X | O | X | X | O | X | O | X | • | O | O | X | O | X | O | X | • | 4.50 | |||||||||||||||||||||||||||||
| 4.25 | O | O | X | O | X | O | X | 6 | 7 | O | 9 | O | X | O | X | • | O | X | 4 | X | O | • | 4.25 | |||||||||||||||||||||||||||||||
| 4.00 | O | X | 1 | 2 | X | O | X | O | X | O | • | B | • | O | X | O | X | • | 4.00 | |||||||||||||||||||||||||||||||||||
| 3.75 | O | O | X | O | X | O | X | • | • | O | X | O | X | • | 3.75 | |||||||||||||||||||||||||||||||||||||||
| 3.50 | 3 | X | O | • | 8 | • | O | O | X | • | 3.50 | |||||||||||||||||||||||||||||||||||||||||||
| 3.25 | O | • | • | • | O | • | 3.25 | |||||||||||||||||||||||||||||||||||||||||||||||
| 17 | 18 | 19 | 20 | 21 |
| ADI Analog Devices, Inc. ($170.57) - Semiconductors - Shares of ADI moved higher Monday to break a double top at $170, marking a new all-time high. This 3 for 5'er moved to a positive trend last month and ranks in the top half of the semiconductors sector RS matrix. The stock has also been on an RS buy signal since late-2016. The overall weight of the evidence is positive here. Exposure may be considered on this breakout, with initial support offered at $162. |
| BRKR Bruker Corporation ($75.76) - Healthcare - BRKR shares moved higher today to break a double top at $76 to mark its second consecutive buy signal and reach a new all-time high. This 4 for 5'er has been in a positive trend since November and on an RS buy signal versus the market since February of 2016. BRKR is actionable at current levels with a weekly overbought/oversold reading of 47%. From here, support is offered at $71. |
| CPK Chesapeake Utilities Corporation ($122.34) - Gas Utilities - CPK broke a double top at $124 for a third consecutive buy signal. The stock is a 5 for 5'er that just had monthly momentum flip positive. The stock is also accompanied by a current yield of roughly 1.6%. Okay to consider here on the breakout or on a pullback to $118 on the chart. Initial support lies at $114, while longer-term support lies at $100, the January low. |
| CSTL Castle Biosciences, Inc. ($76.71) - Biomedics/Genetics - CSTL shares moved higher today to break a second consecutive tripe top to mark its third consecutive buy signal. This 4 for 5'er has been in a positive trend since June and on an RS buy signal versus the market since December of 2019. CSTL is actionable at current levels with a weekly overbought/oversold reading of 37%. From here, support is offered at $72 |
| EXPE Expedia Group Inc. ($163.17) - Leisure - EXPE broke a spread triple bottom at $160 for a second consecutive sell signal and a violation of the bullish support line. EXPE will now become a 4 for 5'er in a negative trend. Long-term holders may seek to trim here, while short-term holders may seek to step away here upon the support line violation. From here, support lies in the $154 to $156. |
| FMC FMC Corporation ($110.09) - Chemicals - FMC gave an initial sell signal in Monday's trading when it broke a double bottom in Monday's trading. The overall picture for FMC remains positive as it is a 3 for 5'er that has been on a market RS buy signal since 2019 and is trading in a positive trend. The stock currently sits three boxes above its bullish support line at $104; while further support can be found at $99. |
| LYB LyondellBasell Industries NV ($101.69) - Chemicals - LYB broke a spread triple bottom at $100 in Monday's trading, taking out resistance that had been place since April. The stock now sits against support at $100 and one box above it its bullish support at $99; a move below these levels would cause additional deterioration in LYB's technical picture. Overall, the picture is mixed, LYB is unfavorable 2 for 5'er, but ranks in the top half of the chemicals sectors matrix; the stock's yield of 4.4% is also in its favor. |
| WYNN Wynn Resorts, Limited ($120.45) - Gaming - WYNN broke a quintuple bottom at $120 to return to a sell signal. WYNN is a 4 for 5'er that is testing support at $120. Support also lies at $118, while the bullish support line lies at $110. Long-term holders may seek to trim upon a move to $116. |
| ZBRA Zebra Technologies Corp ($527.13) - Electronics - ZBRA rose Monday to break a spread quadruple top at $520 before reaching a new all-time high at $528 intraday. This 5 for 5'er moved to a positive trend in April of last year and ranks in the top third of the electronics sector RS matrix. Weekly momentum also recently flipped positive, suggesting the potential for further upside from here. The technical picture remains sound and continues to improve. Those looking to add exposure may consider the stock on this breakout, with initial support offered at $488. Further support can be found at $456. |

| Name | Option Symbol | Action | Stop Loss |
|---|---|---|---|
| Centene Corporation - $74.30 | O: 21L72.50D17 | Buy the December 72.50 calls at 7.20 | 67.00 |
| Name | Option | Action |
|---|---|---|
| Microsoft Corporation ( MSFT) | Sep. 250.00 Calls | Raise the option stop loss to 20.60 (CP: 22.60) |
| Applied Materials, Inc. ( AMAT) | Oct. 135.00 Calls | Initiate an option stop loss of 11.90 (CP: 13.90) |
| Name | Option Symbol | Action | Stop Loss |
|---|---|---|---|
| Penn National Gaming Inc - $75.61 | O: 21V80.00D15 | Buy the October 80.00 puts at 12.10 | 80.00 |
| Name | Option | Action |
|---|---|---|
| Las Vegas Sands Corp. (LVS) | Sep. 60.00 Puts | Raise the option stop loss to 7.60 (CP: 9.60) |
| Sunpower Corporation (SPWR) | Sep. 29.00 Puts | Stopped at 30.00 (CP: 30.54) |
| Las Vegas Sands Corp. (LVS) | Sep. 60.00 Puts | Raise the option stop loss to 7.60 (CP: 9.60) |
| Magnite Inc (MGNI) | Sep. 35.00 Puts | Stopped at 37.00 (CP: 36.76) |
| Canadian Solar Inc. (CSIQ) | Sep. 40.00 Puts | Stopped at 42.00 (CP: 45.47) |
| Name | Option Sym. | Call to Sell | Call Price | Investment for 500 Shares | Annual Called Rtn. | Annual Static Rtn. | Downside Protection |
|---|---|---|---|---|---|---|---|
| Marathon Oil Corporation $14.07 | O: 21I14.00D17 | Sep. 14.00 | 1.03 | $6,252.10 | 49.08% | 31.92% | 6.62% |
| Name | Action |
|---|---|
| The Gap, Inc. (GPS) - 33.99 | Sell the September 38.00 Calls. |
| International Game Technology (IGT) - 23.73 | Sell the October 25.00 Calls. |
| Timkensteel Corp. (TMST) - 14.55 | Sell the August 15.00 Calls. |
| The Gap, Inc. (GPS) - 33.99 | Sell the September 33.00 Calls. |
| Caesars Entertainment Inc. (CZR) - 102.43 | Sell the September 110.00 Calls. |
| Tanger Factory Outlet Centers (SKT) - 18.87 | Sell the September 20.00 Calls. |
| Himax Technologies, Inc. ADR (Taiwan) (HIMX) - 14.14 | Sell the September 16.00 Calls. |
| Devon Energy Corporation (DVN) - 29.76 | Sell the October 30.00 Calls. |
| Hawaiian Holdings, Inc. (HA) - 26.75 | Sell the October 28.00 Calls. |
| Allegheny Technologies, Inc. (ATI) - 21.02 | Sell the October 22.50 Calls. |
| Cleveland-Cliffs Inc. (CLF) - 21.20 | Sell the October 22.00 Calls. |
| Olin Corp (OLN) - 46.66 | Sell the August 47.00 Calls. |
| Name | Covered Write |
|---|---|
| Norwegian Cruise Line Holdings Ltd. ( NCLH - 31.03 ) | August 32.50 covered write. |
Daily Equity & Market Analysis
LISTEN TO PODCAST
Apr 02, 2026
Loading, Please Wait...
