
Most Requested Symbols

We provide some background on equity swaps between hedge funds and banks in light of the recent deterioration in some individual stocks.
The common wisdom says precious metals do well during periods of inflation and thus the current environment should be favorable for gold and silver. However, we need only to look at the charts GLD and SLV to see that that has not been the case. As with other recent situations in the market, Treasury yields may be a major factor as to why that is.
The average distribution reading is -1.68% oversold.
Today's featured stock is Brighthouse Financial Inc. (BHF)
AGYS, APTV, CAR, CRWD, DLTH, DOMO, DXC, FDS, FDX, TRMB & ZM
Call: Delta Air Lines (DAL), Put: Wheaton Precious Metals (WPM), Covered Write: Nordstrom (JWN)

Join Nasdaq Dorsey Wright for a look into the Model Builder, which allows you to customize, backtest, and easily implement models driven by Nasdaq Dorsey Wright’s Relative Strength Matrix. It also allows you to view detailed performance, risk, and allocation information to give you a deeper understanding of and confidence in your models. In this four-part webinar series, we will take you through each of the three types of models you are currently able to create in Model Builder as well as how to generate and customize a fact sheet for your model. Each webinar will take place on Thursdays at 1 pm ET. Click Here to Register.
• Session 2 (4/1) – Custom Matrix Models
• Session 3 (4/8) – Custom FSM Models
• Session 4 (4/15) – Content Manager: Custom Model Fact Sheets
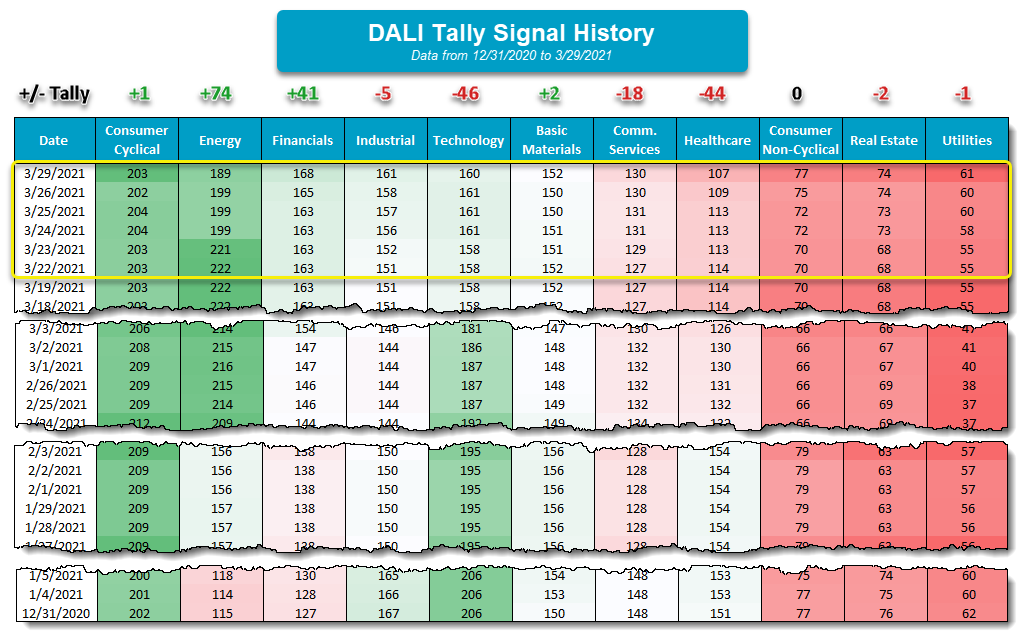
Over the past week, we have seen several changes to the sector rankings within the Dorsey Wright DALI tool. We wanted to briefly touch on some of these changes in ranking and discuss where signals may have moved. See the bullet points below.

source: etf.com
There has been extreme volatility in some individual stocks over the past few days, with companies such as Viacom VIAC dropping from a chart level of $100 to $40 last week. As you may know, this was largely attributed to trading activity from the offshore hedge fund Archegos, which had gained leveraged exposure toward various stocks through contracts known as total return equity swaps. While this does not have much of an effect on our technical research right now, we felt it was an especially interesting market event and may certainly warrant questions from clients, especially for those holding any of the securities that have been affected. Therefore, we wanted to provide some broad background on total return equity swaps and how they led to such massive price deteriorations.
These contracts are very similar to a contract for difference (CFD), which is defined as a financial derivative trade that has the difference in the opening and closing of that trade settled in cash, without the transaction of any actual securities or shares of stock (source: investopedia.com). CFDs also use leveraged exposure, allowing the investor to gain a large position in a particular stock while only being required to provide enough capital for a fraction of that investment. CFDs are illegal in the U.S., however, equity swaps are not. Although similar to CFDs, an equity swap contract between an investor and a bank has a defined timeframe, while a CFD does not.
These swaps are significant as they allow hedge funds to take large positions in securities without having that position actually reported. As an example, say a hedge fund wants to go long XYZ stock for $200 million. They can enter into an equity swap with a bank to gain leveraged exposure, which may only require a $5 million investment to be put upfront. The hypothetical equity swap contract states that the hedge fund is long $200 million initial investment in XYZ at $100 a share for three months. If the share price moves higher over the next three months, the hedge fund gets paid the profit. If the share price moves lower over the next three months, the hedge fund has to pay the bank for the loss at the end of the three months. This can occur without anyone other than the hedge fund or bank knowing, which also allows the hedge fund to enter into the same contract with multiple banks.
This occurred with Archegos, as they had multiple equity swaps on the same companies spread out across various banks. As long as the share price went up, they were paid for their exposure, but when the share price of some of their positions went down, the banks then called on Archegos to pay for their losses on heavily leveraged positions. When they were unable to cover their losses, the banks were forced to liquidate all of the hedge fund’s exposure through block trades, causing the massive sell-off in some individual stocks over the past week. Unfortunately for most investors, they were not aware of the actual monetary exposure behind these securities until it was too late.
While many broad market indices have seen declines in the past few days, significant drawdowns have been generally limited to those names actually involved in the Archegos equity swaps. However, this is the second time in 2021 that we have seen the unraveling of heavily leveraged positions from hedge funds affect the broader market, and we are only in the first quarter of the year. This will certainly be important to monitor for further developments or regulation adjustments moving forward.

In general, we have been in a favorable environment for commodities over the last year - rebounding economic activity has resulted in rising prices for energy, industrial materials, and other production inputs. As a result, the iShares S&P GSCI Commodity-Indexed Trust GSG has gained 47.45% over the trailing 12-months and 14.92% year-to-date (through 3/29) and commodities reached number two in the DALI asset class rankings for the first time since 2016 (although it has recently fallen to third amid the volatility in the energy market).
Precious metals participated in the general strength of commodities in mid-to-late 2020 – the SPDR Gold Trust GLD gained 19.64% from 3/31/20 – 9/30/20, while the iShares Silver Trust SLV was up nearly 66% over the same period. However, this trend has not continued. While broad commodities are up nearly 15% in 2021, GLD is down by -10.12% and SLV is down by -6.76%. On its default chart, GLD has given three consecutive sell signals since September, violated its bullish support line earlier this month, and currently sits one box away from breaking a spread quadruple bottom, which would take out support that has been in place since May of last year. The fund now has an unfavorable 1.28 fund score and negative -1.97 score direction. While SLV has held up better than GLD, it too shows negative action on its chart. The fund fell to a sell signal in early March and took out a second level of support in Tuesday’s trading when it hit $22.50; SLV now sports an unfavorable 2.85 fund score and a negative -2.83 score direction.
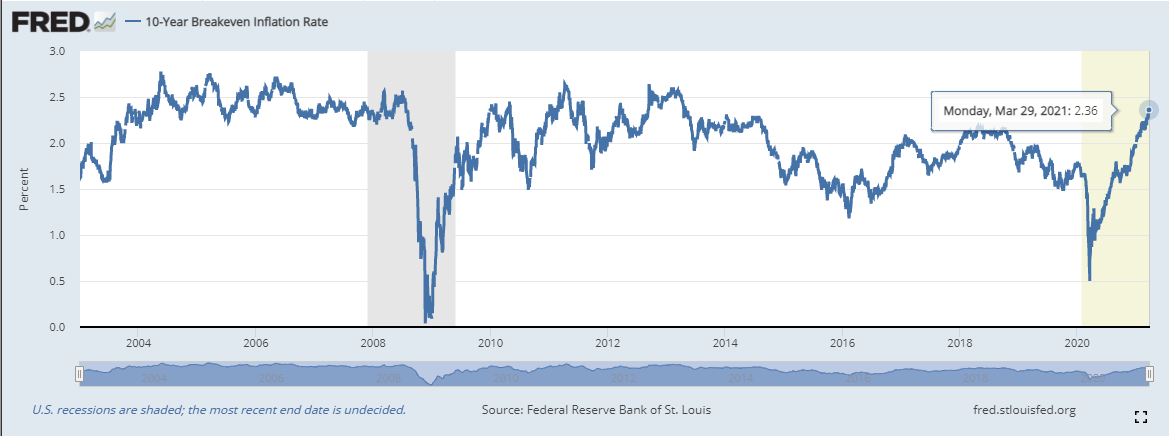
The weakness of precious metals comes against the backdrop of expansionary fiscal policy – the President signed a $1.9 trillion COVID relief package earlier this month, including $1,400 individual direct payments, which followed a smaller package that went into effect in late December. Meanwhile, there is now talk about an infrastructure package, estimated at $3 trillion. This increased government spending, with the possibility of more to come, should theoretically put upward pressure on inflation, especially when coupled with the accommodative monetary policy currently in place. And inflation expectations have increased – the 10YR breakeven inflation rate, which is a measure of expected inflation derived from the 10-year Treasury and 10-year TIPS, currently sits at 2.36%, which is its highest level since 2014.
The common wisdom says precious metals do well during periods of inflation and thus the current environment should be favorable for gold and silver. However, we need only to look at the charts GLD and SLV to see that that has not been the case. As with other recent situations in the market, Treasury yields may be a major factor as to why that is.
Inflation benefits borrowers (bond issuers) and hurts lenders (bond investors) because lenders are paid back in the currency that is worth less than when they lent it. Thus, to gauge an investor’s actual economic return, we need to look at the real yield, which is simply nominal yield less inflation. As inflation goes up, real yields go down, making bonds less attractive and by extension making other stores of wealth, especially those with values that tend to increase with inflation, more attractive. Of course, the reverse is also true, when real yields increase, it makes bonds more attractive relative to assets that don’t produce any income. As a result, there tends to be an inverse relationship between precious metals prices and real yields. The graphs below show the prices of GLD and SLV (left Y-axis) and the 10-year US Treasury real yield, as measured by US Treasury Inflation-Indexed Securities (TIPS) (right axis).
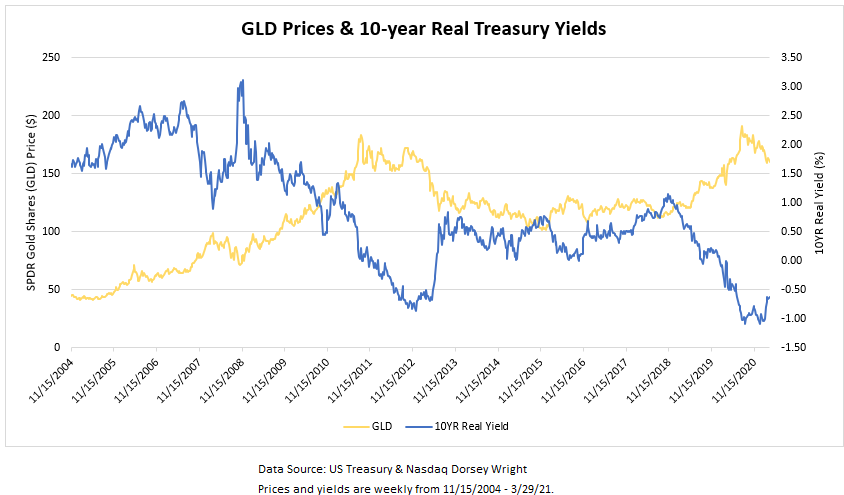
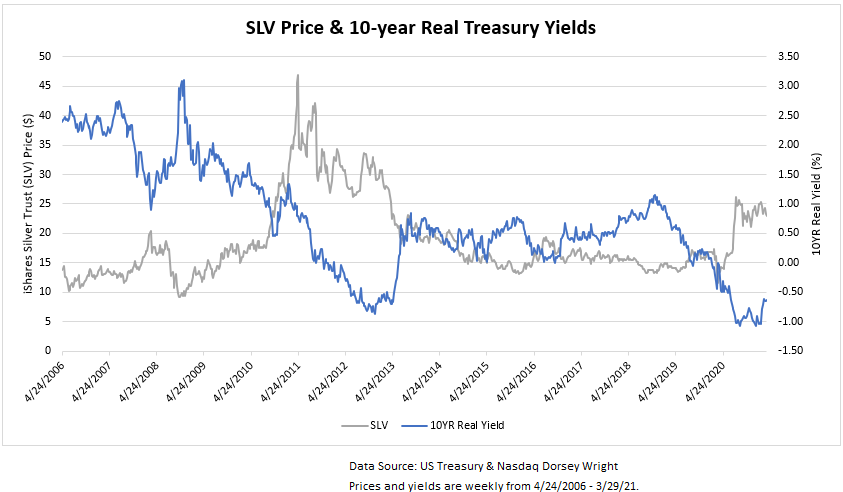
As the graph shows, real yields were falling throughout most of 2020; they fell to a low of around -1.08% in August, with GLD and SLV hitting multi-year highs around the same time. The 10-year real yield once again fell below -1% in January/February, with GLD and SLV strengthening somewhat (SLV more than GLD) during this period, although neither was able to reach their August high. So while there have been increased expectations for inflation with additional fiscal stimulus, which we would expect to be supportive of high commodity prices, the rise in nominal Treasury yields over the last few months nominal Treasury yields have pulled up real yields by extension, which has been a headwind for precious metals prices.
DWS Changes: DWSGLOBAL.TR & DWSALLWORLDEXUS.TR
The Xtrackers MSCI All China Equity ETF TR CN.TR fell sufficiently out of favor in the Xtrackers Global Dynamic FX Hedged Model DWSGLOBAL matrix. As a result, it was removed and, in its place, the Xtrackers MSCI Emerging Markets ESG Leaders Equity ETF TR EMSG.TR was added as it was the highest-ranked fund not currently held in the model. The model holdings are shown in the image below and have each been rebalanced to equal weight at 20% each... (Read more)
First Trust: FTSIZESTYLE Change
In the First Trust Fixed Income Model the First Trust SSI Strategic Convertible Securities ETF FCVT is being removed after having been a member of the model since April 2020, over which time FCVT is up more than 65% while the Core Bond ETF AGG is actually down a little over 2% over that time period. Nonetheless, FCVT has fallen in it’s relative strength rankings down to the bottom of the matrix. As a result, FCVT is being removed from the Fixed Income Model and is being replaced with the First Trust Senior Loan Fund FTSL, which is joining Preferreds FPE, High Yield HYLS, and Emerging Market Bonds FEMB as the four holdings of the Model. FTSL has a positive technical picture with a score above 3, and has a yield of 3.33%, which is more than twice the yield of FCVT. The Fixed Income Model is up 0.3% so far this year compared to -3.5% return for the Cored Bond ETF AGG and the Model is up more than 37% over the past year versus 5.5% for AGG... (Read more)
Invesco Special Opportunities Change: Sell CQQQ, Buy RYJ
There is a change to the Invesco Special Opportunities Model GUGGSO this week. Sell the Invesco China Technology ETF CQQQ and buy the Invesco Raymond James SB-1 Equity ETF RYJ. CQQQ was removed because its rank in the model’s relative strength matrix fell below the threshold to remain a holding in the model. In place of CQQQ, the model added RYJ as it was the highest-ranking fund in the matrix that was not already a holding in the portfolio. This is the fourth change to the model this year... (Read more)

Average Level
-1.68
| AGG | iShares US Core Bond ETF |
| USO | United States Oil Fund |
| DIA | SPDR Dow Jones Industrial Average ETF |
| DVY | iShares Dow Jones Select Dividend Index ETF |
| DX/Y | NYCE U.S.Dollar Index Spot |
| EFA | iShares MSCI EAFE ETF |
| FXE | Invesco CurrencyShares Euro Trust |
| GLD | SPDR Gold Trust |
| GSG | iShares S&P GSCI Commodity-Indexed Trust |
| HYG | iShares iBoxx $ High Yield Corporate Bond ETF |
| ICF | iShares Cohen & Steers Realty ETF |
| IEF | iShares Barclays 7-10 Yr. Tres. Bond ETF |
| LQD | iShares iBoxx $ Investment Grade Corp. Bond ETF |
| IJH | iShares S&P 400 MidCap Index Fund |
| ONEQ | Fidelity Nasdaq Composite Index Track |
| QQQ | Invesco QQQ Trust |
| RSP | Invesco S&P 500 Equal Weight ETF |
| IWM | iShares Russell 2000 Index ETF |
| SHY | iShares Barclays 1-3 Year Tres. Bond ETF |
| IJR | iShares S&P 600 SmallCap Index Fund |
| SPY | SPDR S&P 500 Index ETF Trust |
| TLT | iShares Barclays 20+ Year Treasury Bond ETF |
| GCC | WisdomTree Continuous Commodity Index Fund |
| VOOG | Vanguard S&P 500 Growth ETF |
| VOOV | Vanguard S&P 500 Value ETF |
| EEM | iShares MSCI Emerging Markets ETF |
| XLG | Invesco S&P 500 Top 50 ETF |
| Symbol | Company | Sector | Current Price | Action Price | Target | Stop | Notes |
|---|---|---|---|---|---|---|---|
| MOS | Mosaic Company | Chemicals | $31.30 | 28 - 31 | 54.50 | 25 | 5 for 5'er, #7 of 52 names in favored SEMI sector matrix, multiple buy signals, pullback from multi-year high, R-R>4.0 |
| CHEF | Chefs' Warehouse Holdings, LLC | Food Beverages/Soap | $28.99 | low to mid 30s | 41.50 | 26 | 5 for 5'er, consec buy signals, #1 in DWAFOOD matrix, fav sector |
| PRAH | PRA Health Sciences | Healthcare | $152.04 | 140s - low 150s | 224 | 118 | 4 for 5'er, top 20% of HEAL sector matrix, LT pos mkt RS, pullback from ATH |
| NCR | NCR Corporation | Computers | $36.87 | mid 30s to low 40s | 44 | 31 | 4 for 5'er, pos weekly mom, one box from bullish triangle, consec buy signals, top 25% of DWACOMP |
| ACLS | Axcelis Technoliges, Inc. | Semiconductors | $37.43 | hi 30s - low 40s | 63 | 34 | 4 for 5'er, top third of favored SEMI sector matrix, pullback from multi-year high, pot. cov. write |
| AAL | American Airlines Group Inc. | Aerospace Airline | $22.91 | low 20s | 42 | 18.50 | 4 for 5'er, #5 of 44 in AERO sector matrix, one box from peer RS buy signal, bullish catapult |
| EXPE | Expedia Group Inc. | Leisure | $176.13 | low 170s to mid 180s | 214 | 142 | 5 for 5'er, fav DWALEIS, pullback from ATH, 5 consec buy signals, pos trend |
| DKS | Dick's Sporting Goods, Inc. | Retailing | $75.31 | mid 70s - low 80s | 101 | 66 | 4 for 5'er, top half of RETA sector matrix, bullish catapult, 2% yield, pot. covered write, R-R>2.0 |
| NX | Quanex Building Products Corporation | Building | $25.26 | mid 20s | 38 | 21 | 4 for 5'er, top half of favored BUIL sector matrix, bullish catapult, 1.3% yield |
| BHF | Brighthouse Financial Inc. | Insurance | $42.78 | low to mid 40s | 64 | 35 | healthy 5 for 5'er, top 1/3 of favored DWAINSU sector matrix, consec buy signals, pullback from multi-year high |
| Symbol | Company | Sector | Current Price | Action Price | Target | Stop | Notes |
|---|
| Comment | |||||||
|---|---|---|---|---|---|---|---|
|
|
|||||||
BHF Brighthouse Financial Inc. R ($43.90) - Insurance - BHF is a perfect 5 for 5’er that sits in the top third of the insurance sector RS matrix, making it one of the stronger names in this favored space. BHF has given three consecutive buy signals since January, confirming that demand is in control. This month, BHF printed a new multi-year high when it rallied to $48 which was then followed by a pullback to $41 where the stock tested its bullish support line. With today’s action, BHF bounced off its trendline and reversed up into a column of Xs to $44. Overall, demand is in control and the weight of the evidence is positive. Okay to add new exposure in the low to mid 40s. We will set our initial stop at $35, which would violate multiple levels of support on the chart. We will use BHF’s bullish price objective of $64 as our near-term price target.
| 20 | 21 | |||||||||||||||||||||||||||||||||||||||||||||||||||||
| 48.00 | X | • | X | 48.00 | ||||||||||||||||||||||||||||||||||||||||||||||||||
| 47.00 | X | O | • | X | O | 47.00 | ||||||||||||||||||||||||||||||||||||||||||||||||
| 46.00 | X | O | • | X | O | 46.00 | ||||||||||||||||||||||||||||||||||||||||||||||||
| 45.00 | X | O | • | X | O | 45.00 | ||||||||||||||||||||||||||||||||||||||||||||||||
| 44.00 | X | O | • | X | O | x | 44.00 | |||||||||||||||||||||||||||||||||||||||||||||||
| 43.00 | X | X | O | • | X | X | 3 | X | O | x | 43.00 | |||||||||||||||||||||||||||||||||||||||||||
| 42.00 | X | O | 2 | O | • | X | O | X | X | O | X | O | X | O | x | 42.00 | ||||||||||||||||||||||||||||||||||||||
| 41.00 | O | X | O | X | O | • | X | O | X | O | X | O | X | O | X | O | Mid | 41.00 | ||||||||||||||||||||||||||||||||||||
| 40.00 | O | X | O | X | O | • | X | O | X | O | X | O | O | • | • | 40.00 | ||||||||||||||||||||||||||||||||||||||
| 39.00 | C | X | O | X | O | • | • | X | X | O | 2 | O | • | 39.00 | ||||||||||||||||||||||||||||||||||||||||
| 38.00 | O | • | 1 | • | O | 3 | • | X | • | X | O | X | O | X | • | 38.00 | ||||||||||||||||||||||||||||||||||||||
| 37.00 | • | • | O | X | O | • | X | O | • | X | X | O | 1 | O | X | • | 37.00 | |||||||||||||||||||||||||||||||||||||
| 36.00 | O | X | O | • | X | O | • | X | O | X | O | X | O | • | 36.00 | |||||||||||||||||||||||||||||||||||||||
| 35.00 | O | O | • | X | O | X | • | X | O | X | C | X | • | 35.00 | ||||||||||||||||||||||||||||||||||||||||
| 34.00 | O | • | X | X | O | X | O | • | • | B | O | O | X | • | 34.00 | |||||||||||||||||||||||||||||||||||||||
| 33.00 | O | • | X | O | 6 | O | X | O | X | • | • | X | X | O | • | 33.00 | ||||||||||||||||||||||||||||||||||||||
| 32.00 | O | • | X | X | O | X | O | X | O | X | O | X | • | X | O | X | • | 32.00 | ||||||||||||||||||||||||||||||||||||
| 31.00 | O | X | O | X | O | X | O | X | O | X | O | X | O | X | O | X | • | Bot | 31.00 | |||||||||||||||||||||||||||||||||||
| 30.00 | O | X | O | X | O | O | O | X | X | O | X | O | X | O | X | • | 30.00 | |||||||||||||||||||||||||||||||||||||
| 29.00 | O | X | O | X | O | X | O | X | O | 9 | A | O | • | 29.00 | ||||||||||||||||||||||||||||||||||||||||
| 28.00 | O | X | X | O | X | O | X | O | X | O | X | • | 28.00 | |||||||||||||||||||||||||||||||||||||||||
| 27.00 | O | X | X | X | O | X | X | O | X | O | X | 8 | • | O | X | • | 27.00 | |||||||||||||||||||||||||||||||||||||
| 26.00 | O | X | O | X | O | X | X | O | X | O | X | O | X | 7 | • | O | • | 26.00 | ||||||||||||||||||||||||||||||||||||
| 25.00 | O | X | O | X | O | X | O | X | O | X | O | X | O | X | • | • | 25.00 | |||||||||||||||||||||||||||||||||||||
| 24.00 | O | O | X | O | X | O | X | O | X | 5 | O | • | 24.00 | |||||||||||||||||||||||||||||||||||||||||
| 23.00 | O | X | X | 4 | X | O | O | X | • | 23.00 | ||||||||||||||||||||||||||||||||||||||||||||
| 22.00 | O | X | O | X | O | X | O | X | • | 22.00 | ||||||||||||||||||||||||||||||||||||||||||||
| 21.00 | O | X | O | X | O | X | O | X | • | 21.00 | ||||||||||||||||||||||||||||||||||||||||||||
| 20.00 | O | X | O | X | O | X | O | • | 20.00 | |||||||||||||||||||||||||||||||||||||||||||||
| 19.50 | O | O | X | O | X | • | 19.50 | |||||||||||||||||||||||||||||||||||||||||||||||
| 19.00 | O | X | O | • | 19.00 | |||||||||||||||||||||||||||||||||||||||||||||||||
| 18.50 | O | X | X | • | 18.50 | |||||||||||||||||||||||||||||||||||||||||||||||||
| 18.00 | O | X | O | X | • | 18.00 | ||||||||||||||||||||||||||||||||||||||||||||||||
| 17.50 | O | X | O | X | • | 17.50 | ||||||||||||||||||||||||||||||||||||||||||||||||
| 17.00 | O | X | O | X | • | 17.00 | ||||||||||||||||||||||||||||||||||||||||||||||||
| 16.50 | O | X | O | X | • | 16.50 | ||||||||||||||||||||||||||||||||||||||||||||||||
| 16.00 | O | X | O | X | • | 16.00 | ||||||||||||||||||||||||||||||||||||||||||||||||
| 15.50 | O | X | O | • | 15.50 | |||||||||||||||||||||||||||||||||||||||||||||||||
| 15.00 | O | X | • | 15.00 | ||||||||||||||||||||||||||||||||||||||||||||||||||
| 14.50 | O | X | • | 14.50 | ||||||||||||||||||||||||||||||||||||||||||||||||||
| 14.00 | O | X | • | 14.00 | ||||||||||||||||||||||||||||||||||||||||||||||||||
| 13.50 | O | X | • | 13.50 | ||||||||||||||||||||||||||||||||||||||||||||||||||
| 13.00 | O | X | • | 13.00 | ||||||||||||||||||||||||||||||||||||||||||||||||||
| 12.50 | O | • | 12.50 | |||||||||||||||||||||||||||||||||||||||||||||||||||
| 20 | 21 |
| AGYS Agilysys, Inc. ($46.81) - Computers - AGYS broke a double bottom at $45 for a third consecutive sell signal since the stock's peak earlier this month at $64. Holders of this 3 for 5'er may look to either trim their exposure, either locking in potential long-term profits or as risk management for those who are recent purchasers. From here, support lies at $36. |
| APTV Aptiv PLC ($136.00) - Autos and Parts - APTV is a 5 for 5’er within the autos and parts sector that broke a double bottom at $134, marking the second consecutive sell signal. Although the long-term price remains intact, APTV is showing near-term weakness. No new positions. From here, further support sits at $128. |
| CAR Avis Budget Group, Inc. ($74.77) - Retailing - CAR broke a spread triple top at $71 and rallied to a new high at $74. CAR is a 5 for 5'er that ranks in the top 5 of the Retailing sector matrix. Traders and longer-term holders may look to take profits here. No new positions at this time due to the overbought nature of the stock. From here, support lies at $67 and $63 on the default chart. |
| CRWD CrowdStrike Holdings, Inc. Class A ($175.78) - Software - Following a reversal back into X's the previous day, CRWD reversed back down into O's and fell to break a double bottom at $170. This brings the stock back to support from earlier this month. A move to $168 would violate support and likely mean a potential trim for long-term holders on a possible bounce, and possible stepping away for very short-term holders. A rally above $184 would bring the chart back to a buy signal, while a move to $162 would violate another support level at $164. |
| DLTH Duluth Holdings Inc ($16.77) - Retailing - DLTH is a 4 for 5’er within the retailing sector that broke a double top at $17 with today’s action. This marks the third consecutive buy signal on the chart. From here, support sits at $14.50 while DLTH faces resistance at current levels. |
| DOMO Domo, Inc. Class B ($53.16) - Software - DOMO moved lower Tuesday to break a double bottom at $53, marking a fifth consecutive sell signal. This 2 for 5'er moved to a negative trend last week and ranks in the bottom half of the unfavored software sector RS matrix. Avoid long exposure. Further support may be found at $51, while initial overhead resistance may come at $62. |
| DXC DXC Technology Co ($31.14) - Computers - Shares of DXC reversed up into a column of Xs Tuesday and completed a bullish triangle at $30 before advancing to $31 intraday. This also broke through the bearish resistance line to place the stock back in a positive trend. Now a 3 for 5'er, DXC ranks in the top half of the computers sector RS matrix and saw a recent flip to positive weekly momentum, suggesting the potential for further upside from here. Exposure may be considered on this breakout. Initial support can be found at $26 with further support offered at $25. |
| FDS FactSet Research Systems Inc. ($310.07) - Finance - FDS broke a double bottom at $308, a move that violated the bullish support line. As a result, FDS is now a 2 for 5’er that ranks 68th out of 70 names in the finance sector RS matrix. No new positions here as supply is in control. FDS is testing support at current levels. |
| FDX FedEx Corporation ($285.92) - Aerospace Airline - FDX broke a double top at $284 before rallying up to $288 on the chart. This is the third consecutive buy signal since February on the chart for this 3 for 5'er. Current holders and new positions can be considered here on the breakout. Note that resistance lies at the December high of $304. Near-term support lies in the $260 to $264 range, while additional support can be found at $248. |
| TRMB Trimble Inc. ($76.04) - Telephone - TRMB moved higher Tuesday and broke a double top at $77, matching its all-time high from earlier this month. This 5 for 5'er moved to a positive trend in May of last year and ranks 5th out of 38 stocks in the telephone sector RS matrix. The weight of the evidence is positive here and continues to improve. Initial support can be found at $70, with further support offered at $67 and $66. |
| ZM Zoom Video Communications, Inc. Class A ($312.22) - Telephone - ZM broke a double bottom at $304 on Tuesday, a move that violated the bullish support line. As a result, ZM is now a 1 for 5’er that has given two consecutive sell signals. The technical picture has deteriorated for ZM, which now ranks 37th out of 38 names in the telephone sector RS matrix. Avoid. |
| Name | Option Symbol | Action | Stop Loss |
|---|---|---|---|
| Delta Air Lines Inc. - $48.87 | DAL2118F45 | Buy the June 45.00 calls at 6.20 | 43.00 |
| Name | Option | Action |
|---|---|---|
| Bank of America ( BAC) | Jun. 30.00 Calls | Raise the option stop loss to 7.30 (CP: 9.30) |
| The Kroger Co. ( KR) | Jul. 32.00 Calls | Raise the option stop loss to 4.35 (CP: 6.35) |
| Name | Option Symbol | Action | Stop Loss |
|---|---|---|---|
| Wheaton Precious Metals Corp - $37.51 | WPM2118R40 | Buy the June 40.00 puts at 4.45 | 41.00 |
| Name | Option | Action |
|---|---|---|
| Pan American Silver Corp (PAAS) | Jul. 36.00 Puts | Raise the option stop loss to 6.05 (CP: 8.05) |
| Name | Option Sym. | Call to Sell | Call Price | Investment for 500 Shares | Annual Called Rtn. | Annual Static Rtn. | Downside Protection |
|---|---|---|---|---|---|---|---|
| Nordstrom, Inc. $37.33 | JWN2116G40 | Jul. 40.00 | 3.75 | $17,217.60 | 50.91% | 32.73% | 8.83% |
| Name | Action |
|---|---|
| Alcoa Inc. (AA) - 32.04 | Sell the July 30.00 Calls. |
| Ladder Capital Corp (LADR) - 11.70 | Sell the August 12.50 Calls. |
| MGM Resorts International (MGM) - 37.16 | Sell the June 40.00 Calls. |
| The Gap, Inc. (GPS) - 28.76 | Sell the June 30.00 Calls. |
| Uber Technologies, Inc. (UBER) - 53.35 | Sell the June 55.00 Calls. |
| General Motors (GM) - 55.94 | Sell the June 57.50 Calls. |
| Occidental Petroleum Corporation (OXY) - 27.00 | Sell the August 28.00 Calls. |
| Tanger Factory Outlet Centers (SKT) - 14.89 | Sell the June 17.00 Calls. |
| Navient Corporation (NAVI) - 13.86 | Sell the July 15.00 Calls. |
| Name | Covered Write |
|---|---|
|
|
|
Daily Equity & Market Analysis
NDW MORNING UPDATE
Dec 05, 2025
Loading, Please Wait...
