
The common wisdom says precious metals do well during periods of inflation and thus the current environment should be favorable for gold and silver. However, we need only to look at the charts GLD and SLV to see that that has not been the case. As with other recent situations in the market, Treasury yields may be a major factor as to why that is.
In general, we have been in a favorable environment for commodities over the last year - rebounding economic activity has resulted in rising prices for energy, industrial materials, and other production inputs. As a result, the iShares S&P GSCI Commodity-Indexed Trust GSG has gained 47.45% over the trailing 12-months and 14.92% year-to-date (through 3/29) and commodities reached number two in the DALI asset class rankings for the first time since 2016 (although it has recently fallen to third amid the volatility in the energy market).
Precious metals participated in the general strength of commodities in mid-to-late 2020 – the SPDR Gold Trust GLD gained 19.64% from 3/31/20 – 9/30/20, while the iShares Silver Trust SLV was up nearly 66% over the same period. However, this trend has not continued. While broad commodities are up nearly 15% in 2021, GLD is down by -10.12% and SLV is down by -6.76%. On its default chart, GLD has given three consecutive sell signals since September, violated its bullish support line earlier this month, and currently sits one box away from breaking a spread quadruple bottom, which would take out support that has been in place since May of last year. The fund now has an unfavorable 1.28 fund score and negative -1.97 score direction. While SLV has held up better than GLD, it too shows negative action on its chart. The fund fell to a sell signal in early March and took out a second level of support in Tuesday’s trading when it hit $22.50; SLV now sports an unfavorable 2.85 fund score and a negative -2.83 score direction.
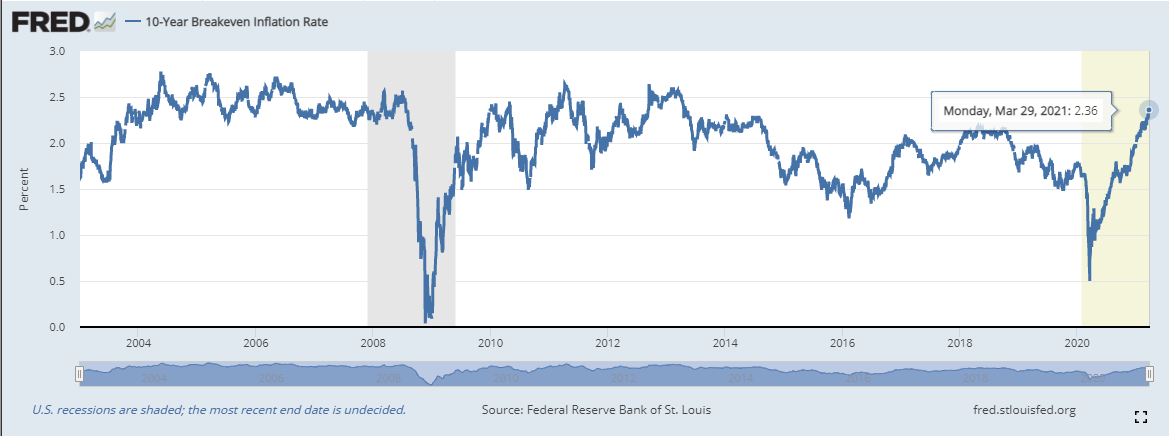
The weakness of precious metals comes against the backdrop of expansionary fiscal policy – the President signed a $1.9 trillion COVID relief package earlier this month, including $1,400 individual direct payments, which followed a smaller package that went into effect in late December. Meanwhile, there is now talk about an infrastructure package, estimated at $3 trillion. This increased government spending, with the possibility of more to come, should theoretically put upward pressure on inflation, especially when coupled with the accommodative monetary policy currently in place. And inflation expectations have increased – the 10YR breakeven inflation rate, which is a measure of expected inflation derived from the 10-year Treasury and 10-year TIPS, currently sits at 2.36%, which is its highest level since 2014.
The common wisdom says precious metals do well during periods of inflation and thus the current environment should be favorable for gold and silver. However, we need only to look at the charts GLD and SLV to see that that has not been the case. As with other recent situations in the market, Treasury yields may be a major factor as to why that is.
Inflation benefits borrowers (bond issuers) and hurts lenders (bond investors) because lenders are paid back in the currency that is worth less than when they lent it. Thus, to gauge an investor’s actual economic return, we need to look at the real yield, which is simply nominal yield less inflation. As inflation goes up, real yields go down, making bonds less attractive and by extension making other stores of wealth, especially those with values that tend to increase with inflation, more attractive. Of course, the reverse is also true, when real yields increase, it makes bonds more attractive relative to assets that don’t produce any income. As a result, there tends to be an inverse relationship between precious metals prices and real yields. The graphs below show the prices of GLD and SLV (left Y-axis) and the 10-year US Treasury real yield, as measured by US Treasury Inflation-Indexed Securities (TIPS) (right axis).
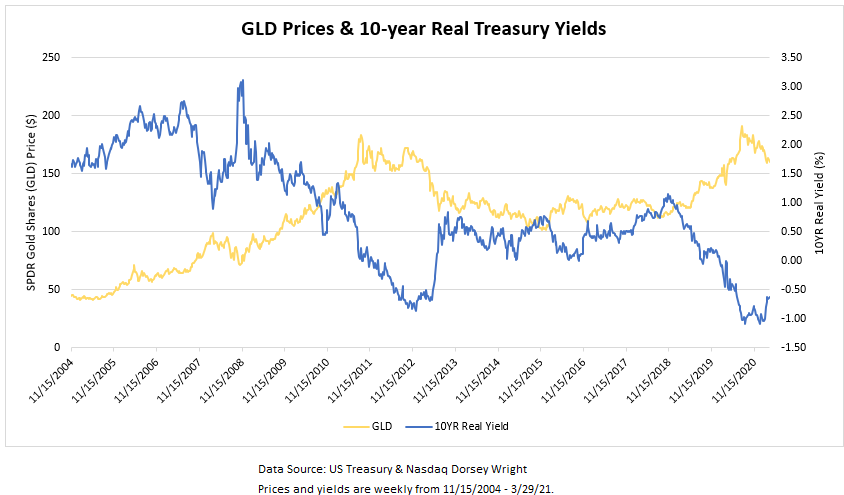
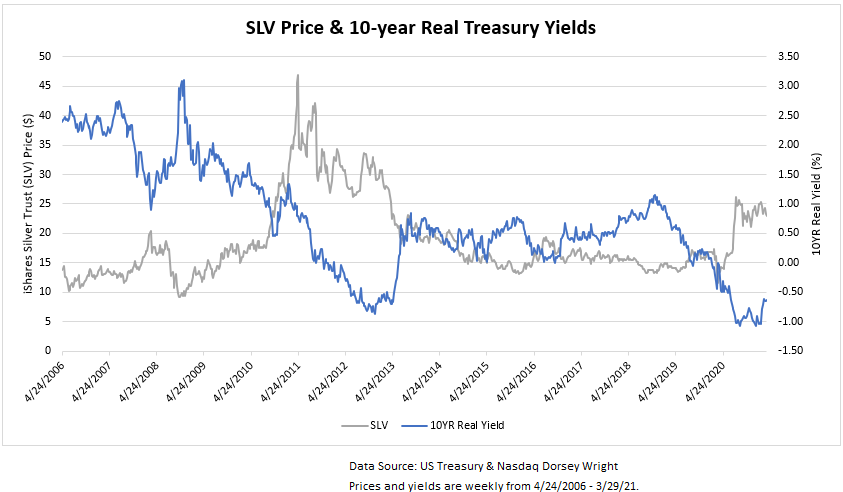
As the graph shows, real yields were falling throughout most of 2020; they fell to a low of around -1.08% in August, with GLD and SLV hitting multi-year highs around the same time. The 10-year real yield once again fell below -1% in January/February, with GLD and SLV strengthening somewhat (SLV more than GLD) during this period, although neither was able to reach their August high. So while there have been increased expectations for inflation with additional fiscal stimulus, which we would expect to be supportive of high commodity prices, the rise in nominal Treasury yields over the last few months nominal Treasury yields have pulled up real yields by extension, which has been a headwind for precious metals prices.
