
Most Requested Symbols

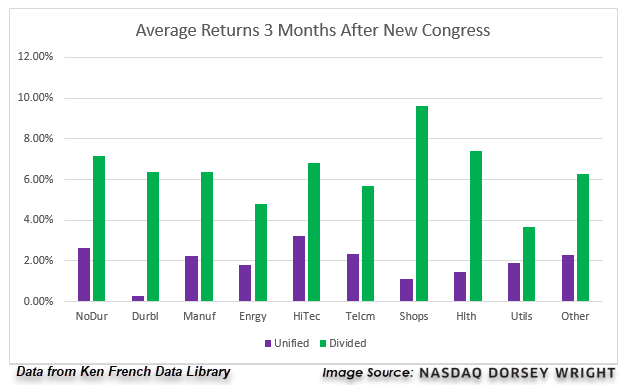
We compare domestic equity industry performance in political environments with a unified government controlling the executive and legislative branches against a divided government.
The average distribution reading is 39.42% overbought.
Today's featured stock is Essent Group Ltd (ESNT).
ATRC, BGFV, CROX, GCO, GME, GRA, HZO, PENN, YETI & ZTS.
Call: T-Mobile (US); Put: 3M Company (MMM); Covered Write: Uniti Group Inc (UNIT).
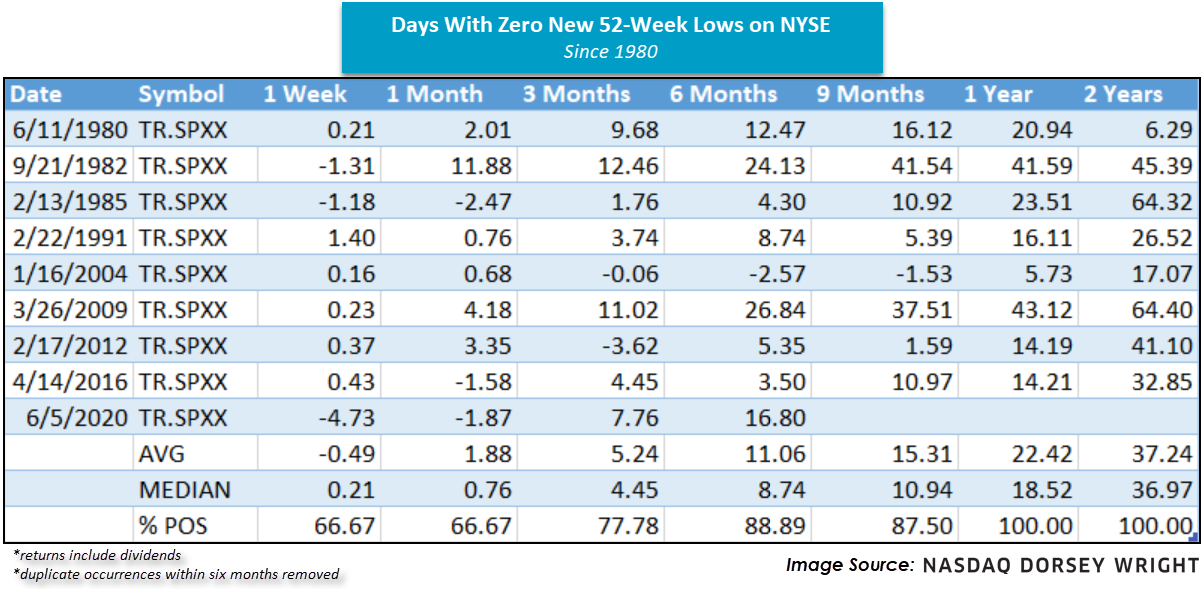
The major equity indices are off to a strong start this year, as each (S&P 500, Nasdaq Composite, and Dow Jones) gained over 1% in the first full week of trading. Along with new all-time highs we note substantial breadth and high levels of participation to the upside, most recently evidenced by zero stocks on the NYSE hitting a new 52-week low on Friday (1/8). After adjusting for clusters, defined in this study as duplicate occurrences within six months, we discover that this has only happened ten times since 1980 and forward returns (shown below) were historically very strong. Also note the percentage of positive returns row, indicating that all ten observations led to positive returns for the S&P 500 (TR.SPXX) over a one- and two-year window.
Like other market rarities there is no guarantee of future performance, and of course the potential for history to not repeat, but in our view recent instances like this and others (linked here) continue to suggest a positive environment for equities.

The first full week of 2021 saw major domestic equity indices continue higher, as shown by the S&P 500 Index SPX posting its second straight week of gains at a return of 1.83% through Friday. This came after residents of Georgia completed a runoff election from November that resulted in the Democratic party gaining two additional senate seats, which will effectively give the Democratic party control of the Senate when factoring in the tie-breaking vote of Vice President-elect Harris. Combining these results with the November election results indicates that the Democratic party will be in control of both houses of Congress and the White House for the first time since 2009. The 117th Congress that began in 2021 marks the 24th occurrence of a single party controlling both Congress and the White House since 1926. Interestingly enough, this is equal to the number of times we have seen a division of power between the White House, Senate, or House of Representatives. With domestic equity markets starting the year at or near all-time highs, there has been no shortage of speculation around how we should expect markets to perform with this new political environment.
In order to help provide perspective on what we might expect, we have reexamined the sector data that we looked at for our Presidential Election study in November. Recall that this looked at the historical performance of 10 broad domestic equity industry sectors using data pulled from the Ken French Data Library. This is the same Ken French from the famous Farma-French Model. This data was used as it ran from December 1926 through December 2019, allowing us to take our testing back significantly further than what is offered by the current GICs sectors. A breakdown of what is included in each of the ten industries can be found below:

Using these sectors, we then took the average returns of each portfolio over a forward 3-month, 6-month, and 12-month timeframe beginning at the start of each new Congress since 1927. These average returns were then further separated out by whether or not we had unification or division among the political parties in power of the executive and legislative branches. The results of each industry’s forward returns are below, along with some observations. Note that these industry indices are market-cap weighted and use total return data.


Average Level
39.42
| AGG | iShares US Core Bond ETF |
| USO | United States Oil Fund |
| DIA | SPDR Dow Jones Industrial Average ETF |
| DVY | iShares Dow Jones Select Dividend Index ETF |
| DX/Y | NYCE U.S.Dollar Index Spot |
| EFA | iShares MSCI EAFE ETF |
| FXE | Invesco CurrencyShares Euro Trust |
| GLD | SPDR Gold Trust |
| GSG | iShares S&P GSCI Commodity-Indexed Trust |
| HYG | iShares iBoxx $ High Yield Corporate Bond ETF |
| ICF | iShares Cohen & Steers Realty ETF |
| IEF | iShares Barclays 7-10 Yr. Tres. Bond ETF |
| LQD | iShares iBoxx $ Investment Grade Corp. Bond ETF |
| IJH | iShares S&P 400 MidCap Index Fund |
| ONEQ | Fidelity Nasdaq Composite Index Track |
| QQQ | Invesco QQQ Trust |
| RSP | Invesco S&P 500 Equal Weight ETF |
| IWM | iShares Russell 2000 Index ETF |
| SHY | iShares Barclays 1-3 Year Tres. Bond ETF |
| IJR | iShares S&P 600 SmallCap Index Fund |
| SPY | SPDR S&P 500 Index ETF Trust |
| TLT | iShares Barclays 20+ Year Treasury Bond ETF |
| GCC | WisdomTree Continuous Commodity Index Fund |
| VOOG | Vanguard S&P 500 Growth ETF |
| VOOV | Vanguard S&P 500 Value ETF |
| EEM | iShares MSCI Emerging Markets ETF |
| XLG | Invesco S&P 500 Top 50 ETF |

| Symbol | Company | Sector | Current Price | Action Price | Target | Stop | Notes |
|---|---|---|---|---|---|---|---|
| ITW | Illinois Tool Works Inc. | Machinery and Tools | $208.96 | high 190s to high 220s | 266 | 160 | 4 for 5'er, fav DWAMACH, LT market RS buy, consec buy signals, pullback from ATH, Earn. 1/29 |
| HOG | Harley-Davidson, Inc. | Leisure | $38.67 | hi 30s - low 40s | 66 | 32 | 4 for 5'er, top 50% of favored LEIS sector matrix, pullback from 52-week high, R-R>4.0, pot. cov. write Earnings 1/26/21 |
| BX | The Blackstone Group Inc | Finance | $62.90 | low-to-mid 60s | 69 | 54 | 4 for 5''er, favored WALL sector, LT pos mkt RS, multiple buy signals, pos monthly mom flip, 2.9% yield Earnings 1/28/21 |
| CLGX | CoreLogic, Inc. | Insurance | $75.33 | mid to upper 70s to low 80s | 105 | 64 | 5 for 5'er, consec buy signals, pullback from ATH, top half of DWAINSU, 1.7% yield |
| STM | SGS-Thomson Microelectronics N.V (France) ADR | Semiconductors | $40.09 | mid-to-high 30s | 52 | 30 | 4 for 5'er, LT pos mkt RS, bullish catapult, potential covered write, good R-R |
| EYE | National Vision Holdings, Inc. | Retailing | $50.19 | low to high 40s | 61 | 36 | 4 for 5'er, consec buy signals, pullback from ATH, fav DWARETA |
| MA | Mastercard Incorporated Class A | Finance | $353.85 | 340s - 350s | 416 | 280 | 3 for 5'er, favored FINA sector matrix, LT pos RS. spread triple top, 0.5% yield, Earn. 1/27 |
| TT | Trane Technologies PLC | Machinery and Tools | $152.58 | mid 140s - mid 150s | 182 | 122 | 5 for 5'er, top half of favored MACH sector matrix, LT pos mkt RS, 1.5% yield, Earn. 2/5 |
| UBER | Uber Technologies, Inc. | Retailing | $53.28 | low-to-mid 50s | 69 | 45 | 5 for 5'er, top third of favored RETA sector matrix, pullback from ATH, pot. cov. write, Earn. 2/4 |
| ESNT | Essent Group Ltd | Insurance | $47.92 | mid to upper 50s | 61 | 41 | 5 for 5'er, top 20% of favored INSU sector matrix, spread triple top, pos wkly mom flip, 1.4% yield |
| Symbol | Company | Sector | Current Price | Action Price | Target | Stop | Notes |
|---|
| Symbol | Company | Sector | Current Price | Action Price | Target | Stop | Notes |
|---|---|---|---|---|---|---|---|
| PLAN | Anaplan, Inc. | Internet | $71.46 | upper 60s to mid 70s | 84 | 58 | See follow up comment below. |
| Comment |
|---|
| TSM Taiwan Semiconductor Manufacturing Co. R (Taiwan) ADR ($122.89) - Semiconductors - We will now raise our stop to $95, the first potential sell signal on TSM's default chart. |
| Z Zillow Group Inc. Class C R ($145.76) - Real Estate - We will now raise our stop to $124, the first potential sell signal on Z's default chart |
| TSLA Tesla Inc. R ($827.53) - Autos and Parts - We will now raise our stop to $712, the first potential sell signal on TSLA's default chart |
| AMRC Ameresco Inc. R ($59.01) - Machinery and Tools - We will now raise our stop to $50, the first potential sell signal on AMRC's default chart. |
| PLAN Anaplan, Inc. R ($72.50) - Internet - PLAN has moved above the ideal range. OK to hold here. Raise stop to $60, the second potential sell signal on PLAN's default chart. |
ESNT Essent Group Ltd R ($48.34) - Insurance - ESNT is a 5 for 5'er that ranks in the top quintile of the favored insurance sector matrix. In last week's trading, the stock broke a spread triple top, taking out resistance that had been in place since March 2020, which also returned the stock to a positive overall trend. Meanwhile, a recent flip to positive weekly momentum is a positive sign for the stock's potential for additional upside. ESNT also comes with a 1.4% yield and offers a potential covered write opportunity on the April '21 call options. Long exposure may be added in the mid-to-upper $40s and we will set our initial stop at $41, a potential spread triple bottom break on ESNT's default chart. We will use the bullish price objective, $61, as our target price.
| 19 | 20 | 21 | |||||||||||||||||||||||||||||||||||||||||||||||||||
| 55.00 | X | • | 55.00 | ||||||||||||||||||||||||||||||||||||||||||||||||||
| 54.00 | X | O | • | 54.00 | |||||||||||||||||||||||||||||||||||||||||||||||||
| 53.00 | X | X | O | • | Top | 53.00 | |||||||||||||||||||||||||||||||||||||||||||||||
| 52.00 | X | X | O | X | C | • | 52.00 | ||||||||||||||||||||||||||||||||||||||||||||||
| 51.00 | X | O | X | O | X | 1 | • | 51.00 | |||||||||||||||||||||||||||||||||||||||||||||
| 50.00 | X | 9 | O | X | B | O | • | 50.00 | |||||||||||||||||||||||||||||||||||||||||||||
| 49.00 | 6 | O | 7 | X | O | X | 2 | • | 49.00 | ||||||||||||||||||||||||||||||||||||||||||||
| 48.00 | 5 | O | X | O | X | O | X | O | • | • | X | 48.00 | |||||||||||||||||||||||||||||||||||||||||
| 47.00 | X | X | O | X | O | X | A | X | O | X | • | X | • | • | X | 47.00 | |||||||||||||||||||||||||||||||||||||
| 46.00 | 3 | O | 4 | O | O | X | O | O | 3 | O | • | X | X | O | X | • | X | 46.00 | |||||||||||||||||||||||||||||||||||
| 45.00 | X | O | X | O | X | O | X | O | • | X | O | X | O | X | O | X | 45.00 | ||||||||||||||||||||||||||||||||||||
| 44.00 | • | X | O | X | 8 | X | O | X | O | • | X | X | X | O | X | O | X | O | X | Mid | 44.00 | ||||||||||||||||||||||||||||||||
| 43.00 | X | • | X | O | O | O | • | O | • | X | O | X | O | X | X | O | X | C | • | O | X | 43.00 | |||||||||||||||||||||||||||||||
| 42.00 | X | O | X | • | • | O | • | X | O | X | O | B | O | X | O | • | • | 1 | • | 42.00 | |||||||||||||||||||||||||||||||||
| 41.00 | B | O | X | • | O | • | X | X | O | O | X | O | X | • | • | 41.00 | |||||||||||||||||||||||||||||||||||||
| 40.00 | X | O | 2 | • | O | • | X | O | X | O | X | O | • | 40.00 | |||||||||||||||||||||||||||||||||||||||
| 39.00 | X | O | X | • | O | • | X | O | X | X | X | O | • | • | 39.00 | ||||||||||||||||||||||||||||||||||||||
| 38.00 | X | O | X | • | O | X | X | O | X | O | X | O | 9 | A | • | 38.00 | |||||||||||||||||||||||||||||||||||||
| 37.00 | C | X | • | O | X | O | X | X | O | X | O | 8 | O | X | O | X | • | 37.00 | |||||||||||||||||||||||||||||||||||
| 36.00 | O | X | • | O | X | O | X | O | 6 | O | X | O | X | O | X | O | X | • | 36.00 | ||||||||||||||||||||||||||||||||||
| 35.00 | • | O | 1 | • | O | X | O | X | O | X | O | X | O | X | O | O | • | Bot | 35.00 | ||||||||||||||||||||||||||||||||||
| 34.00 | O | X | • | O | X | O | X | O | X | O | 7 | X | • | 34.00 | |||||||||||||||||||||||||||||||||||||||
| 33.00 | O | X | • | O | O | X | O | O | X | • | 33.00 | ||||||||||||||||||||||||||||||||||||||||||
| 32.00 | O | • | O | X | X | X | O | X | • | 32.00 | |||||||||||||||||||||||||||||||||||||||||||
| 31.00 | • | O | X | O | X | X | O | X | O | • | 31.00 | ||||||||||||||||||||||||||||||||||||||||||
| 30.00 | O | X | X | O | X | O | X | X | O | X | • | 30.00 | |||||||||||||||||||||||||||||||||||||||||
| 29.00 | O | X | O | X | O | X | O | X | O | X | O | X | • | 29.00 | |||||||||||||||||||||||||||||||||||||||
| 28.00 | O | X | O | X | O | X | O | X | O | X | O | X | • | 28.00 | |||||||||||||||||||||||||||||||||||||||
| 27.00 | O | X | O | X | O | X | O | X | O | X | O | X | • | 27.00 | |||||||||||||||||||||||||||||||||||||||
| 26.00 | O | X | O | X | O | X | O | X | 5 | X | O | X | • | 26.00 | |||||||||||||||||||||||||||||||||||||||
| 25.00 | O | X | O | X | 4 | X | O | X | O | O | • | 25.00 | |||||||||||||||||||||||||||||||||||||||||
| 24.00 | O | X | O | X | O | X | O | X | • | • | 24.00 | ||||||||||||||||||||||||||||||||||||||||||
| 23.00 | O | X | O | X | O | X | O | • | 23.00 | ||||||||||||||||||||||||||||||||||||||||||||
| 22.00 | O | X | O | X | O | X | • | 22.00 | |||||||||||||||||||||||||||||||||||||||||||||
| 21.00 | O | X | O | X | O | • | 21.00 | ||||||||||||||||||||||||||||||||||||||||||||||
| 20.00 | O | X | O | • | 20.00 | ||||||||||||||||||||||||||||||||||||||||||||||||
| 19.50 | O | X | • | 19.50 | |||||||||||||||||||||||||||||||||||||||||||||||||
| 19.00 | O | X | • | 19.00 | |||||||||||||||||||||||||||||||||||||||||||||||||
| 18.50 | O | X | • | 18.50 | |||||||||||||||||||||||||||||||||||||||||||||||||
| 18.00 | O | • | 18.00 | ||||||||||||||||||||||||||||||||||||||||||||||||||
| 19 | 20 | 21 |
| ATRC AtriCure, Inc. ($59.52) - Healthcare - ATRC shares moved higher today to break a double top at $59 to mark its second consecutive buy signal and reach a new all-time high. This 5 for 5'er has been in a positive trend since November and on an RS buy signal versus the market since June of 2018. Recent price action has put ATRC into heavily overbought territory, so those wishing to initiate a long position may be best served to wait for a pullback or price normalization. From here, support is offered at $53. |
| BGFV Big 5 Sporting Goods Corp. ($12.26) - Retailing - BGFV broke a double top at $12.50, marking the stock’s sixth consecutive buy signal. BGFV is a 5 for 5’er within the favored retailing sector that has experienced two weeks of positive weekly momentum. From here, support sits at $10. BGFV offers a yield of 3.29%. |
| CROX Crocs, Inc. ($74.41) - Textiles/Apparel - CROX completed a bullish catapult pattern with today’s market action at $71 before moving higher to $76. This move broke through resistance dating back to 2007 and as a result, CROX is now trading at new all-time highs. CROX is a 5 for 5’er within the favored textiles/apparel sector that has support sitting at $66. |
| GCO Genesco Inc. ($35.80) - Textiles/Apparel - GCO returned to a buy signal at $35 before moving higher to $36 on Monday. GCO is a 3 for 5’er that ranks in the top half of the favored textiles/apparel sector. From here, support sits at $27. |
| GME GameStop Corporation ($19.78) - Retailing - GME broke a double top at $19.50 before moving higher to $20 on Monday, marking the stock’s second consecutive buy signal. GME is a perfect 5 for 5’er within the favored retailing sector that ranks 9th out of 90 names. From here, support sits at $17.50. |
| GRA W.R. Grace & Co ($59.52) - Chemicals - GRA broke a quadruple top at $58 in Monday's trading, breaking through resistance that had been in place since November and continued higher, taking out an additional level of resistance at $58. GRA is a 3 for 5'er that ranks in the top half of the favored chemicals sector matrix and carries a 2.2% yield. The stock now sits against resistance at $60, while the first sell signal would come with a move to $53. |
| HZO Marinemax ($40.47) - Leisure - HZO completed a bullish catapult pattern on Monday with a double top buy signal at $40 before moving higher to $41, marking a new all-time high on the chart. HZO is a 4 for 5’er within the favored leisure sector that has experienced two weeks of positive weekly momentum. Initial support is available at $35. |
| PENN Penn National Gaming Inc ($101.61) - Gaming - PENN returned to a buy signal on Monday with a double top buy signal at $95 before rallying to new all-time highs at $102. PENN is a healthy 5 for 5’er that ranks 4th out of 14 names in the favored gaming sector. Initial support sits at $87 and earnings are expected on 2/4/21. |
| YETI YETI Holdings, Inc. ($75.66) - Leisure - YETI completed a shakeout pattern on Monday with a triple top breakout at $75 before moving higher to new all-time highs at $76. YETI is a perfect 5 for 5’er that has been trading in a positive trend since early May. From here, support sits at $68. |
| ZTS Zoetis Inc. ($169.26) - Drugs - ZTS shares moved higher today to break a double top at $170 to return to a Point & Figure buy signal. This 4 for 5'er has been in a positive trend since April and on an RS buy signal versus the market since June of 2015. ZTS is actionable at current levels with a weekly overbought/oversold reading of 21%. From here, support is offered at $158. |

| Name | Option Symbol | Action | Stop Loss |
|---|---|---|---|
| T-Mobile US Inc. - $132.93 | O: 21E130.00D21 | Buy the May 130.00 calls at 11.40 | 124.00 |
| Name | Option | Action |
|---|---|---|
| Dow, Inc. ( DOW) | Mar. 50.00 Calls | Raise the option stop loss to 7.55 (CP: 9.55) |
| Marvell Technology Group Ltd. ( MRVL) | May. 42.00 Calls | Raise the option stop loss to 7.90 (CP: 9.90) |
| Analog Devices, Inc. ( ADI) | Mar. 140.00 Calls | Raise the option stop loss to 17.80 (CP: 19.80) |
| QUALCOMM Incorporated ( QCOM) | Mar. 140.00 Calls | Raise the option stop loss to 17.70 (CP: 19.70) |
| Target Corporation ( TGT) | Apr. 170.00 Calls | Raise the option stop loss to 26.35 (CP: 28.35) |
| L Brands Inc. ( LB) | May. 37.00 Calls | Raise the option stop loss to 10.10 (CP: 12.10) |
| ConocoPhillips ( COP) | May. 40.00 Calls | Raise the option stop loss to 5.40 (CP: 7.40) |
| Lowe's Companies, Inc. ( LOW) | Mar. 155.00 Calls | Initiate an option stop loss of 13.35 (CP: 15.35) |
| Name | Option Symbol | Action | Stop Loss |
|---|---|---|---|
| 3M Company - $165.20 | O: 21O170.00D19 | Buy the March 170.00 puts at 10.90 | 178.00 |
| Name | Option | Action |
|---|---|---|
| Kellogg Company (K) | Mar. 65.00 Puts | Initiate a stock price stop of 0.00 (CP: 59.37) |
| Digital Realty Trust, Inc. (DLR) | Apr. 140.00 Puts | Raise the option stop loss to 11.00 (CP: 13.00) |
| Name | Option Sym. | Call to Sell | Call Price | Investment for 500 Shares | Annual Called Rtn. | Annual Static Rtn. | Downside Protection |
|---|---|---|---|---|---|---|---|
| Uniti Group Inc $11.83 | O: 21E12.00D21 | May. 12.00 | 1.15 | $5,394.80 | 28.42% | 26.55% | 8.64% |
| Name | Action |
|---|---|
| Marathon Petroleum Corp. (MPC) - 43.18 | Sell the April 45.00 Calls. |
| Snap Inc (SNAP) - 52.73 | Sell the February 55.00 Calls. |
| General Motors (GM) - 43.06 | Sell the June 45.00 Calls. |
| Marvell Technology Group Ltd. (MRVL) - 49.08 | Sell the May 50.00 Calls. |
| Western Digital Corporation (WDC) - 51.82 | Sell the April 55.00 Calls. |
| Kohl's Corporation (KSS) - 41.61 | Sell the April 42.50 Calls. |
| MGM Resorts International (MGM) - 31.36 | Sell the June 35.00 Calls. |
| Uber Technologies, Inc. (UBER) - 53.28 | Sell the March 55.00 Calls. |
| Name | Covered Write |
|---|---|
|
|
|
Daily Equity & Market Analysis
Loading, Please Wait...
