
Most Requested Symbols

Each year, we produce 12 articles throughout the last few weeks of the year, all revolving around one central topic. This year, all 12 articles will revolve around the topic of "Enhancing Your Process With Scalable Customization in 2021". For Day 2, we highlight the Relative Strength Process.
The average distribution reading is 42.55% overbought.
Today's featured stock is Johnson Controls International PLC (JCI).
LOB, CRSP, MBUU, MELI, PENN, SNBR, CCK, CGNX, HASI, ZBRA, & BRKS.
Call: Analog Devices Inc (ADI); Put: Lumen Technologies (LUMN); Covered Write KeyCorp (KEY).
We are excited to announce phase three of the Nasdaq Dorsey Wright Model Builder with the launch of Matrix and FSM-based Relative Strength (RS) Testing Service. As part of this launch, we are granting you free access to the service for the remainder of 2020. The tool is designed to help you more easily design, test, implement, and monitor custom models powered by the Nasdaq Dorsey Wright methodology. Through the end of December, be sure to join us each Thursday at 1 pm EST for a custom modeler demo presented by the analyst team.
11/19/2020: Static Model Builder Demo Replay - Click Here
11/12/2020: Matrix Model Builder Demo Replay - Click here
11/5/2020: FSM Model Builder Demo Replay - Click here
Click here to register for future Nasdaq Dorsey Wright Model Builder Demos
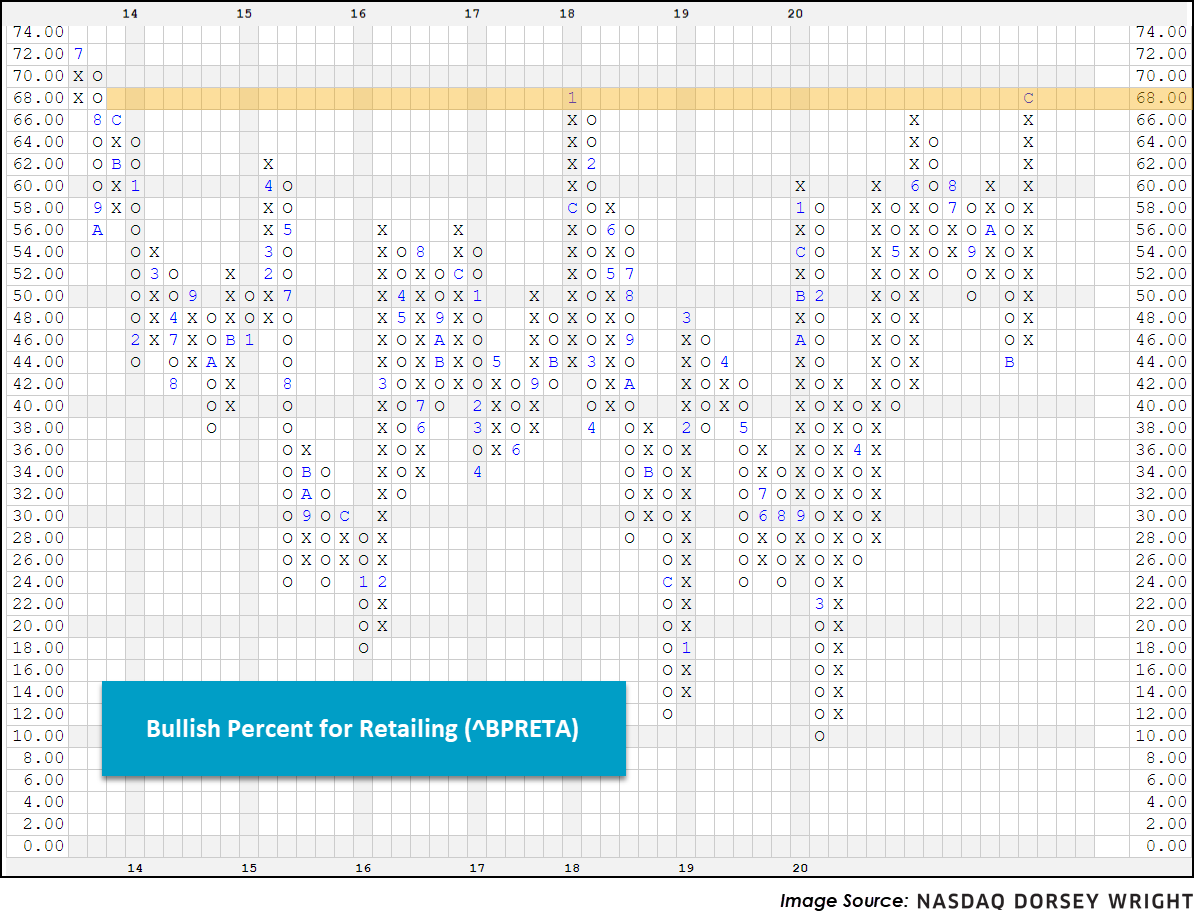
You’ve probably heard of Black Friday, the day after Thanksgiving, Cyber Monday, the Monday after Thanksgiving, but what about Green Monday? Like the other infamous shopping events, Green Monday, the second Monday in December, refers to one of the retail industry’s most profitable days as consumers make their last-minute purchases before the holidays. Interestingly, according to large transporters like United Parcel Service UPS and USPS, December 15th marks the latest date to send domestic packages using regular ground shipping; FedEx FDX is a bit tighter with December 14th as their final day. However, in an era filled with retail giants like Amazon AMZN, Target TGT, and Walmart WMT, closer-dated shipping may still be a distinct possibility/reality for many. In recognition of Green Monday, we’ve provided a few bullet points on the DWA Retail Sector and respective model.

Over the last decade, the advisory business has continued to evolve rapidly with the growing trends of lower fees and increased automation. With the influx of low-cost index funds and Robo-advisors offering nearly-free financial planning, investors can now gain beta market exposure at rock-bottom prices without ever setting foot in an advisor's office. The upshot is that it is now more challenging than ever for you as a traditional financial advisor to justify your fee and grow your client base. That said, you must scale your process and sharpen your value proposition as much as possible. To help you do just that, this year's 12 Days of Christmas Series, "Enhancing Your Process With Scalable Customization in 2021," will navigate you through the benefits, use/implementation, and customization of rules-based, Relative Strength-driven guided model portfolios. Additionally, this series will highlight the NDW Model Builder Tool's new features, providing relevant use-cases to help you scale your business in the coming year.
Day 1 - Benefits of Models and a Rules-Based Process
The Relative Strength Process
At Nasdaq Dorsey Wright, we consider Relative Strength (RS) to be one of the most important tools in our arsenal. We must position our portfolios towards those securities that possess positive Relative Strength in order to beat our benchmark performance measures. But what is Relative Strength? What does it mean for something to have positive Relative Strength? Relative Strength is simply a measure of performance compared to something else. In order to calculate the RS between two investments, we divide the closing price of Investment A by the closing price of Investment B and multiply that value by 100 to smooth the decimals. On its own, a single reading of this calculation is not particularly helpful. However, once the Relative Strength reading is plotted on a Point & Figure chart, the Relative Strength story comes alive.
Just as is the case with a Point & Figure trend chart that tracks price over time, a Relative Strength buy signal is given when a column of Xs exceeds the previous column of Xs and suggests that Investment A should be expected to outperform Investment B. Conversely, a Relative Strength sell signal occurs when a column of Os falls below the previous column of Os, suggesting that Investment A should be expected to underperform Investment B. The signal of a Relative Strength chart (buy or sell), depicts the long-term RS relationship, while the column (Xs or Os), shows where the shorter-term strength lies. One of the major benefits of this form of comparative analysis is that any two names with changing prices can be compared against one another on a Relative Strength chart.
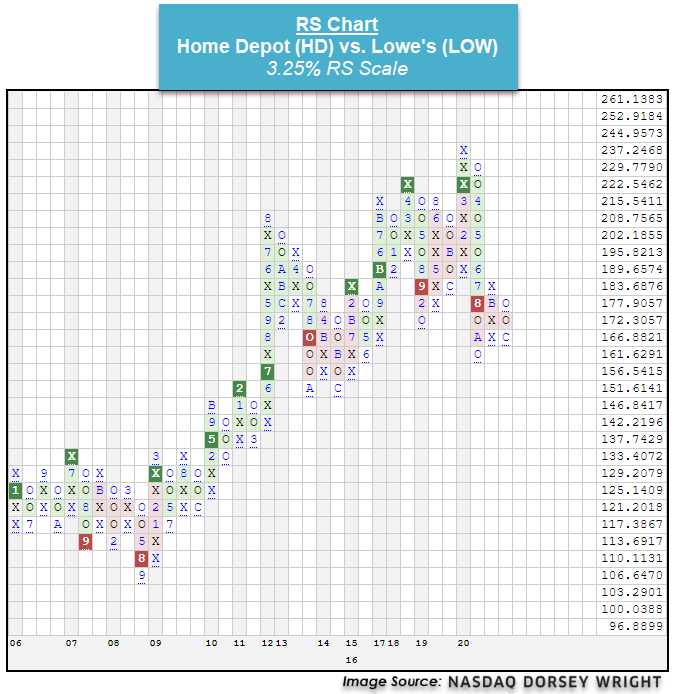
To illustrate the RS relationship, we have compared Home Depot HD and Lowe’s LOW on an RS chart utilizing a 3.25% scale. After giving a buy signal in March, the RS relationship between HD and LOW moved lower and returned to a sell signal on August 3, indicating that Lowe’s is favorable from a long-term perspective. The chart did move higher briefly in mid-November but recently reversed back down into Os on December 9. This also indicates that LOW is favorable from a near-term perspective. Since the chart moved to a sell signal on 8/3, LOW has outperformed HD with respective returns of 5.02% and -0.61% (through 12/11).
The Value of Relative Strength
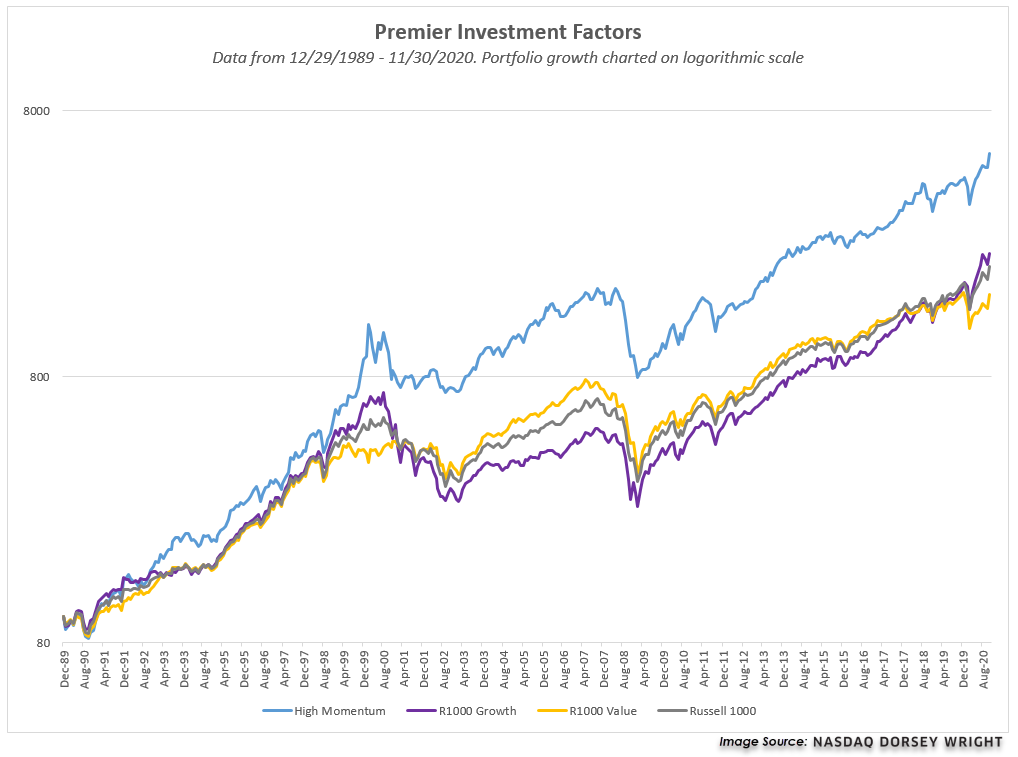
As an investment factor, Relative Strength (also known as momentum) has been shown to be a robust factor, and when used as a selection criterion, capable of delivering outperformance over the long-term. Unlike other stock selection criteria such as fundamental valuation, Relative Strength is evaluated on a purely quantitative or technical basis. As a result, RS removes subjectivity and emotion and lends itself to creating systematic, rules-based strategies for investing which are both repeatable and scalable.
There are multiple ways of measuring Relative Strength or momentum. Most of which are based on selecting the best-performing assets over a given lookback period, often six or 12 months. As mentioned above, Nasdaq Dorsey Wright’s primary method for measuring Relative Strength is based upon plotting the relative price movement of two names on a Point & Figure chart. We also track RS using percentile ranking methods, which we incorporate in our Fund Scores and through our Relative Strength ranking process used for the actively managed Systematic Relative Strength portfolios. In the case of constructing domestic equity portfolios, this typically results in owning a basket of stocks that have demonstrated positive Relative Strength, such as those that are on a buy signal (positive long-term RS) and in a column of Xs (positive short-term RS) against a market proxy like the S&P 500 SPX. As our research has found, the NDW method has managed to perform better than other methods of measuring momentum over time.
Relative Strength Expectations
As you've heard us discuss before, every investment strategy, whether it is value investing, growth investing, fundamental, or even trend following, goes through periods of underperformance, and Relative Strength investing (RS) is no different. RS laggard periods can be uncomfortable, and when looking in the rearview mirror (early 2016 or late 2018), it serves as an unfriendly reminder of this. As you discuss your process with prospects and clients, it's important for them to understand that sometimes RS based strategies are not immune to periods of underperformance, however, we have found that the RS has tended to rebound out of these laggard periods, providing, at times, consistent and robust returns.
As is the case with any investment factor, Relative Strength is not a guarantee. It will not provide outperformance every day, week, month, quarter, or year; nor is that what it is designed to do. It is not designed to get you in at the bottom and get you out at the top. Instead, it is designed to allow you to participate in the “meat” of the move. It will force you to remain invested in strong trends and themes, even if your gut may be telling you the ride is over. Just as importantly, it will give you an indication to move to the sidelines when those trends do in fact come to an end.
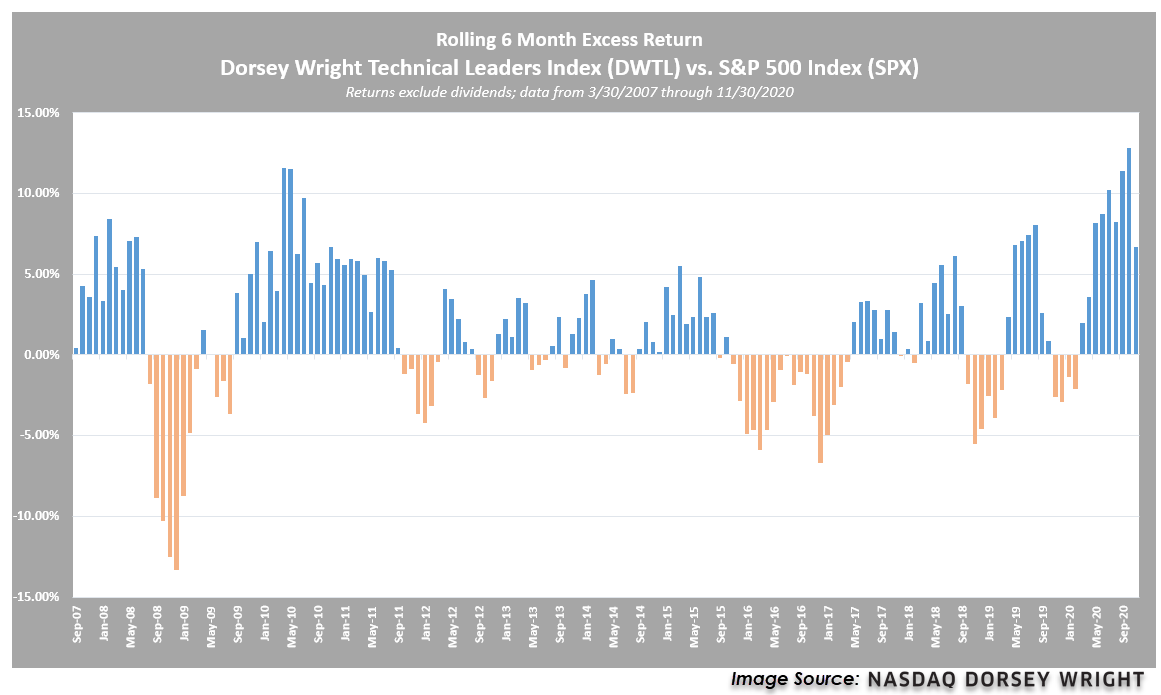
A simple yet effective picture to help you set expectations is the "Relative Strength cycle" graph we use in various presentations. It shows the rolling six-month excess return of the Dorsey Wright Technical Leaders Index DWTL versus the S&P 500 Index SPX. Recall that the DWTL is an index that is designed to select 100 stocks on a quarterly basis that exhibit high RS within a universe of 1,000 stocks, so it provides a "proxy" for a Relative Strength strategy. Going back to March 2007, you can see how there are periods where DWTL, or Relative Strength, underperforms, but it's often followed by a strong rebound. The periods where it underperforms are often around market bottoms as well as choppy market environments where most Relative Strength and trend following strategies struggle. There is no doubt underperformance can be uncomfortable, and while not common, it is not unprecedented. However, it is also important to stress that these bouts of underperformance often present great opportunities. As new leadership trends rise to the top, these strategies tend to rebound up from a trough in the RS cycle.
Everyone has an ideal plan or vision that they THINK or HOPE will happen, but when reality kicks in, things can suddenly go awry. In order to be a successful investor (or advisor), you most certainly don’t have to be perfect. But you do need to have a plan that will act as your guide, telling you when to focus on wealth accumulation versus wealth preservation. This is where our rules-based, Relative Strength strategies come into play. Whether you're using the First Trust Focus Five Model, the moderate DALI Tactical Tilt Strategy, or the ESG Top 20 stock model in your portfolio, the answers to the following questions remain the same. Will we catch the exact top of the market and get out using RS? No. Will we catch the exact bottom to get back in? No. Will there be times the portfolio is down? Absolutely. Will the portfolio be positioned to adapt to and take advantage of major themes in leadership? Yes.
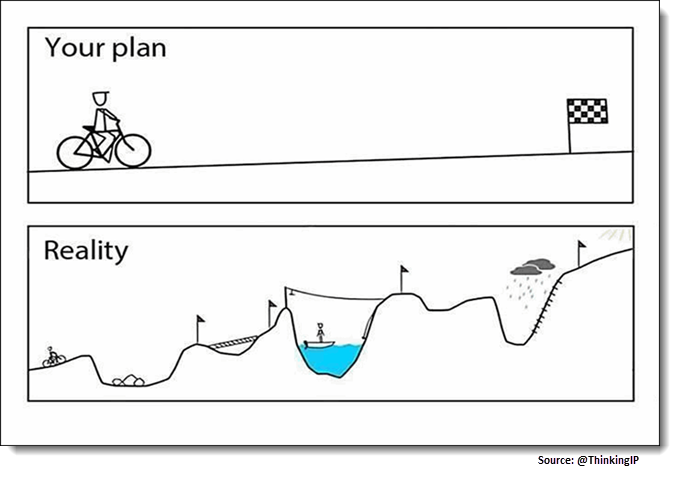
Finally, the overall goal of these relative strength strategies is to help us navigate the financial waters – whether the seas are calm or choppy – so that one day we can arrive at our end destination. Those without a strategy for knowing when to be invested and when to wait on the sidelines until getting the ball back have a high probability of finding themselves shipwrecked on a deserted island. The small changes made during the course are at first imperceptible, but down the final road, as you are making your way towards your final destination, those small changes add up and can make the difference in arriving in one piece versus getting stuck in the storm. While we'll never know what the future holds, we can be confident using a rules-based, emotionless strategy that will position us towards those names that are most likely to outperform in the future.
Average Level
42.55
| AGG | iShares US Core Bond ETF |
| USO | United States Oil Fund |
| DIA | SPDR Dow Jones Industrial Average ETF |
| DVY | iShares Dow Jones Select Dividend Index ETF |
| DX/Y | NYCE U.S.Dollar Index Spot |
| EFA | iShares MSCI EAFE ETF |
| FXE | Invesco CurrencyShares Euro Trust |
| GLD | SPDR Gold Trust |
| GSG | iShares S&P GSCI Commodity-Indexed Trust |
| HYG | iShares iBoxx $ High Yield Corporate Bond ETF |
| ICF | iShares Cohen & Steers Realty ETF |
| IEF | iShares Barclays 7-10 Yr. Tres. Bond ETF |
| LQD | iShares iBoxx $ Investment Grade Corp. Bond ETF |
| IJH | iShares S&P 400 MidCap Index Fund |
| ONEQ | Fidelity Nasdaq Composite Index Track |
| QQQ | Invesco QQQ Trust |
| RSP | Invesco S&P 500 Equal Weight ETF |
| IWM | iShares Russell 2000 Index ETF |
| SHY | iShares Barclays 1-3 Year Tres. Bond ETF |
| IJR | iShares S&P 600 SmallCap Index Fund |
| SPY | SPDR S&P 500 Index ETF Trust |
| TLT | iShares Barclays 20+ Year Treasury Bond ETF |
| GCC | WisdomTree Continuous Commodity Index Fund |
| VOOG | Vanguard S&P 500 Growth ETF |
| VOOV | Vanguard S&P 500 Value ETF |
| EEM | iShares MSCI Emerging Markets ETF |
| XLG | Invesco S&P 500 Top 50 ETF |

| Symbol | Company | Sector | Current Price | Action Price | Target | Stop | Notes |
|---|---|---|---|---|---|---|---|
| AOS | A.O. Smith Corporation | Building | $56.36 | mid to upper 50s | 72 | 47 | 4 for 5'er, four consec buy signals, mutli-year high, market RS buy signal since 9/2008, 1.86% yield |
| SPWR | Sunpower Corporation | Electronics | $21.50 | low 20s | 33.50 | 18 | 5 for 5'er, #3 of 59 names in ELEC sector matrix, pos wkly mom flip, pot cov. write |
| BECN | Beacon Roofing Supply, Inc. | Building | $38.11 | 36 - 40 | 56 | 30 | 4 for 5'er, top third of fav DWABUIL, consec buy signals, 52 week highs, pos weekly mom flip |
| APAM | Artisan Partners Asset Management, Inc | Finance | $48.31 | mid-to-upper 40s | 53.50 | 39 | 5 for 5'er, top 20% of FINA sector matrix, multiple buy signals, pos wkly mom flip, 6% yield |
| CZR | Caesars Entertainment Inc. | Gaming | $69.90 | low-to-mid 70s | 88 | 62 | 4 for 5'er, #1 of 12 in favored GAME sector matrix, triple top breakout, pot. covered write |
| APPS | Digital Turbine Inc. | Computers | $43.55 | low to upper 40s | 78 | 35 | 5 for 5'er, LT market RS buy signal, consec buy signals, pullback from ATH,fav COMP sector |
| MLM | Martin Marietta Materials In | Building | $267.20 | 270s - 290s | 312 | 236 | 3 for 5'er, top half of favored BUIL sector matrix, spread quintuple top, |
| CVNA | Carvana Company | Autos and Parts | $258.26 | 230s - 260s | 348 | 204 | 4 for 5'er, pullback from ATH, pos weekly mom, fav DWAAUTO |
| LASR | nLIGHT, Inc. | Semiconductors | $33.35 | low-to-mid 30s | 55 | 27 | 5 for 5'er, top 10% of SEMI sector matrix, consec buy signals, pullback from multi-year high |
| JCI | Johnson Controls International PLC | Protection Safety Equipment | $45.55 | mid 30s | 58 | 39 | 4 for 5'er, top half of PROT sector matrix, multiple buy signals 2.3% yield, R-R>2.0 |
| Symbol | Company | Sector | Current Price | Action Price | Target | Stop | Notes |
|---|
| Comment |
|---|
| AMAT Applied Materials, Inc. R ($88.74) - Semiconductors - We will now raise our stop to $80.50, which would take out two levels of support on AMAT's $0.50 chart. |
| PVH Phillips-Van Heusen Corporation R ($94.26) - Textiles/Apparel - We will now raise our stop to $79, the second potential sell signal on PVH's default chart. |
| TTC The Toro Company R ($91.95) - Machinery and Tools - We will now raise our stop to $80, a potential spread quad bottom break on TTC's default chart. |
| SGMS Scientific Games Corporation R ($39.26) - Gaming - We will now raise our stop to $35, the first potential sell signal on SGMS's default chart. |
| BLMN Bloomin' Brands Inc R ($18.24) - Restaurants - We will now raise our stop to $15, the first potential sell signal on BLMN's default chart. |
| CVNA Carvana Company R ($247.98) - Autos and Parts - CVNA sell to a sell signal in Monday's trading. OK to hold here. Raise stop to $220, the next potential sell signal on CVNA's default chart. |
JCI Johnson Controls International PLC R ($45.21) - Protection Safety Equipment - JCI is a 4 for 5'er that ranks in the top half of the protection safety equipment sector matrix. On its default chart, JCI has given five consecutive buy signals and currently sits one box away from reaching a new all-time high at $48. JCI also comes with a 2.3% yield. Long exposure may be added in the mid $40s and we will set our initial stop at $39, the potential trend line violation on JCI's default chart. We will use the bullish price objective of $58 as our target price, giving us a reward-to-risk ratio north of 2.0
| 15 | 16 | 17 | 18 | 19 | 20 | ||||||||||||||||||||||||||||||||||||||||||||||||
| 47.00 | • | X | X | 47.00 | |||||||||||||||||||||||||||||||||||||||||||||||||
| 46.00 | X | • | X | O | X | 46.00 | |||||||||||||||||||||||||||||||||||||||||||||||
| 45.00 | X | O | • | • | • | X | X | O | X | 45.00 | |||||||||||||||||||||||||||||||||||||||||||
| 44.00 | X | O | 1 | • | 7 | • | 9 | • | X | B | O | X | O | Mid | 44.00 | ||||||||||||||||||||||||||||||||||||||
| 43.00 | X | X | C | X | O | X | O | • | 8 | O | • | 9 | A | O | X | O | X | 43.00 | |||||||||||||||||||||||||||||||||||
| 42.00 | 9 | O | B | O | X | O | X | O | A | • | • | 7 | O | • | X | O | X | O | X | O | 42.00 | ||||||||||||||||||||||||||||||||
| 41.00 | X | O | X | O | 2 | O | 9 | O | X | • | • | X | C | • | X | O | X | O | 41.00 | ||||||||||||||||||||||||||||||||||
| 40.00 | C | X | O | X | O | X | O | X | O | • | • | X | • | 6 | 1 | • | 8 | O | 40.00 | ||||||||||||||||||||||||||||||||||
| 39.00 | B | O | 3 | 6 | 7 | O | O | X | B | 1 | O | X | • | X | • | X | O | • | X | 2 | 3 | • | X | • | 39.00 | ||||||||||||||||||||||||||||
| 38.00 | X | O | X | O | X | O | X | 8 | X | O | X | 2 | X | O | X | O | • | 8 | O | • | 5 | O | X | O | • | • | X | • | Bot | 38.00 | |||||||||||||||||||||||
| 37.00 | X | 1 | X | O | X | O | X | O | O | X | O | X | O | X | O | • | X | 9 | 3 | O | X | O | X | • | • | X | • | 37.00 | |||||||||||||||||||||||||
| 36.00 | X | O | 4 | 5 | O | O | X | O | • | 3 | X | O | 5 | 7 | O | X | O | O | X | O | X | • | 7 | • | 36.00 | ||||||||||||||||||||||||||||
| 35.00 | 5 | X | O | • | • | O | O | X | O | X | O | X | X | O | X | O | X | O | X | • | 35.00 | ||||||||||||||||||||||||||||||||
| 34.00 | 7 | 4 | • | • | O | X | O | X | A | B | O | 2 | O | X | O | X | O | X | • | 34.00 | |||||||||||||||||||||||||||||||||
| 33.00 | O | A | X | • | 4 | 6 | • | O | X | O | X | O | 6 | O | O | • | 33.00 | ||||||||||||||||||||||||||||||||||||
| 32.00 | 8 | X | O | 3 | • | • | O | X | C | 1 | O | X | • | 32.00 | |||||||||||||||||||||||||||||||||||||||
| 31.00 | O | X | O | X | • | O | O | X | • | O | X | X | X | • | 31.00 | ||||||||||||||||||||||||||||||||||||||
| 30.00 | 9 | C | X | • | O | X | • | O | X | O | X | O | X | • | 30.00 | ||||||||||||||||||||||||||||||||||||||
| 29.00 | O | X | • | O | • | O | X | O | X | O | X | • | 29.00 | ||||||||||||||||||||||||||||||||||||||||
| 28.00 | O | X | • | • | O | 4 | O | 5 | X | • | 28.00 | ||||||||||||||||||||||||||||||||||||||||||
| 27.00 | 1 | X | • | O | X | O | • | 27.00 | |||||||||||||||||||||||||||||||||||||||||||||
| 26.00 | O | • | O | X | • | 26.00 | |||||||||||||||||||||||||||||||||||||||||||||||
| 25.00 | • | O | X | • | 25.00 | ||||||||||||||||||||||||||||||||||||||||||||||||
| 24.00 | • | O | X | • | 24.00 | ||||||||||||||||||||||||||||||||||||||||||||||||
| 23.00 | • | O | • | 23.00 | |||||||||||||||||||||||||||||||||||||||||||||||||
| 15 | 16 | 17 | 18 | 19 | 20 |
| BRKS Brooks Automation Inc ($75.07) - Semiconductors - BRKS moved higher Monday to break a double top at $76 before reaching a new multi-year high at $77 intraday. This 4 for 5'er moved to a positive trend in April and ranks 8th out of 60 names in the semiconductors sector RS matrix. The weight of the evidence is positive, however, BRKS is now heavily overbought. Those looking to add exposure would be best served to wait for a pullback or normalization of the trading band. Initial support can be found at $70 with further support offered at $68 and $65. |
| CCK Crown Holdings, Inc. ($95.19) - Business Products - CCK gave an initial sell signal when it broke a double bottom at $95 in Monday's trading. Despite Monday's sell signal, the technical picture for CCK remains positive as it is a 3 for 5'er that ranks in the top 20% of the business products sector matrix. From here, support lies at $94, while overhead resistance sits at $99, a level CCK has failed to breakthrough on three prior occasions. |
| CGNX Cognex Corp ($77.84) - Computers - CGNX moved higher Monday to break a double top at $79, marking a third consecutive buy signal and a new all-time high. This 5 for 5'er moved to a positive trend in April and ranks in the top half of the favored computers sector RS matrix. The overall weight of the evidence is positive here. Exposure may be considered at current levels, with initial support offered at $75. Further support may be found at $70 and $68, the current location of the bullish support line. |
| CRSP Crispr Therapeutics AG ($152.95) - Biomedics/Genetics - CRSP shares pushed higher today to break a double top at $158 to mark its third consecutive buy signal. This 5 for 5'er has been in a positive trend since November and on an RS buy signal versus the market since June of 2019. Recent price action has put CRSP into heavily overbought territory, so those wishing to initiate a long position may be best served to wait for a pullback or price normalization. From here, support can be found at $142. |
| HASI Hannon Armstrong Sustainable Infrastructure Capital, Inc. ($56.30) - Real Estate - Shares of HASI broke a double top at $57 on Monday, resulting in a fourth consecutive buy signal and new all-time chart high. The 5 for 5'er ranks in the top decile of the real estate stock sector matrix and has remained on an RS buy signal versus the market for almost an entire year now. The weight of the evidence is positive; however, those looking to initiate new long exposure may look for a pullback as the stock is nearing heavily overbought territory. Initial support is offered around $53. |
| LOB Live Oak Bancshares Inc ($45.74) - Banks - LOB shares moved higher today to break a double top at $45 to return to a buy signal. This 5 for 5'er has been in a positive trend since June and on an RS buy signal versus the market since August. LOB is currently actionable with a weekly overbought/oversold reading of 44%. From here, support is offered at $41. |
| MBUU Malibu Boats Inc. ($64.01) - Leisure - MBUU, a 3 for 5’er in the favored leisure sector, broke through multiple levels of resistance on Monday when it completed a bullish catapult pattern at $62 before printing a new all-time high at $65. From here, support sits at $57. |
| MELI Mercadolibre, Inc. ($1,618.70) - Internet - MELI broke a double top at $1632 on Monday, marking the stock’s fifth consecutive buy signal and a new all-time high. MELI is a 4 for 5’er within the internet sector that just experienced a flip to positive weekly momentum. From here, support sits at $1520. |
| PENN Penn National Gaming Inc ($80.50) - Gaming - PENN broke a double top at $81 before reaching $84. PENN is now trading at new all-time highs. PENN is a healthy 4 for 5’er that moved into a positive trend in May. From here, support sits at $73. |
| SNBR Sleep Number Corp. ($83.46) - Household Goods - SNBR broke a double top at $85 on Monday, marking the stock’s second consecutive buy signal. SNBR is a perfect 5 for 5’er that ranks #1 in the household goods sector matrix, making this the strongest name in this favored space. Additionally, weekly momentum just flipped positive, suggesting the potential for higher prices. From here, support sits at $80. |
| ZBRA Zebra Technologies Corp ($383.46) - Electronics - ZBRA rose Monday and broke a double top at $384, marking a new all-time high. This 5 for 5'er moved to a positive trend in April and sits in the upper quintile of the favored electronics sector RS matrix. The technical picture is strong, however, the stock is now overbought so those looking to add exposure would be best served to wait for a pullback or normalization of the trading band. Initial support can be found at $368 with further support offered at $336. |

| Name | Option Symbol | Action | Stop Loss |
|---|---|---|---|
| Analog Devices, Inc. - $142.33 | O: 21C140.00D19 | Buy the March 140.00 calls at 10.40 | 130.00 |
| Name | Option | Action |
|---|---|---|
| L Brands Inc. ( LB) | Jan. 27.50 Calls | Stopped at 0.00 (CP: 38.06) |
| NIKE, Inc. ( NKE) | Mar. 125.00 Calls | Stopped at 15.70 (CP: 14.50) |
| Fastenal Company ( FAST) | Feb. 42.50 Calls | Raise the option stop loss to 5.70 (CP: 7.20) |
| IntercontinentalExchange Inc. ( ICE) | Mar. 100.00 Calls | Stopped at 10.30 (CP: 10.00) |
| Phillips 66 ( PSX) | Feb. 60.00 Calls | Stopped at 10.50 (CP: 9.50) |
| Name | Option Symbol | Action | Stop Loss |
|---|---|---|---|
| Lumen Technologies Inc. - $10.42 | O: 21P11.00D16 | Buy the April 11.00 puts at 1.45 | 12.00 |
| Name | Option | Action |
|---|---|---|
|
|
||
| Name | Option Sym. | Call to Sell | Call Price | Investment for 500 Shares | Annual Called Rtn. | Annual Static Rtn. | Downside Protection |
|---|---|---|---|---|---|---|---|
| KeyCorp $15.84 | O: 21C16.00D19 | Mar. 16.00 | 0.95 | $7,321.90 | 31.53% | 20.63% | 5.10% |
| Name | Action |
|---|---|
| Marathon Petroleum Corp. (MPC) - 42.91 | Sell the April 45.00 Calls. |
| Phillips-Van Heusen Corporation (PVH) - 94.33 | Sell the March 90.00 Calls. |
| Comerica Incorporated (CMA) - 52.69 | Sell the April 57.50 Calls. |
| Delta Air Lines Inc. (DAL) - 41.74 | Sell the March 45.00 Calls. |
| General Motors (GM) - 41.92 | Sell the March 45.00 Calls. |
| Name | Covered Write |
|---|---|
| JD.COM INC ( JD - 82.61 ) | March 90.00 covered write. |
| Ventas, Inc. ( VTR - 49.05 ) | February 50.00 covered write. |
| Regions Financial Corporation ( RF - 15.54 ) | February 16.00 covered write. |
Daily Equity & Market Analysis
Loading, Please Wait...
