
Is Small Cap Value the real deal?
A constant talking point over the last couple of months has been the strength of small caps and laggard sectors rallying like energy and financials. The improvement of these areas has shaken up the US Styles view ranking quite significantly as the US Small Cap Growth group is the top-ranked asset class on the entire system with an average score of 5.04. The US Small Cap Blend group is now the only blend group scoring above 4.00 as it now sits at 4.02 with its improvement this week. The US Small Cap Value group has improved significantly, evidenced by its score direction of 2.07, the highest of any US-style group. The near-term improvement is noteworthy, but when we compare Small Cap Growth and Small Cap Value to the S&P 500 over the past year, we find glaring differences between the two groups.

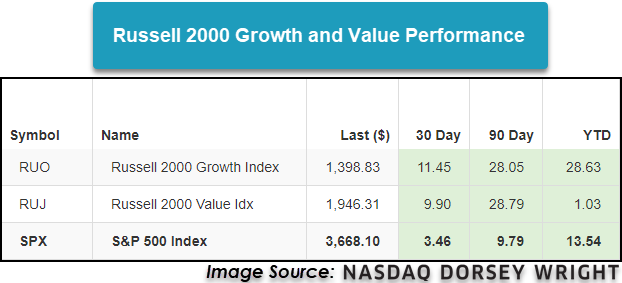
As we can see from the image above, the Russell 2000 Growth index has performed well and is above where it was prior to the March sell-off. Relative to the S&P 500, the Russell 2000 Growth Index is comfortably outperforming year-to-date. On the other hand, the Russell 2000 Value Index is barely in the black on the year returning 1.03%. While the Russell 2000 Growth Index has improved dramatically against the S&P 500 since March, the Russell 2000 Value Index has struggled to improve on a relative basis despite laggards rallying over the past several weeks.
Much of this dispersion can be explained by the underlying sector exposure of Small Cap Growth and Small Cap Value. The iShares Morningstar Small Value ETF's JKL top four sectors in order of exposure are financials, consumer cyclical, industrials, and utilities compared to the iShares Morningstar Small Growth ETF’s JKK top four of healthcare, technology, industrials, and consumer cyclical. The technology, consumer cyclical, industrials, and health care groups all possess scores above 4.00, further evidencing the strength behind small growth. On the other hand, small value does have an overweighting to consumer cyclical and industrials, but the financials group has yet to move above the 4.00 mark and the utilities group remains below the acceptable 3.00 mark.

As we look to end a quite unusual year, it is just as important as ever to make sure we stick to areas of the market exhibiting the most strength. While we’ve seen value areas of the market perform well lately, we have yet to see these groups take leadership over areas like technology and consumer cyclical which are usually growth-oriented. By keeping tabs on the Asset Class Group Scores page we can be prepared if/when there is a change in leadership and have a plan in place for such an event.
