
Most Requested Symbols

Today's featured stock is Beacon Roofing Supply, Inc. (BECN)
AAPL, MXIM, AEIS, POWI, CHTR, CVNA, FIVE, GKOS, IEX, & XPO.
Call: Apple (AAPL), Put: Lennar Corp (LEN), Covered Write: Phillips-Van Heusen Corp (PVH)
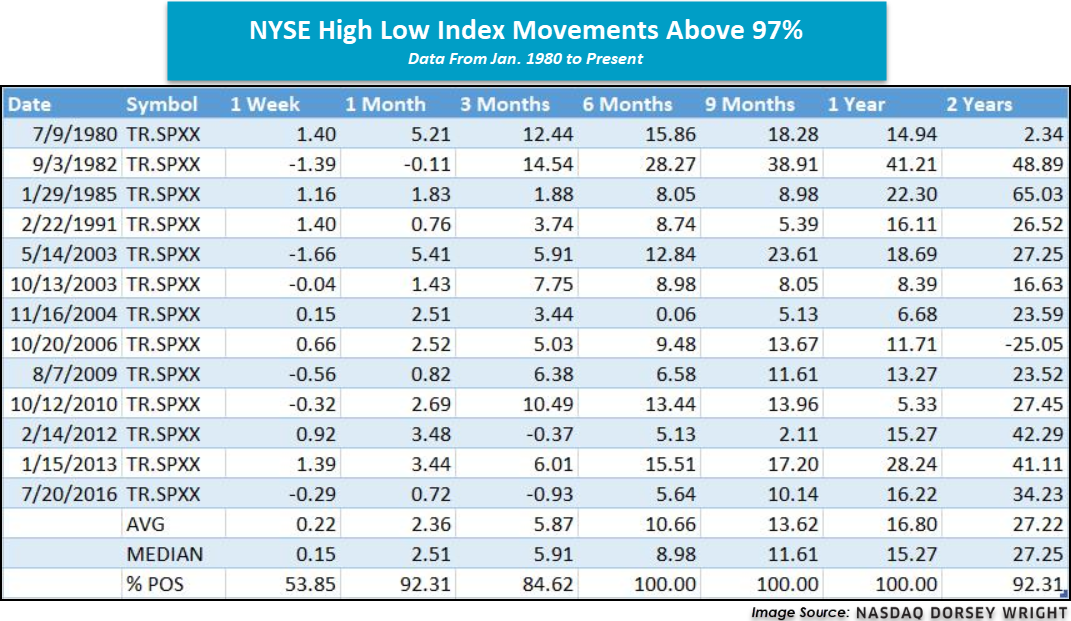
After a strong November, broad domestic equity markets continued to push higher in the first trading day of December, with SPX and NDX hitting intraday all-time highs. As a result of this strong market movement, we saw a number of our indicators reaching an elevated level, which begs the question if there’s any more room for the market to uptick. One indicator, in particular, that we want to discuss today is the NYSE High Low Index ^NYSEHILO, which measures the percentage of stocks making new highs relative to those making new highs and new lows in the NYSE. A moving average is then applied to the reading to smooth out the data.
^NYSEHILO had a reading of over 97% on 11/27, a level that we don’t often see with this chart. Given its rarity, we studied all of the previous occurrences where this indicator reached 97% or higher, and found that this event is only the 14th time since the beginning of 1980. Looking at the forward returns from one week to two years out with the past 13 instances, not only are they impressive, but they are also fairly consistent as shown in the table below. The percent of times that the returns are positive is high in all time frames from one month to two years. This suggests that when an indicator, such as this one, hits a high reading it doesn’t necessarily mean that the market can’t move any higher, as the indicator can remain at elevated levels for prolonged periods of time.

(Source: etf.com)
At various points previously, we have discussed the debate regarding active vs. passive management. Proponents of passive management insist that active managers cannot consistently outperform a passive benchmark and therefore investors are better off to invest in lower cost index funds. Meanwhile, those in the active camp maintain that through their analysis and expertise active managers can produce persistent alpha. The question of active vs. passive is often framed with the premise that active or passive is always superior and focuses largely on the U.S. equity market. However, all markets are not the same and so we should examine the merits of each style on a market-by-market basis instead of taking a one-size-fits-all approach.
The key determinate of which strategy, active or passive, is superior is market efficiency. Market efficiency describes the degree to which asset prices quickly and rationally adjust to reflect new information. In a highly efficient market, any new information is quickly incorporated into prices and therefore it is not possible to consistently achieve above average risk-adjusted returns in this type of market. Therefore, due to their lower cost, passive investment strategies are favored over active management in a highly-efficient market. In less efficient markets, on the other hand, the opportunity exists for skilled active managers to outperform passive strategies, thereby adding value for clients.
As mentioned above, the active vs. passive debate often examines only large cap U.S. equities, which is a natural starting point for the discussion – the large cap U.S. equity market is composed of the most well-known companies in the world and represents a large portion of many retirement portfolios. However, if we stop there we ignore what should be an obvious and fundamental element of the discussion – the various markets around the globe are unlikely to all be equally efficient. The very fact that those U.S. large cap companies are the most visible and researched firms in the world suggests that the U.S. large cap equity market is likely to be more efficient than its less-well-known counterparts!
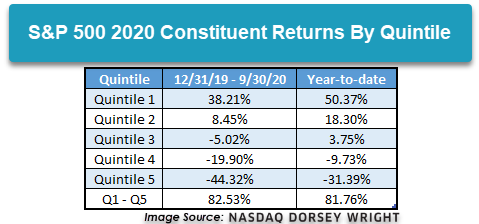
In addition to variation across markets, individual markets can also have different characteristics in distinct time periods. During the 10-year bull market from 2009 – 2019 active managers, especially in the U.S. large cap space, often struggled to match the performance of their benchmarks. One common refrain from the active camp during that time was that active managers were skilled at identifying quality and outperformed in down/volatile markets. 2020 has been one of the most volatile years in recent memory and there has been wide performance dispersion between the best performing and worst performing stocks. As the table below shows, there has been a performance spread north of 80% between the top and bottom quintiles of S&P 500 constituents; this dispersion has not narrowed significantly since the end of the third quarter even as laggard stocks rallied in November. This environment should offer opportunities for active management to add value via stock selection and sector allocation decisions.
In order to see if active managers have been able to capitalize on this environment, today we’ll take a look at rankings of passive benchmarks across five markets: U.S. large cap, U.S. small cap, international developed, emerging markets, and domestic fixed income. The graphs break each universe down into quartiles. If the passive fund is in the top two quartiles, that means that it outperformed more than half of the managers in that market. Each image shows where the benchmark ranked in each of the first three quarters and on a year-to-date basis (through the end of the third quarter as some active managers only report results on a quarterly basis). If you'd like to see how active managers have fared over longer periods, please take a look this article from earlier this year.

It does not appear that active managers in the US large cap space have been able to translate the bifurcated market and volatility of 2020 into consistent outperformance. The S&P 500 ranked in the top two quartiles in all three quarters and year-to-date. The index did not finish in the top quartile in any period, so it would not be surprising if some managers have been able to consistently beat the benchmark this year, but, on average they have lagged.

Small cap managers may have fared slightly better than their large cap counterparts as we can see that the Russell 2000 straddled the line between the second and third quartiles in each of the quarters. However, through the first three quarters cumulatively, the benchmark is above the 50% mark. On a relative basis, it appears that small cap managers may have actually done worse than usual, as over longer time periods the benchmark has often finished in the third quartile.

On average, international developed equity managers underperformed the EAFE index during the extreme volatility of Q120. However, in the subsequent two quarters the index ranked in the bottom half and finished in the third quartile through the first three quarters of the year, meaning that the average developed international manager has beaten the benchmark in 2020. This is similar to what we have observed over longer time periods.
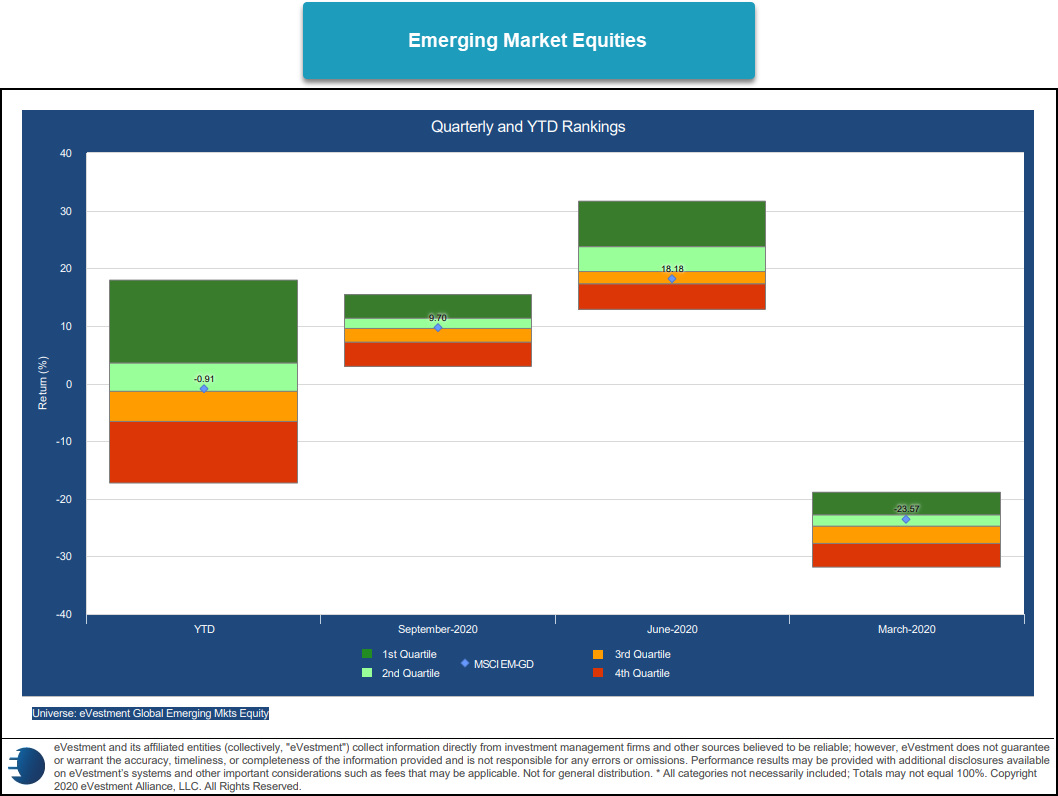
Active managers in emerging market equities have, on average, underperformed the MSCI Emerging Markets this year, if only slightly as the index sits just inside the second quartile through the first three quarters of the year. This is a departure from the longer-term trend, where we have often seen the index finish in the bottom half of the rankings.

The US Agg benchmark finished in the top quartile during the first quarter of the year as falling interest rates rewarded investors who held US Treasuries, while widening credit spreads were a headwind for holders of corporate bonds. Active managers regained significant ground in the second and third quarters, however, and as a result, the benchmark finished near the bottom of the third quartile. This is consistent with the longer-term trend which has seen fixed income managers consistently outperform the passive benchmark.
Overall, the market environment in 2020 does not appear to have been a catalyst for sustained outperformance by active managers as the longer-term (whether active or passive generally outperforms) seems to have been mostly sustained this year. When there were departures from the longer-term trend, more often than not, they seemed to break in the favor of passive management (the US Agg outperforming in Q1 and the EM index outperforming year-to-date, for example). This is not to say that there has been a structural shift in these markets that will tilt them in favor of passive management, but only that the increased volatility has not been the boon for active management that some proponents might have predicted.

First Trust Sector Model Change
There are two additions to the First Trust Sector Model FTRUST this week, and both are Energy. The First Trust Energy AlphaDEX ETF FXN and the First Trust Nasdaq Oil & Gas ETF FTXN were both added to the Sector Model. The addition of FXN and FTXN continues the rotation into the broader Energy sector that began last week with the addition of the First Trust Natural Gas ETF FCG, and is the second time we have seen a notable increase in the Energy exposure this year. That last time FXN and FTXN were members of the Model was from late April until the end of June/beginning of July. The addition of FXN and FTXN increases the number of holdings in the model to 15... (Read more)
SSTREET Change
As a refresher, the State Street Sector Model SSTREET monitors the Relative Strength (RS) relationships between each of the sector and industry ETFs in the model universe versus the S&P 500 Index SPX on a 6.5% scale. ETFs that are showing positive RS versus the SPX (measured by a column of Xs) are included in the model and are removed only when that relationship reverses into Os. Over the past week of trading, the respective RS charts comparing the SPDR S&P Oil & Gas Exploration & Production ETF XOP and the Energy Select Sector SPDR Fund XLE versus the S&P 500 Index reversed up into Xs, warranting their additions to the SSTREET model. This model remains fully invested through sector-based ETFs within the broader State Street family of ETFs and is evaluated on a weekly basis. The number of holdings can vary based on sector leadership within changing markets, and with the addition of XOP and XLE, the model is equally weighted across 18 positions at 5.55% each. Year-to-date, the SSTREET model is up 21.84%, outperforming the S&P 500's return of 12.52% (through 11/24)... (Read more)
iShares Sector Rotation Change
There is a change to the iShares Sector Rotation Model ISHRSECT this week: buy the iShares US Energy ETF IYE. ISHRSECT utilizes a relative strength versus benchmark methodology which compares each of the funds in the model universe against the iShares Dow Jones US ETF IYY. Those funds showing near-term relative strength against the benchmark (i.e. are in a column of Xs) are included in the portfolio and are removed only when they show weakness relative to the benchmark. When an addition or deletion is made, the portfolio is rebalanced so each position is equally weighted. IYE was added to the portfolio because it reversed up into a column of Xs on its relative strength chart against IYY, demonstrating short-term relative strength. This is the 12th change to the model this year... (Read more)
Average Level
42.61
| AGG | iShares US Core Bond ETF |
| USO | United States Oil Fund |
| DIA | SPDR Dow Jones Industrial Average ETF |
| DVY | iShares Dow Jones Select Dividend Index ETF |
| DX/Y | NYCE U.S.Dollar Index Spot |
| EFA | iShares MSCI EAFE ETF |
| FXE | Invesco CurrencyShares Euro Trust |
| GLD | SPDR Gold Trust |
| GSG | iShares S&P GSCI Commodity-Indexed Trust |
| HYG | iShares iBoxx $ High Yield Corporate Bond ETF |
| ICF | iShares Cohen & Steers Realty ETF |
| IEF | iShares Barclays 7-10 Yr. Tres. Bond ETF |
| LQD | iShares iBoxx $ Investment Grade Corp. Bond ETF |
| IJH | iShares S&P 400 MidCap Index Fund |
| ONEQ | Fidelity Nasdaq Composite Index Track |
| QQQ | Invesco QQQ Trust |
| RSP | Invesco S&P 500 Equal Weight ETF |
| IWM | iShares Russell 2000 Index ETF |
| SHY | iShares Barclays 1-3 Year Tres. Bond ETF |
| IJR | iShares S&P 600 SmallCap Index Fund |
| SPY | SPDR S&P 500 Index ETF Trust |
| TLT | iShares Barclays 20+ Year Treasury Bond ETF |
| GCC | WisdomTree Continuous Commodity Index Fund |
| VOOG | Vanguard S&P 500 Growth ETF |
| VOOV | Vanguard S&P 500 Value ETF |
| EEM | iShares MSCI Emerging Markets ETF |
| XLG | Invesco S&P 500 Top 50 ETF |

| Symbol | Company | Sector | Current Price | Action Price | Target | Stop | Notes |
|---|---|---|---|---|---|---|---|
| ACN | Accenture PLC | Business Products | $249.09 | 230s - 240s | 216 | 208 | 5 for 5'er, top 1/2 of BUSI sector matrix, LT pos RS, spread triple top, 1.5% yield Earnings 12/17 |
| SAIL | SailPoint Technologies Holdings, Inc. | Software | $46.56 | mid 40s | $66 | $35 | 4 for 5'er, pullback from ATH, consec buy signals, pos trend |
| LPX | Louisiana-Pacific Corporation | Forest Prods/Paper | $34.23 | low 30s | 45.50 | 27 | 4 for 5'er, top third of FORE sector matrix, bullish triangle, pos wkly mom flip, 1.8% yield |
| TGTX | TG Therapeutics, Inc. | Biomedics/Genetics | $29.34 | upper 20s to mid 30s | 45.50 | 25 | 5 for 5'er, bullish triangle pattern, consec buy signals, testing multi-year high, pos trend |
| MXL | MaxLinear, Inc. | Semiconductors | $31.25 | 28 - 31 | 41 | 24 | 4 for 5'er, top third of SEMI sector matrix, spread six top breakout, R-R>2.0 |
| AOS | A.O. Smith Corporation | Building | $56.31 | mid to upper 50s | 72 | 47 | 4 for 5'er, four consec buy signals, mutli-year high, market RS buy signal since 9/2008, 1.86% yield |
| GOOS | Canada Goose Holdings Inc. | Textiles/Apparel | $33.24 | mid-to-upper 30s | 39.50 | 30 | 4 for 5'er, top 25% of favored TEXT sector matrix, triple top breakout, pot. cov. write |
| ALLY | Ally Financial Inc. | Finance | $29.65 | $29 - $32 | 33 | 25 | 5 for 5'er, top 10% of FINA sector matrix, mutliple consec buy signals, 2.45% yield, pot. cov. write |
| SPWR | Sunpower Corporation | Electronics | $22.16 | low 20s | 33.50 | 18 | 5 for 5'er, #3 of 59 names in ELEC sector matrix, pos wkly mom flip, pot cov. write |
| BECN | Beacon Roofing Supply, Inc. | Building | $36.39 | 36 - 40 | 56 | 30 | 4 for 5'er, top third of fav DWABUIL, consec buy signals, 52 week highs, pos weekly mom flip |
| Symbol | Company | Sector | Current Price | Action Price | Target | Stop | Notes |
|---|
| Symbol | Company | Sector | Current Price | Action Price | Target | Stop | Notes |
|---|---|---|---|---|---|---|---|
| BLMN | Bloomin' Brands Inc | Restaurants | $17.50 | 15 - 17 | 21 | 14 | See follow comment below. |
| Comment |
|---|
| BLMN Bloomin' Brands Inc R ($17.96) - Restaurants - Okay to add new exposure here. We will raise our stop to $14, which would take out multiple levels of support on BLMN's 0.25pt chart. |
| TSM Taiwan Semiconductor Manufacturing Co. R (Taiwan) ADR ($102.48) - Semiconductors - Raise stop to $83, which would violate multiple levels of support on the default chart. |
| ROKU Roku, Inc. Class A R ($287.84) - Media - Raise stop to $220, the first sell signal on the chart. |
| Z Zillow Group Inc. Class C R ($107.96) - Real Estate - Raise stop to $88, the bullish support line. |
| TSLA Tesla Inc. R ($582.69) - Autos and Parts - Raise stop to $488, the first sell signal on TSLA's 4 pt chart. |
BECN Beacon Roofing Supply, Inc. R ($36.48) - Building - BECN is a healthy 4 for 5'er that ranks within the top third of the building sector, making this one of the stronger names in this favored space. BECN has given two consecutive buy signals and is trading at 52-week highs just one box off of a third consecutive buy signal at $39. Furthermore, BECN just experienced a flip to positive weekly momentum, suggesting the potential for higher prices. Okay to add exposure between 36 - 40. We will set our initial stop at $30 and we will use BECN's bullish price objective of $56 as our near-term price target.
| 19 | 20 | ||||||||||||||||||||||||||||||||||||||||||||||||||||
| 42.00 | X | • | Top | 42.00 | |||||||||||||||||||||||||||||||||||||||||||||||||
| 41.00 | X | O | • | • | 41.00 | ||||||||||||||||||||||||||||||||||||||||||||||||
| 40.00 | 9 | O | • | 5 | • | 40.00 | |||||||||||||||||||||||||||||||||||||||||||||||
| 39.00 | X | O | • | X | O | • | 39.00 | ||||||||||||||||||||||||||||||||||||||||||||||
| 38.00 | X | O | • | 2 | X | X | O | • | X | X | 38.00 | ||||||||||||||||||||||||||||||||||||||||||
| 37.00 | • | O | • | X | O | X | O | X | O | 7 | • | • | X | X | O | X | 37.00 | ||||||||||||||||||||||||||||||||||||
| 36.00 | A | • | X | O | X | O | X | O | X | O | • | • | X | X | • | X | O | X | O | X | 36.00 | ||||||||||||||||||||||||||||||||
| 35.00 | O | X | X | X | O | X | 3 | 4 | O | X | O | X | X | • | X | O | X | O | • | X | X | O | X | O | 35.00 | ||||||||||||||||||||||||||||
| 34.00 | O | X | O | X | O | X | O | O | X | 6 | X | 8 | X | O | B | O | X | O | X | O | • | X | O | X | O | B | Mid | 34.00 | |||||||||||||||||||||||||
| 33.00 | O | X | O | X | O | X | O | X | O | • | O | 9 | O | X | O | 1 | O | X | O | • | X | X | O | X | O | X | 33.00 | ||||||||||||||||||||||||||
| 32.00 | O | O | X | C | 1 | O | • | • | O | X | A | X | O | X | 2 | X | O | X | • | 8 | O | X | 9 | A | O | X | 32.00 | ||||||||||||||||||||||||||
| 31.00 | O | X | O | X | • | O | X | O | X | O | X | O | • | O | 3 | O | • | X | O | X | O | X | O | 31.00 | |||||||||||||||||||||||||||||
| 30.00 | O | X | X | O | X | • | O | X | O | O | X | • | O | X | O | • | X | X | O | O | X | 30.00 | |||||||||||||||||||||||||||||||
| 29.00 | O | B | O | X | O | • | O | X | C | • | O | X | O | • | X | O | X | X | O | X | 29.00 | ||||||||||||||||||||||||||||||||
| 28.00 | O | X | O | X | • | O | X | • | O | O | • | X | O | X | O | 7 | O | 28.00 | |||||||||||||||||||||||||||||||||||
| 27.00 | O | X | O | X | • | O | O | • | 6 | O | X | O | X | Bot | 27.00 | ||||||||||||||||||||||||||||||||||||||
| 26.00 | O | X | O | • | O | • | X | O | X | O | X | 26.00 | |||||||||||||||||||||||||||||||||||||||||
| 25.00 | O | • | • | O | • | X | O | O | 25.00 | ||||||||||||||||||||||||||||||||||||||||||||
| 24.00 | • | O | • | • | X | • | 24.00 | ||||||||||||||||||||||||||||||||||||||||||||||
| 23.00 | O | X | • | X | • | 23.00 | |||||||||||||||||||||||||||||||||||||||||||||||
| 22.00 | O | X | O | X | • | 22.00 | |||||||||||||||||||||||||||||||||||||||||||||||
| 21.00 | O | X | X | O | X | • | 21.00 | ||||||||||||||||||||||||||||||||||||||||||||||
| 20.00 | O | X | O | X | 5 | X | • | 20.00 | |||||||||||||||||||||||||||||||||||||||||||||
| 19.50 | O | X | O | X | O | X | • | 19.50 | |||||||||||||||||||||||||||||||||||||||||||||
| 19.00 | O | X | X | O | X | X | X | O | X | • | 19.00 | ||||||||||||||||||||||||||||||||||||||||||
| 18.50 | O | X | O | X | O | X | O | X | O | X | O | X | • | 18.50 | |||||||||||||||||||||||||||||||||||||||
| 18.00 | O | X | O | X | O | X | O | X | O | X | O | X | • | 18.00 | |||||||||||||||||||||||||||||||||||||||
| 17.50 | O | X | O | X | O | X | O | X | O | X | O | • | 17.50 | ||||||||||||||||||||||||||||||||||||||||
| 17.00 | O | O | X | O | X | O | X | O | X | • | 17.00 | ||||||||||||||||||||||||||||||||||||||||||
| 16.50 | O | X | X | O | X | O | X | O | • | 16.50 | |||||||||||||||||||||||||||||||||||||||||||
| 16.00 | O | X | O | X | O | X | O | • | 16.00 | ||||||||||||||||||||||||||||||||||||||||||||
| 15.50 | O | X | O | X | O | X | • | 15.50 | |||||||||||||||||||||||||||||||||||||||||||||
| 15.00 | O | X | O | X | 4 | X | • | 15.00 | |||||||||||||||||||||||||||||||||||||||||||||
| 14.50 | O | O | X | O | X | • | 14.50 | ||||||||||||||||||||||||||||||||||||||||||||||
| 14.00 | O | X | O | X | • | 14.00 | |||||||||||||||||||||||||||||||||||||||||||||||
| 13.50 | O | X | O | X | • | 13.50 | |||||||||||||||||||||||||||||||||||||||||||||||
| 13.00 | O | X | O | • | 13.00 | ||||||||||||||||||||||||||||||||||||||||||||||||
| 12.50 | O | X | • | 12.50 | |||||||||||||||||||||||||||||||||||||||||||||||||
| 12.00 | O | • | 12.00 | ||||||||||||||||||||||||||||||||||||||||||||||||||
| 19 | 20 |
| AAPL Apple Inc. ($122.42) - Computers - Shares of AAPL moved higher Tuesday to complete a bullish triangle at $122, marking its second consecutive buy signal. This 3 for 5'er has maintained a positive trend since early-2005 and been on an RS buy signal against the market since 2004. Weekly momentum also just flipped positive, suggesting the potential for further upside from here. Those looking to add exposure may consider AAPL at current levels, with initial support offered at $114. Further support can be found at $108, $106, and $104. |
| AEIS Advanced Energy Industries ($98.16) - Electronics - AEIS reversed up into a column of Xs Tuesday and broke a double top at $99, marking its third consecutive buy signal before reaching a new all-time high at $100 intraday. This 4 for 5'er moved to a positive trend in October and ranks in the top quartile of the electronics sector RS matrix. The weight of the evidence is positive here, however, AEIS is now heavily overbought with an intraday OBOS reading of 148%. Those looking to add exposure may be best served to wait for a pullback or normalization of the trading band. Initial support can be found at $95 with further support offered at $84. |
| CHTR Charter Communications, Inc. ($661.31) - Media - CHTR broke a spread triple top at $664 on Tuesday, marking the second consecutive buy signal on the chart and a new all-time high. CHTR is a solid 5 for 5’er within the media sector that has experienced three weeks of positive weekly momentum. From here, support sits at $608. |
| CVNA Carvana Company ($251.31) - Autos and Parts - CVNA broke a double top at $252 and is now trading at new highs. This stock is a solid 4 for 5’er within the favored autos and parts sector that has experienced two weeks of positive weekly momentum. From here, support sits at $236. |
| FIVE Five Below Inc ($161.03) - Household Goods - FIVE broke a double top at $160 before moving higher to $162 on Tuesday, making a new all-time high on the chart. FIVE is a perfect 5 for 5’er within the favored household goods sector that has maintained a long-term market RS buy signal since February 2016. From here, support sits at $140. |
| GKOS Glaukos Corp. ($67.95) - Healthcare - GKOS shares moved higher to break a double top at $69 to mark its fifth consecutive buy signal. This 5 for 5'er has been in a positive trend since September and on an RS buy signal since October. Recent price action has put GKOS into heavily overbought territory with a weekly overbought/oversold reading of 76% and those wishing to initiate a long position may be best served to wait for a pullback. From here, support can be found at $64. |
| IEX IDEX Corporation ($195.14) - Machinery and Tools - Shares of IEX reversed up into a column of X's on Tuesday and now reside one box away from completing a bullish catapult pattern, where a break would also result in a new all-time high. The 4 for 5'er resides in the favored machinery and tools sector and demonstrates positive long-term relative strength versus the market, remaining on an RS buy signal since 2000 and in a column of X's since 2013. The weight of the evidence is positive and initial support is offered around $190. |
| MXIM Maxim Integrated Products Inc ($84.45) - Semiconductors - MXIM moved higher Tuesday to complete a shakeout pattern with a triple top break at $84, marking a new multi-year high. This 3 for 5'er moved to a positive trend in April and ranks in the top half of the semiconductors sector RS matrix. The stock has also been on an RS buy signal against the market since early-2018. The technical picture is strong here, however, the recent price appreciation has left MXIM in overbought territory. Initial support can be found at $79. |
| POWI Power Integrations Inc ($72.81) - Semiconductors - Shares of POWI advanced Tuesday to break a double top at $72, marking its fourth consecutive buy signal before moving to a new all-time high at $73 intraday. This 3 for 5'er moved to a positive trend in October and has maintained an RS buy signal against the market since July of last year. Monthly momentum also just flipped positive, suggesting the potential for further upside from here. The technical picture is strong and continues to improve, however, POWI is now in overbought territory. Those looking to add exposure may look to wait for a pullback or normalization of the trading band. Initial support can be found at $68 with further support offered at $65. |
| XPO XPO Logistics Inc ($110.42) - Transports/Non Air - Shares of XPO broke a double top on Tuesday at $110, resulting in a third consecutive buy signal and multi-year chart high. The 5 for 5'er ranks in the top quartile of the transports/non air group and demonstrates positive long-term relative strength versus the market, remaining on an RS buy signal since August of 2019. Demand is in control. Initial support is offered around $102. |
| Name | Option Symbol | Action | Stop Loss |
|---|---|---|---|
| Apple Inc. - $122.72 | AAPL2116D120 | Buy the April 120.00 calls at 12.35 | 112.00 |
| Name | Option | Action |
|---|---|---|
| Freeport-McMoRan Inc. ( FCX) | Jan. 16.00 Calls | Raise the option stop loss to 5.65 (CP: 7.65) |
| T-Mobile US Inc. ( TMUS) | Jan. 115.00 Calls | Raise the option stop loss to 16.25 (CP: 18.25) |
| Viacom CBS Inc. ( VIAC) | Jan. 26.00 Calls | Raise the option stop loss to 8.30 (CP: 10.30) |
| Texas Instruments Incorporated ( TXN) | Mar. 145.00 Calls | Raise the option stop loss to 19.15 (CP: 21.15) |
| IntercontinentalExchange Inc. ( ICE) | Mar. 100.00 Calls | Raise the option stop loss to 7.50 (CP: 9.50) |
| QUALCOMM Incorporated ( QCOM) | Mar. 140.00 Calls | Initiate a stock price stop of 16.15 (CP: 151.00) |
| Name | Option Symbol | Action | Stop Loss |
|---|---|---|---|
| Lennar Corporation - $73.23 | LEN2119N75 | Buy the February 75.00 puts at 7.20 | 79.00 |
| Name | Option | Action |
|---|---|---|
| Johnson & Johnson (JNJ) | Mar. 155.00 Puts | Stopped at 12.40 (CP: 11.60) |
| Name | Option Sym. | Call to Sell | Call Price | Investment for 500 Shares | Annual Called Rtn. | Annual Static Rtn. | Downside Protection |
|---|---|---|---|---|---|---|---|
| Phillips-Van Heusen Corporation $79.49 | PVH2119C90 | Mar. 90.00 | 6.80 | $37,943.00 | 59.21% | 26.34% | 7.23% |
| Name | Action |
|---|---|
| QUALCOMM Incorporated (QCOM) - 147.17 | Sell the March 150.00 Calls. |
| The Chemours Company (CC) - 24.33 | Sell the April 24.00 Calls. |
| OneMain Holdings Inc. (OMF) - 38.99 | Sell the February 40.00 Calls. |
| Marathon Petroleum Corp. (MPC) - 38.88 | Sell the April 45.00 Calls. |
| JD.COM INC (JD) - 85.35 | Sell the March 90.00 Calls. |
| LM Ericsson Telephone Company (Sweden) ADR (ERIC) - 12.24 | Sell the April 13.00 Calls. |
| Welltower Inc. (WELL) - 62.98 | Sell the March 65.00 Calls. |
| Name | Covered Write |
|---|---|
|
|
|
Daily Equity & Market Analysis
Loading, Please Wait...
