
Most Requested Symbols

As we move into the month of November, we are once again reminded of the tendencies of market seasonality.
The average distribution reading is -34.27% oversold.
Today's featured stock is Ryder Systems Inc. (R).
SNBR, VC, FTCH, PNTG, LITE, ENPH, EXLS, ALB, & CCK
Call: Ameriprise Financial (AMP); Put: Aflac (AFL), Covered Write: Ryder System Inc (R)
Pre-Election Market Update Replay Available – If you missed our Pre-Election Market Update webinar on Thursday, we now have a replay available to view on demand. In this webinar, the NDW analyst team discussed the current state of the domestic equity market, historical election cycle comparisons, and what areas we are monitoring as we look towards the end of the year.
Click here to access the webinar replay
Click here to access the presentation slides
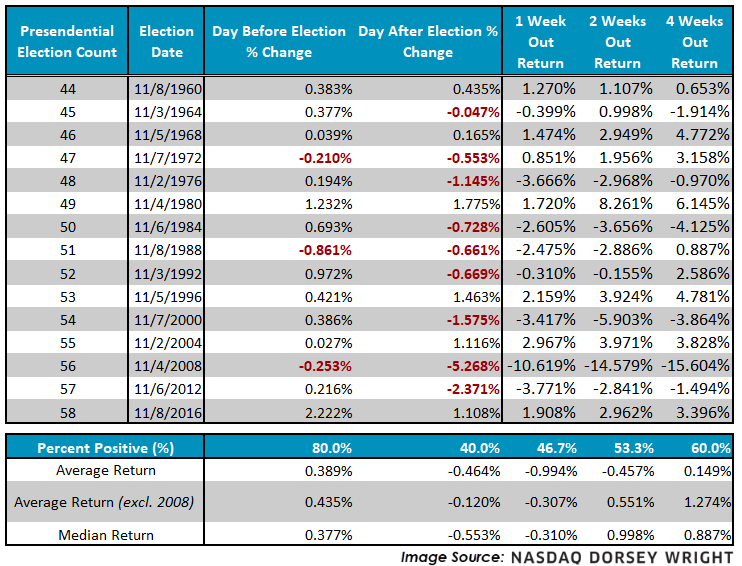
With the 59th United States Presidential Election on deck, we will share a few data points regarding short-term market returns and volatility.
Beginning with short-term market movement, since 1960 Election Day has historically been prefaced by green on the screen. In fact, using the S&P 500 (SPX) as an equity market proxy, we find that 80% of single day sessions leading up to Election Day close positive, and today (11/2) added to that majority with SPX gaining 1.23%. However, we find that only 40% of single day returns after an election close green. As we look beyond the immediate horizon, we note a mixed basket in the near-term (1 and 2 week) with slightly steadier gains further out (4 week).
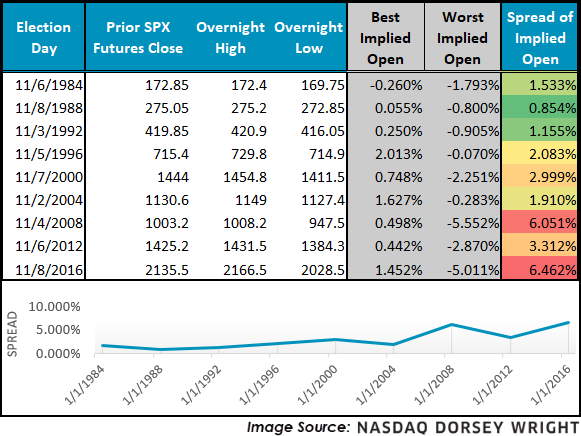
In addition, although the open and close spread for major indices like the S&P 500 can be elevated during times like these, to gain further insight on historical volatility we looked at index futures dating back to 1982 (inception). Using high and low values for the contracts, we calculated a “best implied - ” and “worst implied open” scenario, looking at the high and low, respectively, to see what the index change would have been if it were to begin trading at that watermark. The last election (2016) produced the highest spread on record in our study, yet since 1982 we note a generally increasing spread between the high and low values. Although we may attribute this to more futures contracts trading now compared to 25+ years ago, evidence may also suggest increased market sensitivity in related political episodes.
Although the findings presented above are not designed to be predictive by nature, it will certainly be interesting to see if the observed trends hold in a rather anomalistic year like 2020.

With the start of November, we have also officially moved into the “seasonally strong” half of the year, which lasts from November through May. We are all familiar with the saying "sell in May and go away," which conjectures that we would do just as well to sell all of our holdings as we would be invested in the market during the months of May through November. Typically, conjecture doesn’t mature into an adage without basis and market seasonality is just such an example as it has shown an impressive trend in terms of magnitude, consistency, and longevity. We’ve discussed seasonality many times over the years and as we switch between seasonally biased periods, we wanted to revisit the subject today.
The end of the day’s trading on Friday, October 30 also brought with it the end of the seasonally weak period, which began with the close of the market on Thursday, April 30. Over this period, the Dow Jones Industrial Average DJIA returned 8.86%, which is well above the average return during the seasonally week period.
Years ago, we began using the Stock Trader's Almanac, a reference tool published by Yale Hirsch that has been a fantastic source of information on the stock market ever since. In fact, we always order several copies for the office each year (if you would like a copy, you can visit www.stocktradersalmanac.com). The premise of the "Market Seasonality" study is that historically speaking, the market performs far better during the November through May time period than it does from May through November. On its own, that isn't a particularly profound statement, however, when we examine the magnitude of this effect over the years, its significance becomes clear. Consider this: if you had invested $10,000 in the Dow Jones on April 30 and sold it on October 31 each year since 1950, your cumulative return would be only about $12,750. Meanwhile, the same $10,000, invested only during the seasonally strong six months of the year, would now be worth just under $1 million! Put another way, almost all the growth of the Dow since 1950 has effectively occurred during the "good" six months of the year.
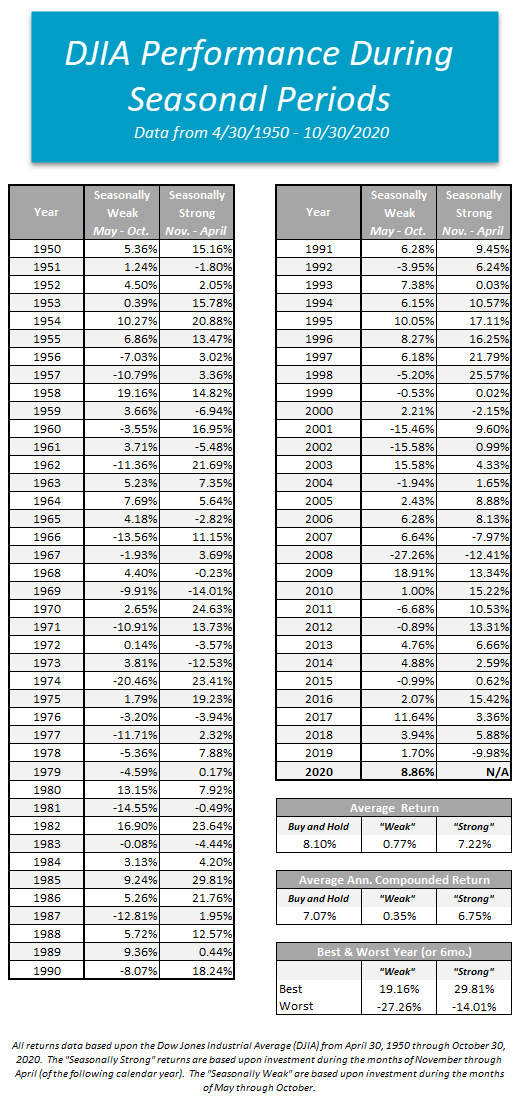
In the graph below, we have reproduced the US Market Seasonality strategy that was first published in the Stock Trader's Almanac beginning in 1950 based upon the Dow Jones Industrial Average. The green line reflects the seasonally weak period, while the red line shows the seasonally strong six months. You will note that a theoretical $10,000 initial investment in 1950 is barely on the positive side when invested only from May through November. On the other hand, an identical $10,000 initial investment grew to $972,201 with an average annualized return of 6.75% if invested only from November through May each year.

There's no question that the November through May period has provided substantially better returns. Whether you average it out, annualize it, compound it, or complicate it further; there is clearly a widespread between the average six-month returns during these contrasting seasonal periods.
Market Seasonality Notes:
We acknowledge that this study is not a sophisticated tool for risk management, but it is interesting and does expose biases within the market that many investors are not aware of. As we mentioned above, we are coming off a seasonally weak period in the market which saw the Dow produce a gain of 8.86%, well above the average return of 0.77%. Despite the elevated volatility felt throughout the most recent seasonally weak period due to the uncertainty surrounding the coronavirus pandemic, tomorrow’s US presidential election, and stimulus talks, among other things, the US equities asset class strengthened enough to move back into the top spot in DALI in August where it remains today with 272 buy signals in its favor. Furthermore, with today’s (11/2) action, we have seen the S&P 500 bounce after falling -5.64% over the last seven days, which marked the worst single week for the index since March. Today’s move to 3,330 has caused a reversal up into Xs on the SPX, which remains on a sell signal trading in an overall positive trend. Additionally, the Bullish Percent for NYSE BPNYSE, which reversed down into Os last week, ticked lower to 46% after Friday’s market action, giving us a more defensive posture on a near-term basis despite a solid longer-term ranking. That said, although we are now entering what has been the traditionally strong period for the market, this does not guarantee that we will see a strong equity market over the next six months. It does, however, provide an opportunity to consider seasonal strategies that can position portfolios to take advantage of these historical biases. We will discuss a few such strategies in this report over the next couple of days.
Average Level
-34.27
| AGG | iShares US Core Bond ETF |
| USO | United States Oil Fund |
| DIA | SPDR Dow Jones Industrial Average ETF |
| DVY | iShares Dow Jones Select Dividend Index ETF |
| DX/Y | NYCE U.S.Dollar Index Spot |
| EFA | iShares MSCI EAFE ETF |
| FXE | Invesco CurrencyShares Euro Trust |
| GLD | SPDR Gold Trust |
| GSG | iShares S&P GSCI Commodity-Indexed Trust |
| HYG | iShares iBoxx $ High Yield Corporate Bond ETF |
| ICF | iShares Cohen & Steers Realty ETF |
| IEF | iShares Barclays 7-10 Yr. Tres. Bond ETF |
| LQD | iShares iBoxx $ Investment Grade Corp. Bond ETF |
| IJH | iShares S&P 400 MidCap Index Fund |
| ONEQ | Fidelity Nasdaq Composite Index Track |
| QQQ | Invesco QQQ Trust |
| RSP | Invesco S&P 500 Equal Weight ETF |
| IWM | iShares Russell 2000 Index ETF |
| SHY | iShares Barclays 1-3 Year Tres. Bond ETF |
| IJR | iShares S&P 600 SmallCap Index Fund |
| SPY | SPDR S&P 500 Index ETF Trust |
| TLT | iShares Barclays 20+ Year Treasury Bond ETF |
| GCC | WisdomTree Continuous Commodity Index Fund |
| VOOG | Vanguard S&P 500 Growth ETF |
| VOOV | Vanguard S&P 500 Value ETF |
| EEM | iShares MSCI Emerging Markets ETF |
| XLG | Invesco S&P 500 Top 50 ETF |

| Symbol | Company | Sector | Current Price | Action Price | Target | Stop | Notes |
|---|---|---|---|---|---|---|---|
| ARNC | Arconic Corp. | Metals Non Ferrous | $21.74 | low 20s | 29.50 | 18 | 5 for 5'er, #2 of 14 in favored META sector matrix, triple top breakout, pot. covered write, Earn. 11/5 |
| LOW | Lowe's Companies, Inc. | Building | $158.10 | 170s to low 180s | 230 | 150 | 5 for 5'er, top half of favored BUI sector matrix, quad top breakout, pos wkly mom flip, LT pos mkt RS, 1.4% yield Earnings 11/18 |
| CDNS | Cadence Design Systems, Inc. | Software | $109.37 | upper $110s to low $120s | $159 | $90 | 5 for 5'er, pullback from all-time high, LT market RS buy signal, pos weekly momentum |
| AVGO | Broadcom Ltd | Semiconductors | $349.63 | 360s - 380s | 468 | 300 | 4 for 5'er, top 20% of SEMI sector matrix, triple top breakout, 3.5% yield |
| APH | Amphenol Corporation | Electronics | $112.84 | mid 100s to upper 110s | 152 | 93 | 5 for 5'er, all-time high, LT market & peer RS buy signal, 2 weeks pos weekly mom |
| AN | Autonation Inc. | Autos and Parts | $56.73 | hi 50s - low 60s | 100 | 50 | 5 for 5'er, top 10% of favored AUTO sector matrix, pullback from ATH, pot cov. write R-R>3.0 |
| SCHN | Schnitzer Steel Industries | Steel/Iron | $21.00 | 19 - 21 | 32.50 | 16.50 | 3 for 5'er, top half of favored STEE sector matrix, bullish catapult, 3.7% yield, R-R>3.0 |
| RCII | Rent-A-Center, Inc. | Retailing | $30.90 | low to mid 30s | 65 | 24 | 5 for 5'er, 5 consec buy signals, LT peer RS buy, pos weekly & mon momentum, 3.59% yield |
| LH | Laboratory Corp. of America Holdings | Healthcare | $199.77 | 190s - low 200s | 216 | 170 | 4 for 5'er, top half of HEAL sector matrix, LT pos mkt RS, pullback from ATH |
| R | Ryder System, Inc. | Transports/Non Air | $49.26 | hi 40s - low 50s | 63 | 40 | 4 for 5'er, top 20% on TRAN sector matrix, multiple buy signals, 4.4% yield, pot. covered write |
| Symbol | Company | Sector | Current Price | Action Price | Target | Stop | Notes |
|---|
| Comment |
|---|
| SHW The Sherwin-Williams Company R ($705.33) - Building - We will now raise our stop $565 the second potential sell signal on SHW's default chart. |
| DNKN Dunkin Brands Group Inc R ($106.09) - Restaurants - We will now raise our stop to $86, the second potential sell signal on DNKN's $0.50 chart. |
R Ryder System, Inc. R ($49.86) - Transports/Non Air - R is a 4 for 5'er that ranks in the top quintile of the transports/non air sector matrix. On its default chart, R has given three consecutive buy signals, most recently completing a double top at $46. The stock also has strong income potential as it comes with a 4.4% yield and offers a potential covered write opportunity on the Feb '21 call options. Long exposure may be added in the upper $40s to lower $50s and we will set our initial stop at $40, the first potential sell signal on R's default chart. We will use the bullish price objective, $63, as our target price.
| 20 | |||||||||||||||||||||||||||||||||||||||||||||||||||||
| 67.00 | X | • | 67.00 | ||||||||||||||||||||||||||||||||||||||||||||||||||
| 66.00 | X | O | • | 66.00 | |||||||||||||||||||||||||||||||||||||||||||||||||
| 65.00 | X | O | • | 65.00 | |||||||||||||||||||||||||||||||||||||||||||||||||
| 64.00 | 4 | O | X | • | 64.00 | ||||||||||||||||||||||||||||||||||||||||||||||||
| 63.00 | X | O | X | O | • | 63.00 | |||||||||||||||||||||||||||||||||||||||||||||||
| 62.00 | X | O | X | O | • | 62.00 | |||||||||||||||||||||||||||||||||||||||||||||||
| 61.00 | X | 5 | X | O | X | • | • | 61.00 | |||||||||||||||||||||||||||||||||||||||||||||
| 60.00 | X | O | O | X | O | X | • | 60.00 | |||||||||||||||||||||||||||||||||||||||||||||
| 59.00 | X | O | X | O | 7 | X | O | • | 59.00 | ||||||||||||||||||||||||||||||||||||||||||||
| 58.00 | O | O | X | X | O | X | O | • | • | 58.00 | |||||||||||||||||||||||||||||||||||||||||||
| 57.00 | O | X | O | X | O | X | O | • | X | • | 57.00 | ||||||||||||||||||||||||||||||||||||||||||
| 56.00 | O | X | O | X | O | X | O | • | • | • | X | O | • | 56.00 | |||||||||||||||||||||||||||||||||||||||
| 55.00 | O | X | O | X | O | X | O | X | • | X | • | • | • | 1 | O | • | 55.00 | ||||||||||||||||||||||||||||||||||||
| 54.00 | O | 6 | O | O | O | X | X | O | X | O | X | • | X | • | X | O | • | 54.00 | |||||||||||||||||||||||||||||||||||
| 53.00 | O | X | O | X | O | X | O | X | O | X | O | X | O | X | O | • | Top | 53.00 | |||||||||||||||||||||||||||||||||||
| 52.00 | O | X | O | X | O | X | O | X | O | X | O | X | O | X | O | • | 52.00 | ||||||||||||||||||||||||||||||||||||
| 51.00 | O | 8 | X | O | X | O | X | O | X | C | • | O | • | O | 2 | • | X | 51.00 | |||||||||||||||||||||||||||||||||||
| 50.00 | O | 9 | O | X | O | B | O | • | • | O | X | O | • | X | 50.00 | ||||||||||||||||||||||||||||||||||||||
| 49.00 | O | X | X | A | X | O | X | • | O | X | O | • | X | 49.00 | |||||||||||||||||||||||||||||||||||||||
| 48.00 | O | X | O | X | O | O | X | • | O | O | • | X | 48.00 | ||||||||||||||||||||||||||||||||||||||||
| 47.00 | O | X | O | X | O | • | O | • | X | 47.00 | |||||||||||||||||||||||||||||||||||||||||||
| 46.00 | O | O | X | • | O | • | X | 46.00 | |||||||||||||||||||||||||||||||||||||||||||||
| 45.00 | O | O | • | X | X | 45.00 | |||||||||||||||||||||||||||||||||||||||||||||||
| 44.00 | O | • | X | X | O | A | Mid | 44.00 | |||||||||||||||||||||||||||||||||||||||||||||
| 43.00 | O | • | X | X | O | X | O | X | 43.00 | ||||||||||||||||||||||||||||||||||||||||||||
| 42.00 | O | • | X | O | X | O | 9 | O | X | 42.00 | |||||||||||||||||||||||||||||||||||||||||||
| 41.00 | O | X | • | X | O | X | O | X | O | 41.00 | |||||||||||||||||||||||||||||||||||||||||||
| 40.00 | O | X | O | X | O | X | O | X | 40.00 | ||||||||||||||||||||||||||||||||||||||||||||
| 39.00 | O | X | O | X | O | X | X | O | 8 | 39.00 | |||||||||||||||||||||||||||||||||||||||||||
| 38.00 | O | O | X | O | X | O | 7 | O | X | 38.00 | |||||||||||||||||||||||||||||||||||||||||||
| 37.00 | O | 6 | O | X | O | X | O | X | 37.00 | ||||||||||||||||||||||||||||||||||||||||||||
| 36.00 | O | X | O | O | X | O | • | Bot | 36.00 | ||||||||||||||||||||||||||||||||||||||||||||
| 35.00 | 3 | X | X | X | O | • | 35.00 | ||||||||||||||||||||||||||||||||||||||||||||||
| 34.00 | O | X | X | O | X | O | X | • | 34.00 | ||||||||||||||||||||||||||||||||||||||||||||
| 33.00 | O | X | O | X | O | X | O | X | • | 33.00 | |||||||||||||||||||||||||||||||||||||||||||
| 32.00 | O | X | O | X | X | 5 | O | X | • | 32.00 | |||||||||||||||||||||||||||||||||||||||||||
| 31.00 | O | O | X | O | X | X | O | X | • | 31.00 | |||||||||||||||||||||||||||||||||||||||||||
| 30.00 | O | X | O | X | O | X | O | X | • | 30.00 | |||||||||||||||||||||||||||||||||||||||||||
| 29.00 | O | X | O | X | O | X | O | X | • | 29.00 | |||||||||||||||||||||||||||||||||||||||||||
| 28.00 | O | X | O | X | X | O | X | O | • | 28.00 | |||||||||||||||||||||||||||||||||||||||||||
| 27.00 | O | X | O | X | O | X | O | X | • | • | 27.00 | ||||||||||||||||||||||||||||||||||||||||||
| 26.00 | O | X | O | X | O | X | O | • | 26.00 | ||||||||||||||||||||||||||||||||||||||||||||
| 25.00 | O | O | X | 4 | X | • | 25.00 | ||||||||||||||||||||||||||||||||||||||||||||||
| 24.00 | O | O | X | • | 24.00 | ||||||||||||||||||||||||||||||||||||||||||||||||
| 23.00 | O | • | 23.00 | ||||||||||||||||||||||||||||||||||||||||||||||||||
| 20 |
| ALB Albemarle Corp ($96.84) - Chemicals - ALB returned to a buy signal in Monday's trading as it reversed up and printed six Xs on its default chart, exceeding to previous levels of resistance. The weight of the evidence for ALB is positive as it is a 5 for 5'er that ranks in the top third of the favored chemicals sector matrix and has been on a market RS buy signal since 2016. The stock now sits against resistance at $97, with additional overhead resistance at $99 and $100. ALB is expected to report earnings on 11/4. |
| CCK Crown Holdings, Inc. ($89.56) - Business Products - CCK gave a third consecutive buy signal when it broke a double top at $89 in Monday's trading. The weight of the evidence is positive as CCK is a 3 for 5'er and ranks in the top quintile of the business product sector matrix. However, those considering long exposure should be aware that Monday's move will put the stock into heavily-overbought territory based on its weekly overbought/oversold reading. CCK has most recently found support at $85; it faces overhead resistance at $93, its all-time high, which it reached in late October. |
| ENPH Enphase Energy Inc ($102.59) - Electronics - ENPH moved higher Monday to reverse up into a column of Xs and break a triple top at $106. This 5 for 5'er moved to a positive trend in July and ranks 3rd out of 59 names in the electronics sector RS matrix. The weight of the technical evidence is positive here. Initial support can be found at $94 with further support offered at $93. Further overhead resistance may come at $108 from last month. |
| EXLS Exlservice Holdings, Inc ($76.40) - Business Products - Shares of EXLS rose Monday to break a double top at $77, marking their fourth consecutive buy signal. This 4 for 5'er moved to a positive trend in July and ranks in the top third of the business products sector RS matrix. The stock has also been on an RS sell signal against the market since late-2015. The technical picture continues to improve, however, the recent price appreciation has left EXLS in overbought territory so those looking to add exposure may be best served to wait for a pullback or normalization of the trading band. Initial support may be found at $68, with further overhead resistance potentially found at the March all-time high of $79. |
| FTCH Farfetch Limited Class A ($32.06) - Retailing - FTCH broke a double top at $32 before moving higher to $33 on Monday, marking a new all-time high on the chart. This stock is a 4 for 5’er within the favored retailing sector that has experienced three weeks of positive weekly momentum. Demand is in control. From here, support sits at $23. Note FTCH expects earnings on 11/12. |
| LITE Lumentum Holdings Inc ($81.79) - Electronics - LITE moved lower Monday after their earnings release to break a quadruple bottom at $80. This 2 for 5'er moved to an RS sell signal against the market in September and ranks in the lower third of the electronics sector RS matrix. The overall technical picture is weak here. Further support can be found at $78, the current location of the bullish support line. Initial overhead resistance may be found at $85 from October. |
| PNTG Pennant Group Inc ($43.25) - Healthcare - PNTG shares moved higher today to break a double top at $43 to mark its third consecutive buy signal. This 5 for 5'er has been in a positive trend since April and on an RS buy signal versus the market since August. PNTG is actionable at current levels with a weekly overbought/oversold reading of 21%. From here, support can be found at $37. |
| SNBR Sleep Number Corp. ($65.48) - Household Goods - SNBR broke a triple top at $66 on Monday, marking the stock’s fourth consecutive buy signal. This stock is a perfect 5 for 5’er that ranks 2nd out of 29 names in the favored household goods sector matrix. From here, SNBR faces resistance at $67, the stock’s all-time high printed in October, while support sits between $61 and $62. |
| VC Visteon Corp. ($89.12) - Autos and Parts - VC broke a double top at $91 before moving higher to $92, marking the stock’s second consecutive buy signal as well as a new 52 week high. VC is a 4 for 5’er within the favored autos and parts sector that moved back into a positive trend last month. Demand is in control. From here, support sits at $83. |

| Name | Option Symbol | Action | Stop Loss |
|---|---|---|---|
| Ameriprise Financial - $164.50 | O: 21C160.00D19 | Buy the March 160.00 calls at 17.80 | 154.00 |
| Name | Option | Action |
|---|---|---|
| Comcast Corporation ( CMCSA) | Jan. 40.00 Calls | Stopped at 41.00 (CP: 41.27) |
| Discover Financial Services ( DFS) | Jan. 62.50 Calls | Initiate an option stop loss of 6.40 (CP: 8.40) |
| Name | Option Symbol | Action | Stop Loss |
|---|---|---|---|
| AFLAC Incorporated - $35.52 | O: 21N37.50D19 | Buy the February 37.50 puts at 4.30 | 39.00 |
| Name | Option | Action |
|---|---|---|
| Gilead Sciences, Inc. (GILD) | Jan. 67.50 Puts | Raise the option stop loss to 8.25 (CP: 10.25) |
| Activision Blizzard, Inc. (ATVI) | Jan. 82.50 Puts | Raise the option stop loss to 6.50 (CP: 8.70) |
| Equity Residential (EQR) | Jan. 55.00 Puts | Stopped at 7.60 (CP: 7.20) |
| Name | Option Sym. | Call to Sell | Call Price | Investment for 500 Shares | Annual Called Rtn. | Annual Static Rtn. | Downside Protection |
|---|---|---|---|---|---|---|---|
| Ryder System, Inc. $49.26 | O: 21B52.50D19 | Feb. 52.50 | 3.20 | $23,595.30 | 34.14% | 18.94% | 5.35% |
| Name | Action |
|---|---|
| The Chemours Company (CC) - 20.14 | Sell the January 23.00 Calls. |
| L Brands Inc. (LB) - 32.01 | Sell the January 35.00 Calls. |
| Phillips-Van Heusen Corporation (PVH) - 58.29 | Sell the January 65.00 Calls. |
| Fifth Third Bancorp (FITB) - 23.22 | Sell the February 24.00 Calls. |
| General Motors (GM) - 34.53 | Sell the January 37.00 Calls. |
| QUALCOMM Incorporated (QCOM) - 123.36 | Sell the January 130.00 Calls. |
| Big Lots, Inc. (BIG) - 47.60 | Sell the January 52.50 Calls. |
| The Gap, Inc. (GPS) - 19.45 | Sell the January 23.00 Calls. |
| Steel Dynamics Inc. (STLD) - 31.48 | Sell the February 32.00 Calls. |
| Name | Covered Write |
|---|---|
| Twitter, Inc ( TWTR - 41.36 ) | January 47.00 covered write. |
Daily Equity & Market Analysis
Loading, Please Wait...
