
With the US Presidential Election on the horizon, we have a few data points to share regarding short-term market returns and volatility
Pre-Election Market Update Replay Available – If you missed our Pre-Election Market Update webinar on Thursday, we now have a replay available to view on demand. In this webinar, the NDW analyst team discussed the current state of the domestic equity market, historical election cycle comparisons, and what areas we are monitoring as we look towards the end of the year.
Click here to access the webinar replay
Click here to access the presentation slides
With the 59th United States Presidential Election on deck, we will share a few data points regarding short-term market returns and volatility.
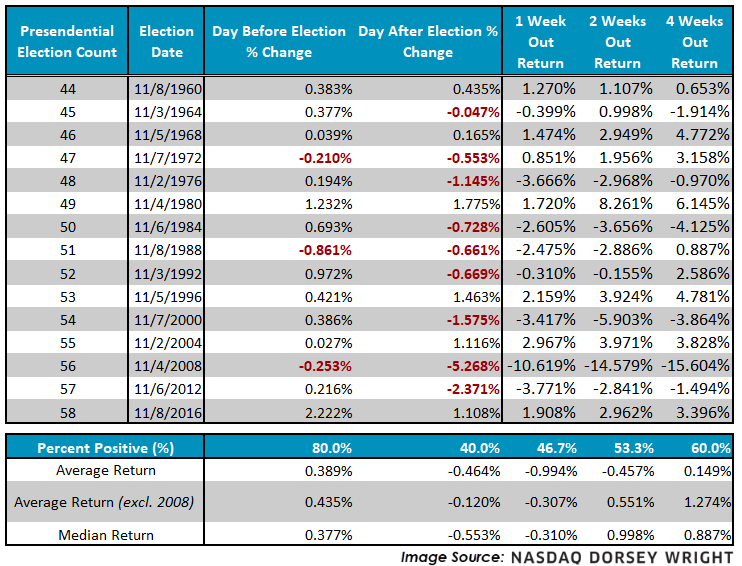
Beginning with short-term market movement, since 1960 Election Day has historically been prefaced by green on the screen. In fact, using the S&P 500 (SPX) as an equity market proxy, we find that 80% of single day sessions leading up to Election Day close positive, and today (11/2) added to that majority with SPX gaining 1.23%. However, we find that only 40% of single day returns after an election close green. As we look beyond the immediate horizon, we note a mixed basket in the near-term (1 and 2 week) with slightly steadier gains further out (4 week).
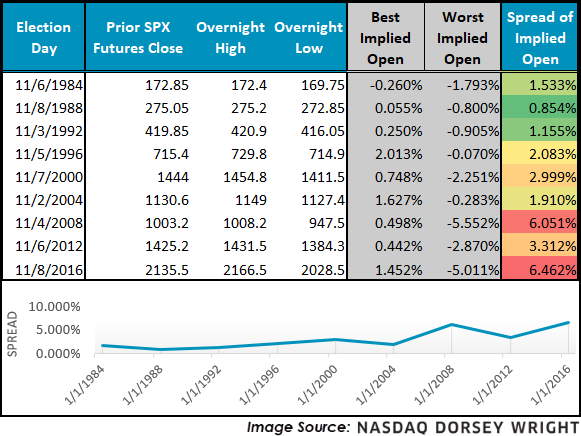
In addition, although the open and close spread for major indices like the S&P 500 can be elevated during times like these, to gain further insight on historical volatility we looked at index futures dating back to 1982 (inception). Using high and low values for the contracts, we calculated a “best implied - ” and “worst implied open” scenario, looking at the high and low, respectively, to see what the index change would have been if it were to begin trading at that watermark. The last election (2016) produced the highest spread on record in our study, yet since 1982 we note a generally increasing spread between the high and low values. Although we may attribute this to more futures contracts trading now compared to 25+ years ago, evidence may also suggest increased market sensitivity in related political episodes.
Although the findings presented above are not designed to be predictive by nature, it will certainly be interesting to see if the observed trends hold in a rather anomalistic year like 2020.
