
Most Requested Symbols

The market continued to get narrower during the month of August. Looking at the NASDAQ US Mid/Large Cap Index, less than 30% of the constituents are outperforming the S&P 500 on a trailing 12-month basis. This is the lowest number we have ever seen since the beginning of the data set in 1989.
We examine the returns of several asset classes following US Presidential Elections.
The average distribution reading is 42.54% overbought.
Today's featured stock is Broadridge Financial Solutions Inc. (BR)
AKAM, BILI, FIVN, HOME, HZNP, IMMU, LPSN, MDB, VEEV & Z
Call: Stone Co (STNE); Put: Dominion Energy (D); Covered Write: Walt Disney (DIS).
Nasdaq ESG Summit - We invite you to join us for the inaugural Virtual Nasdaq ESG Summit on September 22, 2020, from 11:00 AM to 2:00 PM ET. The Summit will provide compelling views from industry experts with critical ESG knowledge and best practices you need to address short-term and long-term challenges. The event will kick off with a keynote address sure to inspire and provoke conversation around current ESG trends. Following the keynote, registrants can choose from a number of breakout sessions specifically geared towards their interests. For additional information about the summit and to register, click here.
September has arrived and brought monthly updates to many of our DWA models. To see if any of your models made any changes during their most recent update, be sure to visit the models page and look at the “Actions/Activity” column on the right. If any changes were made, you’ll see a blue oval with the number of changes. To view the trades, simply click on the number and a list of the securities sold and bought will appear. If you wish to set notifications on a specific model, be sure to click on the bell icon to turn notifications on and receive alerts on any future model changes.

As the major market indices continue to make new all-time highs, the VIX has remained stubbornly elevated. Over the last ten days, the S&P 500 Index is up 3.5% while the VIX is up 23.7% (thru 8/31). This is a rare occurrence where the VIX is up over 20% while the S&P 500 Index is up over 3%. Removing a clustering of incidences, this has only happened 6 times since 1990. While returns are positive over the longer term, it does suggest that we could see a pullback over the short term. Although there aren’t enough data points to make any firm conclusions, it does help us add some context to an unfamiliar market environment in which major market indices have run up into heavily overbought territory.

(Source: etf.com)
Narrow Market
The market continued to get narrower during the month of August. Looking at the NASDAQ US Mid/Large Cap Index, less than 30% of the constituents are outperforming the S&P 500 on a trailing 12-month basis. This is the lowest number we have ever seen since the beginning of the data set in 1989.

Most of the 265 outperforming stocks come from the Technology sector, which shouldn’t be too much of a surprise.

When the market has been this narrow in the past, it has mean-reverted and started to broaden out. One way to measure this is whether small caps begin to outperform large caps. The last two times the indicator has been this low were June 1990 and March 1999. Neither of these dates was near a major, broad-market top, but they were near significant inflection points in small cap outperformance.
Below is the Russell 1000 dividend by the Russell 2000 small cap index. When the ratio moves up, large caps are outperforming. Both instances of the market being as narrow as it now is circled in red. Large caps continued to outperform for a couple of months, but then we saw a long period of small cap outperformance. The second observation in March 1999 was right at the peak of the large cap outperformance, and we saw a decade-long run of small cap outperformance.

When markets have been as narrow as they are now we have seen things change and small caps begin to outperform. This might not happen right away, but is going to become more important to keep an eye on small cap performance over the next few months to see if we get a trend change.

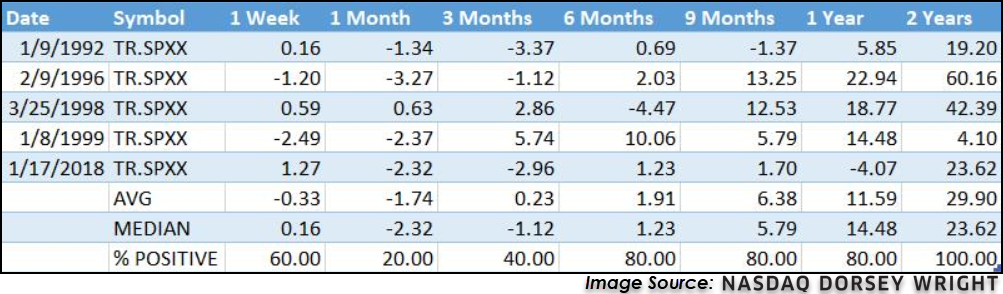
Last week we took a look at the historical returns in the two months leading up to US Presidential elections since 1976. In our analysis, we found that all asset classes, except for bonds, had average negative returns in the two months leading up to the last 11 presidential elections. However, with the outlier year of 2008 removed, the average returns became positive. Although the months leading up to an election are often times of higher volatility in the market, looking at the data it appears that the broader structural themes in the economy and the market had a large role in determining asset class returns than did the upcoming election; for example, the high returns exhibited by silver and gold in the two months before the 1976 election came during a period of high inflation, an environment in which precious metals typically perform well. The natural follow up question is: what about after the election? The tables below show the average performance of the same group of asset classes over two different periods – the two months after the presidential election and 12-months out.


On average, we see higher equity returns in the two months following the election and when we exclude 2008, and negative returns for both gold and silver. This may at least partially be a reduction in uncertainty after the election results are known, as equities often suffer from uncertainty with gold and silver often viewed as safe havens. One year out, we typically see strong positive equity returns and positive averages overall. One potential explanation is that equities benefit from optimism surrounding the policy goals of a new administration, which can range from tax cuts to greater infrastructure spending. It is worth noting that several of these periods, like 1980 or the 12 months after the 2008 election include or came shortly after the economy entered the recovery phase following a recession, periods which typically see higher than average equity returns.
There are changes to two iShares models this week. The iShares Tactical Model ISHRTACTICAL removed the iShares NASDAQ Biotech ETF IBB and added the iShares Silver Trust SLV. The iShares Sector Rotation Model also sold the iShares NASDAQ Biotech ETF IBB... (Read more)
First Trust Model Changes: FTRUST & FTFIXINC.TR
This week saw changes to two of the First Trust ETF models on the Nasdaq Dorsey Wright research platform. The first change we will cover came in the First Trust Fixed Income Model, which sold the First Trust TCW Opportunistic Fixed Income ETF FIXD as it fell sufficiently out of favor in the model’s relative strength matrix ranking. The model purchased the First Trust Tactical High Yield ETF HYLS as it was the next ... (Read more)
Invesco Highlight: PRN
There are no changes to any of the Invesco models this week. While Industrials remains in the bottom half of the DALI domestic equity sector rankings, it is the most improved sector over the last 30 days (7/27 - 8/27), as discussed last Friday’s Daily Equity Report. In last week’s trading, the Invesco DWA Industrials Momentum ETF PRN reached a new all-time high at $78 on its default chart. PRN boast a strong 5.30 fund score, 1.03 points better than the average for all industrials funds and has a positive 2.35 fund score direction. Since bottoming in March along with t... (Read more)

Average Level
42.54
| AGG | iShares US Core Bond ETF |
| USO | United States Oil Fund |
| DIA | SPDR Dow Jones Industrial Average ETF |
| DVY | iShares Dow Jones Select Dividend Index ETF |
| DX/Y | NYCE U.S.Dollar Index Spot |
| EFA | iShares MSCI EAFE ETF |
| FXE | Invesco CurrencyShares Euro Trust |
| GLD | SPDR Gold Trust |
| GSG | iShares S&P GSCI Commodity-Indexed Trust |
| HYG | iShares iBoxx $ High Yield Corporate Bond ETF |
| ICF | iShares Cohen & Steers Realty ETF |
| IEF | iShares Barclays 7-10 Yr. Tres. Bond ETF |
| LQD | iShares iBoxx $ Investment Grade Corp. Bond ETF |
| IJH | iShares S&P 400 MidCap Index Fund |
| ONEQ | Fidelity Nasdaq Composite Index Track |
| QQQ | Invesco QQQ Trust |
| RSP | Invesco S&P 500 Equal Weight ETF |
| IWM | iShares Russell 2000 Index ETF |
| SHY | iShares Barclays 1-3 Year Tres. Bond ETF |
| IJR | iShares S&P 600 SmallCap Index Fund |
| SPY | SPDR S&P 500 Index ETF Trust |
| TLT | iShares Barclays 20+ Year Treasury Bond ETF |
| GCC | WisdomTree Continuous Commodity Index Fund |
| VOOG | Vanguard S&P 500 Growth ETF |
| VOOV | Vanguard S&P 500 Value ETF |
| EEM | iShares MSCI Emerging Markets ETF |
| XLG | Invesco S&P 500 Top 50 ETF |
| Symbol | Company | Sector | Current Price | Action Price | Target | Stop | Notes |
|---|---|---|---|---|---|---|---|
| EBAY | eBay Inc. | Internet | $54.78 | mid-to-upper 50s | 100 | 46 | 5 for 5'er, top third of favored INET sector matrix, LT pos mkt RS, pullback from ATH |
| DECK | Deckers Outdoor Corporation | Textiles/Apparel | $203.87 | low 200s to mid 230s | 284 | 178 | 5 for 5'er, pullback from ATH, consec buy signals, pos mon mom, top 10% of DWATEXT |
| PLD | ProLogis | Real Estate | $101.86 | hi 90s - mid 100s | 116 | 87 | 5 for 5'er, top third of REAL sector matrix, spread triple top, pos monthly mom flip, 2.2% yield |
| SPGI | S&P Global Inc. | Media | $366.42 | 350s - 360s | 407 | 304 | 5 for 5'er, top 25% of MEDI sector matrix, LT pos mkt RS, multi consec buys |
| ROK | Rockwell Automation, Inc. | Electronics | $230.53 | 220s - 230s | 274 | 200 | 5 for 5'er, top 33% of ELEC sector matrix, LT pos mkt RS, spread triple top, 1.8% yield |
| ON | On Semiconductor Corp. | Semiconductors | $21.37 | low 20s | 36.50 | 18 | 4 for 5'er, consec buy signals, top 25% of fav DWASEMI, pos mon mom |
| COLB | Columbia Banking System, Inc. | Banks | $27.91 | 28 - 30 | 46 | 23 | 4 for 5'er, top half of BANK sector matrix, spread triple top, pos monthly mom flip, 3.95% yield |
| AMP | Ameriprise Financial | Finance | $156.80 | hi 150s - hi 160s | 188 | 136 | 4 for 5'er, top third of FINA sector matrix, multi consec buy signals, one box from RS buy signal, 2.6% yield |
| BR | Broadridge Financial Solutions Inc. | Business Products | $137.40 | high 120s to mid 130s | 179 | 110 | 5 for 5'er, pullback from ATH, long-term trend, LT market RS buy signal, pos mon mom |
| Symbol | Company | Sector | Current Price | Action Price | Target | Stop | Notes |
|---|---|---|---|---|---|---|---|
| THS | TreeHouse Foods, Inc. | Food Beverages/Soap | $42.81 | low to mid 40s | 36 | 53 | 0 for 5'er, consec sell signals, LT market RS sell signal, bottom quartile of DWAFOOD |
| Comment |
|---|
| FIZZ National Beverage Corporation R ($85.13) - Food Beverages/Soap - Raise stop to $66.50, the first sell signal on FIZZ's 0.50 chart. |
BR Broadridge Financial Solutions Inc. R ($138.28) - Business Products - BR is a perfect 5 for 5’er that ranks in the top half of the favored business products sector RS matrix. Furthermore, BR has traded in a positive trend since March 2009 and has maintained a market RS buy signal since February 209. Since April, BR has given five consecutive buy signals, confirming that demand is in control in addition to experiencing three months of positive monthly momentum. With the most recent chart action, BR printed a new all-time high with a move to $144 before pulling back slightly to $138, well above initial support that sits at $124. New positions are welcome here between in the high 120s to mid 130s. We will set our initial stop at $110, which would violate multiple levels of support on BR’s default chart. We will use the stock’s bullish price objective of $179 as our near-term price target.
| 19 | 20 | ||||||||||||||||||||||||||||||||||||||||||||||||||||
| 144.00 | X | Top | 144.00 | ||||||||||||||||||||||||||||||||||||||||||||||||||
| 142.00 | X | O | 142.00 | ||||||||||||||||||||||||||||||||||||||||||||||||||
| 140.00 | X | O | 140.00 | ||||||||||||||||||||||||||||||||||||||||||||||||||
| 138.00 | X | X | O | 138.00 | |||||||||||||||||||||||||||||||||||||||||||||||||
| 136.00 | 9 | O | X | 8 | 136.00 | ||||||||||||||||||||||||||||||||||||||||||||||||
| 134.00 | X | O | 7 | O | X | X | 134.00 | ||||||||||||||||||||||||||||||||||||||||||||||
| 132.00 | X | O | X | O | 9 | X | O | X | Mid | 132.00 | |||||||||||||||||||||||||||||||||||||||||||
| 130.00 | X | A | X | O | X | O | X | O | X | X | 130.00 | ||||||||||||||||||||||||||||||||||||||||||
| 128.00 | X | O | X | O | X | O | X | O | X | 7 | O | X | 128.00 | ||||||||||||||||||||||||||||||||||||||||
| 126.00 | X | O | 6 | 8 | X | O | X | 1 | O | X | X | O | X | O | X | 126.00 | |||||||||||||||||||||||||||||||||||||
| 124.00 | X | O | X | O | X | O | X | O | X | O | 6 | O | X | O | X | O | 124.00 | ||||||||||||||||||||||||||||||||||||
| 122.00 | X | O | X | O | A | X | O | X | O | 2 | X | O | X | O | 122.00 | ||||||||||||||||||||||||||||||||||||||
| 120.00 | 7 | X | O | 5 | O | B | X | O | X | O | X | X | O | X | 120.00 | ||||||||||||||||||||||||||||||||||||||
| 118.00 | X | O | X | O | X | X | O | X | O | X | O | 5 | O | X | O | Bot | 118.00 | ||||||||||||||||||||||||||||||||||||
| 116.00 | X | O | X | O | X | O | X | O | O | O | X | O | X | 116.00 | |||||||||||||||||||||||||||||||||||||||
| 114.00 | 5 | O | X | O | X | O | X | O | X | O | X | 114.00 | |||||||||||||||||||||||||||||||||||||||||
| 112.00 | 4 | 8 | O | B | X | O | X | O | 112.00 | ||||||||||||||||||||||||||||||||||||||||||||
| 110.00 | X | O | X | O | X | 110.00 | |||||||||||||||||||||||||||||||||||||||||||||||
| 108.00 | X | O | X | O | X | 108.00 | |||||||||||||||||||||||||||||||||||||||||||||||
| 106.00 | X | O | C | 4 | O | X | X | 106.00 | |||||||||||||||||||||||||||||||||||||||||||||
| 104.00 | 3 | O | X | O | 2 | X | O | X | O | X | 104.00 | ||||||||||||||||||||||||||||||||||||||||||
| 102.00 | X | O | X | O | X | O | X | X | 3 | X | X | O | X | 102.00 | |||||||||||||||||||||||||||||||||||||||
| 100.00 | X | O | X | O | X | O | X | O | X | O | X | X | O | X | O | X | 100.00 | ||||||||||||||||||||||||||||||||||||
| 99.00 | X | O | X | O | X | X | O | X | O | X | O | X | O | X | O | X | O | X | 99.00 | ||||||||||||||||||||||||||||||||||
| 98.00 | X | O | X | O | X | O | X | O | X | 3 | O | X | O | X | O | X | O | X | 98.00 | ||||||||||||||||||||||||||||||||||
| 97.00 | X | O | O | X | O | X | X | O | X | O | X | O | X | O | X | O | X | X | X | 97.00 | |||||||||||||||||||||||||||||||||
| 96.00 | O | X | O | X | O | X | O | X | X | O | X | O | X | O | X | O | X | O | X | O | X | O | X | 96.00 | |||||||||||||||||||||||||||||
| 95.00 | O | X | O | O | X | O | X | O | X | O | X | O | X | O | X | O | X | O | X | O | X | O | X | 95.00 | |||||||||||||||||||||||||||||
| 94.00 | 2 | X | X | O | O | X | O | X | O | O | X | O | X | O | X | O | X | O | X | 4 | X | • | 94.00 | ||||||||||||||||||||||||||||||
| 93.00 | O | X | O | X | O | X | 1 | O | X | O | X | O | X | O | X | O | X | O | X | • | 93.00 | ||||||||||||||||||||||||||||||||
| 92.00 | O | X | O | X | O | O | O | X | O | O | X | O | X | O | X | • | 92.00 | ||||||||||||||||||||||||||||||||||||
| 91.00 | O | X | O | X | O | O | X | O | O | • | 91.00 | ||||||||||||||||||||||||||||||||||||||||||
| 90.00 | O | X | O | O | X | • | 90.00 | ||||||||||||||||||||||||||||||||||||||||||||||
| 89.00 | O | X | O | X | • | 89.00 | |||||||||||||||||||||||||||||||||||||||||||||||
| 88.00 | O | O | X | • | 88.00 | ||||||||||||||||||||||||||||||||||||||||||||||||
| 87.00 | O | X | • | 87.00 | |||||||||||||||||||||||||||||||||||||||||||||||||
| 86.00 | O | X | • | 86.00 | |||||||||||||||||||||||||||||||||||||||||||||||||
| 85.00 | O | X | • | 85.00 | |||||||||||||||||||||||||||||||||||||||||||||||||
| 84.00 | O | X | • | 84.00 | |||||||||||||||||||||||||||||||||||||||||||||||||
| 83.00 | O | X | • | 83.00 | |||||||||||||||||||||||||||||||||||||||||||||||||
| 82.00 | O | • | 82.00 | ||||||||||||||||||||||||||||||||||||||||||||||||||
| 19 | 20 |
| AKAM Akamai Technologies, Inc. ($118.16) - Internet - AKAM is a 4 for 5’er within the favored internet sector that has maintained a long-term market RS buy signal since July 2019. Additionally, with today’s market action, AKAM broke a double top at $118 and is now trading at new 52 week highs. Today’s breakout marks the third consecutive buy signal, confirming that demand is in control. From here, initial support sits at $106. |
| BILI Bilibili, Inc. Sponsored ADR Class Z ($52.38) - Media - BILI broke a double top at $50 before moving higher to $52, marking a new all-time high as well as the third consecutive buy signal. BILI is a 3 for 5’er that has been trading in a positive trend since November 2019. Additionally, weekly momentum has been positive for two weeks, suggesting the potential for higher prices. From here, support sits at $44. |
| FIVN Five9, Inc. (Five9) ($129.74) - Software - FIVN returned to a buy signal on Tuesday with a double top breakout at $130. As a result, FIVN is now testing resistance at $130, the stock’s all-time high. FIVN is a solid 4 for 5’er that has maintained a market RS buy signal since November 2015 and is trading in a positive trend. From here, a move to $132 would break a spread triple top and would mark a new all-time high. Support sits at $122. |
| HOME AT Home Group Inc ($22.87) - Retailing - HOME completed a shakeout pattern on Tuesday with a triple top breakout at $20 before moving higher to $23. This stock is a strong 5 for 5’er within the favored retailing sector that has experienced three months of positive monthly momentum. At current levels, HOME is heavily overbought. Support sits at $17.50. |
| HZNP Horizon Pharma PLC ($75.44) - Drugs - HZNP completed a bullish triangle pattern with a double top breakout at $77 following a period of consolidation on the chart. HZNP is a strong 5 for 5’er that ranks 2nd out of 53 names in the drugs sector RS matrix. From here, HZNP faces resistance at $78, the stock’s all-time high, while support sits at $73. |
| IMMU Immunomedics Inc ($43.89) - Biomedics/Genetics - IMMU completed a shakeout pattern on Tuesday with a triple top breakout at $45 and is now trading at new all-time highs. This stock is a 5 for 5’er that is trading well above the bullish support line. Additionally, IMMU has maintained a long-term market RS buy signal since November 2019. From here, support sits at $40. |
| LPSN LivePerson, Inc. ($62.90) - Computers - LPSN broke a double top at $63, marking the stock’s seventh consecutive buy signal as well as a new all-time high. This stock is a strong 5 for 5’er that ranks 2nd out of 39 names in the favored computers sector RS matrix. Additionally, monthly momentum has been positive for two months, suggesting the potential for higher prices. Demand is in control. From here, support sits at $59. Note LPSN is heavily overbought here. |
| MDB MongoDB, Inc. Class A ($253.46) - Software - MDB returned to a buy signal on Tuesday at $236 before moving to $252 just one day ahead of expected earnings. As a result of this move, MDB is now trading at new all-time highs. MDB is a 3 for 5’er that has experienced two weeks of positive weekly momentum. The weight of the evidence is positive. From here, support sits at $188. |
| VEEV Veeva Systems Inc. ($293.45) - Software - VEEV reversed up into a column of Xs on Tuesday to break a double top at $292, resulting in a seventh consecutive buy signal and new all-time chart high. The 5 for 5'er demonstrates positive long-term relative strength versus the market, remaining on an RS buy signal since May of 2016 and reentered a positive trend in March, indicating favorable absolute strength. The weight of the evidence is positive yet those looking to initiate new long exposure may consider VEEV on a pullback as the stock is entering heavily overbought territory with today's action. Initial support is offered at $276. |
| Z Zillow Group Inc. Class C ($88.48) - Real Estate - Z broke a double top at $89 and is now trading at new all-time highs. Tuesday’s breakout marks the third consecutive buy signal on the chart, confirming that demand is in control. Z is a perfect 5 for 5’er that ranks 1st out of 125 names in the real estate sector RS matrix. From here, support sits at $85. |
| Name | Option Symbol | Action | Stop Loss |
|---|---|---|---|
| StoneCo Ltd. Class A - $52.81 | O: 21A50.00D15 | Buy the January 50.00 calls at 9.20 | 48.00 |
| Name | Option | Action |
|---|---|---|
| Fastenal Company ( FAST) | Nov. 40.00 Calls | Raise the option stop loss to 7.80 (CP: 9.80) |
| CSX Corporation ( CSX) | Nov. 65.00 Calls | Raise the option stop loss to 11.90 (CP: 13.90) |
| Boston Scientific Corporation ( BSX) | Nov. 35.00 Calls | Raise the option stop loss to 5.15 (CP: 7.15) |
| NIKE, Inc. ( NKE) | Jan. 105.00 Calls | Raise the option stop loss to 12.95 (CP: 14.95) |
| PTC Inc ( PTC) | Jan. 87.50 Calls | Initiate an option stop loss of 11.00 (CP: 13.00) |
| Paypal Holdings Inc ( PYPL) | Nov. 200.00 Calls | Initiate a stock price stop of 0.00 (CP: 209.43) |
| Name | Option Symbol | Action | Stop Loss |
|---|---|---|---|
| Dominion Energy Inc. - $77.82 | O: 21M80.00D15 | Buy the January 80.00 puts at 7.40 | 83.00 |
| Name | Option | Action |
|---|---|---|
| ConocoPhillips (COP) | Nov. 45.00 Puts | Initiate an option stop loss of 6.80 (CP: 8.80) |
| Walgreens Boots Alliance Inc. (WBA) | Jan. 42.50 Puts | Initiate a stock price stop of 0.00 (CP: 36.72) |
| Gilead Sciences, Inc. (GILD) | Nov. 70.00 Puts | Raise the option stop loss to 4.80 (CP: 6.80) |
| Name | Option Sym. | Call to Sell | Call Price | Investment for 500 Shares | Annual Called Rtn. | Annual Static Rtn. | Downside Protection |
|---|---|---|---|---|---|---|---|
| The Walt Disney Company $131.87 | O: 21A140.00D15 | Jan. 140.00 | 8.10 | $63,433.25 | 24.96% | 14.14% | 5.00% |
| Name | Action |
|---|---|
| Wendy's Company (WEN) - 20.94 | Sell the November 22.00 Calls. |
| Teradyne, Inc. (TER) - 84.97 | Sell the January 97.50 Calls. |
| PulteGroup, Inc. (PHM) - 44.59 | Sell the January 50.00 Calls. |
| Qorvo Inc. (QRVO) - 128.27 | Sell the November 135.00 Calls. |
| Bank of America (BAC) - 25.74 | Sell the December 27.00 Calls. |
| Canadian Natural Resources Ltd. (CNQ) - 19.67 | Sell the December 21.00 Calls. |
| Ally Financial Inc. (ALLY) - 22.88 | Sell the December 24.00 Calls. |
| Microchip Technology Incorporated (MCHP) - 109.70 | Sell the November 115.00 Calls. |
| Aptiv PLC (APTV) - 86.12 | Sell the November 87.50 Calls. |
| Name | Covered Write |
|---|---|
|
|
|
Daily Equity & Market Analysis
Loading, Please Wait...
