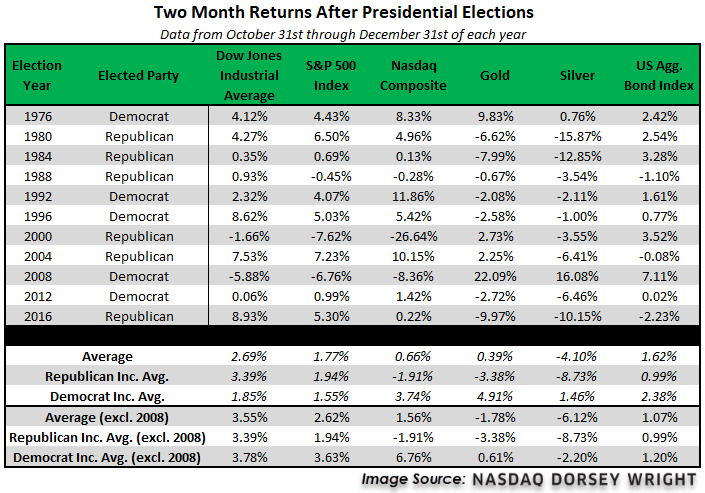
We examine the returns of several asset classes following US Presidential Elections.
Last week we took a look at the historical returns in the two months leading up to US Presidential elections since 1976. In our analysis, we found that all asset classes, except for bonds, had average negative returns in the two months leading up to the last 11 presidential elections. However, with the outlier year of 2008 removed, the average returns became positive. Although the months leading up to an election are often times of higher volatility in the market, looking at the data it appears that the broader structural themes in the economy and the market had a large role in determining asset class returns than did the upcoming election; for example, the high returns exhibited by silver and gold in the two months before the 1976 election came during a period of high inflation, an environment in which precious metals typically perform well. The natural follow up question is: what about after the election? The tables below show the average performance of the same group of asset classes over two different periods – the two months after the presidential election and 12-months out.

- Domestic equities have shown positive returns, on average, in the final two months of the year following a presidential election.
- If we remove 2008, average domestic equity returns in the two months after an election year improve to be at least 1.5% for the Nasdaq while increasing to an average gain of over 3.5% for the Dow Jones Industrial Average.
- Again removing 2008, investors seemingly face much less uncertainty in the two months following a presidential election, as the Dow was in the black for 9 out of the 10 years examined, while the S&P 500 Index and Nasdaq were each positive for 8 of those years. This is vastly different than gold which was only positive for 3 years, as well as silver, which only gained in 1 year outside of 2008. Bonds did slightly better than their risk-off peers, but not as well as equities, posting 7 periods of gains in the timeframes examined.
- Silver was the worst-performing asset examined, showing an average loss of -4.10%.
- The result of the election did not have a major effect on returns of domestic equities in the final two months of an election year. Equities seemed to perform slightly better in years when a democrat was elected president, however, if we remove both 2000 and 2008 due to the outside factors in each year, we see that this relationship actually switches to favor republicans for average returns in the DJIA and SPX.

- The observations noted above are generally amplified when we examine forward returns 12 months after a presidential election, with equities improving to each post average returns north of 8%.
- The Nasdaq was the top-performing representative, with an average gain north of 12%. In fact, the 12 months following the beginning of the dot com bubble in 2000 were the only period where NASD posted negative returns.
- Silver was again the worst performing asset, posting an average loss of -3.34% as the only area in the red. Gold was the next worst performing asset at an average return of 1.69%.
- If we exclude the 12 month period after the 2000 election, we can see that neither party led to drastic underperformance for domestic equities. Each of the major indexes was relatively in line on average returns with republicans in power, however, the Nasdaq posted significantly better returns during years when democrats were in power, with an average gain of over 23%.
- Each of the risk-off assets also posted higher average returns in democratic years when compared to republican years, again excluding the 2000-2001 timeframe.
On average, we see higher equity returns in the two months following the election and when we exclude 2008, and negative returns for both gold and silver. This may at least partially be a reduction in uncertainty after the election results are known, as equities often suffer from uncertainty with gold and silver often viewed as safe havens. One year out, we typically see strong positive equity returns and positive averages overall. One potential explanation is that equities benefit from optimism surrounding the policy goals of a new administration, which can range from tax cuts to greater infrastructure spending. It is worth noting that several of these periods, like 1980 or the 12 months after the 2008 election include or came shortly after the economy entered the recovery phase following a recession, periods which typically see higher than average equity returns.
