The market continued to get narrower during the month of August. Looking at the NASDAQ US Mid/Large Cap Index, less than 30% of the constituents are outperforming the S&P 500 on a trailing 12-month basis. This is the lowest number we have ever seen since the beginning of the data set in 1989.
Narrow Market
The market continued to get narrower during the month of August. Looking at the NASDAQ US Mid/Large Cap Index, less than 30% of the constituents are outperforming the S&P 500 on a trailing 12-month basis. This is the lowest number we have ever seen since the beginning of the data set in 1989.

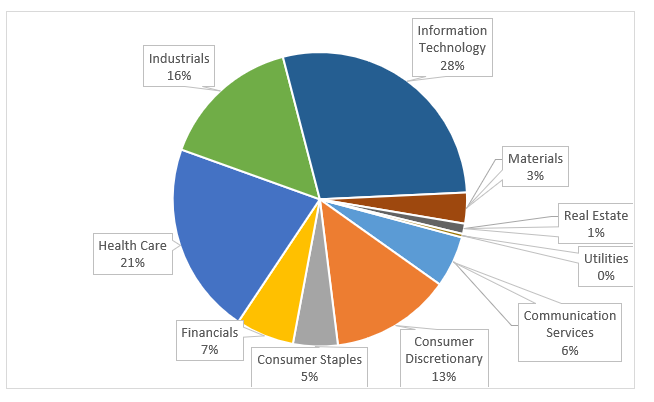
Most of the 265 outperforming stocks come from the Technology sector, which shouldn’t be too much of a surprise.

When the market has been this narrow in the past, it has mean-reverted and started to broaden out. One way to measure this is whether small caps begin to outperform large caps. The last two times the indicator has been this low were June 1990 and March 1999. Neither of these dates was near a major, broad-market top, but they were near significant inflection points in small cap outperformance.
Below is the Russell 1000 dividend by the Russell 2000 small cap index. When the ratio moves up, large caps are outperforming. Both instances of the market being as narrow as it now is circled in red. Large caps continued to outperform for a couple of months, but then we saw a long period of small cap outperformance. The second observation in March 1999 was right at the peak of the large cap outperformance, and we saw a decade-long run of small cap outperformance.

When markets have been as narrow as they are now we have seen things change and small caps begin to outperform. This might not happen right away, but is going to become more important to keep an eye on small cap performance over the next few months to see if we get a trend change.
