
US equities now leads fixed income by 9 tally signals. Today, we review the DALI-based strategies and their current allocations. Additionally, we take a closer look at the industrials sector and its corresponding sub-groups.
Earlier this week, we saw U.S. equities surpass fixed income for the #1 spot in DALI after having fallen from grace back in mid-March. On Wednesday, we spelled out the impact of this most recent ranking change across the suite of Tactical Tilt Models, all of which increased U.S. equity exposure at the expense of fixed income. Because there are now more than 5 signals separating U.S. equities and fixed income, today, we want to provide a quick review of the DALI-based strategies that employ the signal buffer rule and their allocations now that U.S. equities is firmly in the top spot. We do note that since the DALI-based strategies increased U.S. equity exposure earlier this month when the U.S. equities asset class surpassed cash for #2, most of the strategies that use the 5 signal buffer rule were unaffected by this most recent change. As it stands today, U.S. equities has 233 signals in its favor, lengthening the spread between #1 and #2 to nine signals. Below the DALI strategies update, we highlight one of the most-improved broad sectors within the DALI US sector breakdown and take a closer look at its corresponding sub-groups.

DALI-based Strategies Update
- DALI Asset Allocation - No Bogey: One of the most basic strategies, DALI No Bogey assumes owning the top two ranked asset classes in an equal-weighted fashion.

- DALI Asset Allocation - with Bogey: Like the DALI No Bogey strategy, "DALI with Bogey" owns the top two ranked asset classes, but it also employs the Cash Bogey Check. Cash can move in as a place holder, should one of the top two ranked asset classes in DALI fail their respective Cash Bogey Checks. The DALI with Bogey strategy is 50% fixed income and 50% US equities since both asset classes are passing their own Cash Bogey Checks.

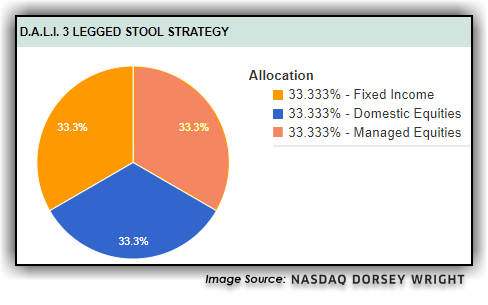
- 3 Legged Stool: The 3 Legged Stool Strategy, as the name implies, consists of three pieces. Two of those "legs" are allocated to the top two ranked asset classes in DALI, and the third leg is designed to provide constant equity exposure. Within this strategy, the managed equity exposure can take shape in many different ways, as it offers the opportunity to further customize the allocation through individual stock selections, ETFs, mutual funds, UITs, or a combination of all. One third is allocated to US equities, one third to fixed income, and one third to a constant equity exposure piece. Note: Those running this strategy with a Cash Bogey have the same allocation since US equities and fixed income are passing their Cash Bogey Checks.
- DALI Tactical Allocation: The Tactical Allocation, or "6-Legged Stool" as this strategy has come to be known in some circles, is a strategy where US equities, international equities, commodities, and fixed income account for a constant 15%, so 60% of the total portfolio. The other 40% is split evenly between the top two ranked asset classes in DALI. The result is a portfolio that maintains exposure to four asset classes at all times but uses DALI to overweight areas of leadership. Note: Those running this strategy with a Cash Bogey have the same allocation since US equities and fixed income are passing their Cash Bogey Checks.

- DALI Flexible Allocation: In the DALI Flexible Allocation Strategy, each asset class is weighted in the portfolio based on the percent of total "buy signals" the asset class maintains relative to the current sum of "tally" signals. In this strategy, you are keeping exposure to all six asset classes at all times; however, depending on where the strength is in the market, you will be overweighting and underweighting different asset classes at different times. Currently, the Flex Allocation strategy is overweight US equities income at 21.5% and provides 20.6% to fixed income, 18.1% to cash, 14.8% to currencies, 13.6% to commodities, and 11.3% to international equities. The DALI Flex Allocation is the only strategy that can see allocation changes even without a change in actual rankings in DALI, as it is all dependent on the tally rank numbers. The strategy is evaluated monthly.

- DALI Tactical Tilt Allocation: Our Tactical Tilt program was built to both respect strategic allocation boundaries, but also allow us the be adaptive to leadership changes. Each asset class is assigned a minimum allocation and a maximum allocation based on traditional strategic allocation concepts. However, using DALI as the driving force for the tactical input, the strategy can overweight asset classes that are in a position of leadership, allowing the maximum threshold to be met. In a sample moderate "Tilt" allocation, an offensive portfolio could have 75% exposure to US equity, while a sample defensive portfolio could be only 20% US equity. With the changes this week, all three Tilt portfolios have increased their US equity exposure at the expense of fixed income.

DALI US Sub-Sector Strength
When we dig into the DALI sector breakdown for U.S. equities, we can see where the shifts in strength are occurring across the U.S. equity landscape using the tally history link. Over the last 30 and 90 day periods, it has been the industrials sector that has gained the most tally signals, signaling that this is an area that is gaining traction. Recall that right before the COVID-19 sell-off swept across global markets, the industrials sector ranked third and had been considered a "high-RS sector," i.e., ranked in the top half of the sector rankings, since October 2016. That all changed on March 9, 2020, when industrials slid from #3 to #6 in just one day and continued to deteriorate even further over the next four months, where it moved as low as the tenth-ranked asset class in late-April and early May.

As it stands today, the industrials sector ranks seventh and trails the basic materials sector by just eight tally signals, so be sure to turn on your DALI alerts to be notified of any future sector or asset class changes. Despite being down -4.20% on a year-to-date basis, the broad industrials sector, using the Industrial Select Sector SPDR Fund XLI as a proxy, has managed to outperform the SPX on a 30, 60, and 90-day lookback. Additionally, XLI is up over 60% since the market bottom on March 23, outperforming the SPX by over 4%.
Industrials & Industrials Sub-Sectors
While the broader industrials sector has gained momentum over the last few months, not all areas within the sector are exhibiting solid long-term momentum. To identify which sub-sectors are participating more than others in the industrials sector, we ranked the +128 S&P 500 sub-industry groups by long-term relative strength. Currently, trucking and air freight & logistics both rank in the top quintile (best) of the SPX sub-industry groups, while airlines rank in the bottom quintile (worst) due to the fact that we are seeing more “stuff” being transported versus people. With Friday’s intraday action, the Dow Jones Transportation Index, the U.S.’s first stock market index that still tracks 20 of the most important companies in the sector, printed an X at 11,280, marking a new multi-year high and now sits about 3% off of its all-time high reached in September 2018.
Airlines
Recall that airlines were one of the hardest-hit areas of the U.S. economy as a result of the global pandemic, causing air travel to come to a virtual standstill. Although airlines are operating today, the International Air Transport Association, which represents most of the world's major airlines, does not expect the airline industry to recover from the coronavirus until 2024 (source: Business Insider). Many airlines charts, such as Southwest Airlines Co. LUV shown in the image below, have started to form big bases; however, they have yet to break out of them. In the case of LUV, a move to $49 or higher would move through resistance dating back to March and would signal that demand is in control, making the stock more actionable. We suggest waiting for charts like these to form bases as they continue to find a bottom. Although they may "seem" to have put in bottoms, we need further evidence of strength, especially as these companies could face lingering problems long after the virus is under control.

Trucking
Trucking, on the other hand, has thrived due in part to online shopping/e-commerce that has increased as a result of COVID-19 and the global economic shutdown. Trucking is the highest-ranked industrials sub-group at this time sitting in the seventh spot. The trucking group includes names like ODFL and J.B. Hunt Transport Services, Inc. JBHT. In the image below, we have a chart of JBHT. This stock is a solid 4 for 5'er that has given three consecutive buy signals and is trading in an overall positive trend. With yesterday's market action, JBHT printed an X at $144, marking a new all-time high for the stock. This recent rally has pushed JBHT into overbought territory with an OBOS% reading of 76%, so those looking to initiate new positions may want to scale in here or buy on a pullback/normalization of the trading band. From here, initial support sits at $126. Year-to-date, JBHT is up 22.28%, outpacing the SPX's return of 7.85%.

Air Freight & Logistics
Similar to trucking, the air freight & logistics sub-group is thriving due to the increased demand for goods versus services. Household names like United Parcel Service, Inc. UPS, and FedEx Corporation FDX are driving the strength of the air-fright subsector, both of which are perfect 5 for 5'ers. In its most recent earnings call, FDX reported a 72% increase in residential volumes versus last year and a 20% increase in FedEx group revenues (source: MarketWatch). FDX, shown in the image below, printed a new all-time high with today's action at $220. This stock has given five consecutive buy signals, confirming that demand is firmly in control. Additionally, FDX is one of just five SPX stocks that have moved to market RS buy signals over the last three weeks, telling us that FDX now possesses long-term strength when compared to the broader market. Year-to-date, FDX is up 44.30%, outpacing the SPX by over 36%. Note FDX is more than 150% overbought so those looking to initiate new long exposure may best be served on a pullback. From here, initial support sits at $168. FDX expects earnings on 9/15.

To generate the list of high-RS industrial stock ideas below, we used the Security Screener tool, housed under the Security Selection menu, to filter for high-RS, actionable industrial names within the S&P 500 Index. After adding a handful of screens to our search, we generated 17 ideas that we've listed in the table below. Note: if you run this screen any time after 8/28, your results may differ slightly due to the nature of the criteria.
High R.S. Industrials Stock Query Criteria:
- Universe: S&P 500 Index
- Broad Sector: Industrials
- Technical Attribute: 3, 4 & 5
- Trend: Positive
- P&F Signal: Buy
- Overbought/Oversold (%OBOS): < 50%
| Symbol | Name | Price | Tech Attrib/Score | DWA Sector | Overbought/Oversold | ||
|---|---|---|---|---|---|---|---|
| ALLE | Allegion PLC | 103.24 | 3 |
Protection Safety Equipment |
|
||
| AMCR | Amcor PLC | 11.07 | 3 |
Business Products |
|
||
| AOS | A.O. Smith Corporation | 49.20 | 4 |
Building |
|
||
| APH | Amphenol Corporation | 108.10 | 5 |
Electronics |
|
||
| BA | The Boeing Company | 174.20 | 3 |
Aerospace Airline |
|
||
| GRMN | Garmin Ltd. | 102.57 | 5 |
Electronics |
|
||
| HWM | Howmet Aerospace Inc. | 17.43 | 4 |
Aerospace Airline |
|
||
| IT | Gartner, Inc. | 130.72 | 3 |
Business Products |
|
||
| J | Jacobs Engineering Group Inc. | 89.08 | 3 |
Building |
|
||
| PAYX | Paychex, Inc. | 76.54 | 3 |
Business Products |
|
||
| PCAR | PACCAR Inc. | 86.33 | 4 |
Autos and Parts |
|
||
| PKG | Packaging Corp of America | 102.10 | 3 |
Forest Prods/Paper |
|
||
| PKI | PerkinElmer, Inc. | 114.50 | 5 |
Electronics |
|
||
| ROK | Rockwell Automation, Inc. | 232.01 | 5 |
Electronics |
|
||
| ROP | Roper Technologies Inc. | 428.06 | 5 |
Machinery and Tools |
|
||
| TDG | TransDigm Group, Inc. | 498.32 | 5 |
Aerospace Airline |
|
||
| ZBRA | Zebra Technologies Corp | 277.26 | 5 |
Electronics |
|
