
Most Requested Symbols

US equities now leads fixed income by 9 tally signals. Today, we review the DALI-based strategies and their current allocations. Additionally, we take a closer look at the industrials sector and its corresponding sub-groups.
Today's featured stock is Columbia Banking System, Inc.(COLB).
BLDR, CAR, CHDN, HLT, GH, MSGS, PLAN, TXRH, VICR & YEXT
Call: Paypal Holdings Inc (PYPL); Put: Seagate Technology (STX); Covered Call: Microchip Technology Incorporated (MCHP).
Nasdaq ESG Summit - We invite you to join us for the inaugural Virtual Nasdaq ESG Summit on September 22, 2020, from 11:00 AM to 2:00 PM ET. The Summit will provide compelling views from industry experts with critical ESG knowledge and best practices you need to address short-term and long-term challenges. The event will kick off with a keynote address sure to inspire and provoke conversation around current ESG trends. Following the keynote, registrants can choose from a number of breakout sessions specifically geared towards their interests. For additional information about the summit and to register, click here.
Earlier this week, domestic equities moved into the top-ranked position on our Dynamic Asset Level Investing (DALI) tool. This change has been touched on in various research articles throughout the week and will be a key point of today’s featured article as well. While the movement of domestic equities into the top position has not been surprising, the timing of the movement has raised some questions from our clients. It took a total of 116 market days for domestic equities to move from its COVID-induced low ranking of fourth out of the six broad asset classes on March 16th to the top position on August 25th. It is important to keep in mind, however, that changes on the DALI broad asset class rankings do not occur very often, as the tool is meant to be a long-term view of where relative strength lies across markets.
There have been seven instances where we have seen domestic equities transition back into the top-ranked asset class, including the most recent occurrence, throughout the history of the broad asset class rankings, which dates back to 12/31/2002. In order to examine how domestic equity markets typically fare following a move to the top of the DALI rankings, we pulled forward return data for the S&P 500 Index SPX from each historical date where the asset class regained leadership. In keeping with the long-term nature of the DALI tool, we see SPX typically show relatively muted losses on a near-term basis after a shift into the #1 ranking, however, the market benchmark typically displays significant gains three months down the road, with an average return of 3.36%. These returns are amplified as the time horizon expands, with an average return of 11.66% six months after taking the lead and an average gain of 15.57% over a one year forward return basis.

While these averages paint a positive picture for the long-term view of domestic equity markets following this week’s shift in relative strength, we are working with a small sample size for our examination. Every market environment is going to be different, and the environment in which we currently find ourselves certainly feels unique.
Even as major domestic equity indices have surpassed all-time highs, many investors are still doubtful that this recent rally will be sustained. This is displayed through the American Association of Individual Investors Sentiment Survey, which we track on the NDW system through the AAII Bull-Bear Spread AAIISPREAD. This reading depicts the percentage of those that are bullish in their market outlook minus those that are bearish, and based on the latest numbers that were released Thursday, we still have more bears than bulls as the reading sits at -7.54%. In addition to the normal chart of this reading, we have also taken these readings and smoothed them out via a 4-week moving average shown on the AAIISPREAD4WK chart. With data from this week, the 4-week average comes in at -13.99%, which did lead to a reversal up on the chart to -14. In looking at the history of this reading compared to price levels of the S&P 500 Index, we have never seen the 4-week spread this low while the market sits at all-time highs. Other times when the reading was low and SPX was near highs include February 1991, September 1992, and May 2013, which were all in the midst of prolonged periods of growth for domestic equities.


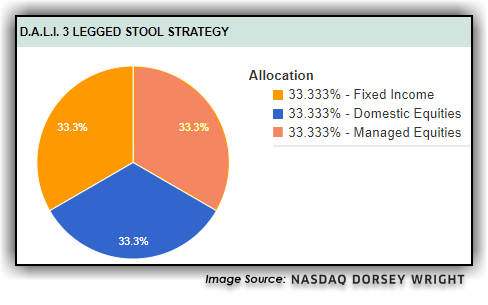
Earlier this week, we saw U.S. equities surpass fixed income for the #1 spot in DALI after having fallen from grace back in mid-March. On Wednesday, we spelled out the impact of this most recent ranking change across the suite of Tactical Tilt Models, all of which increased U.S. equity exposure at the expense of fixed income. Because there are now more than 5 signals separating U.S. equities and fixed income, today, we want to provide a quick review of the DALI-based strategies that employ the signal buffer rule and their allocations now that U.S. equities is firmly in the top spot. We do note that since the DALI-based strategies increased U.S. equity exposure earlier this month when the U.S. equities asset class surpassed cash for #2, most of the strategies that use the 5 signal buffer rule were unaffected by this most recent change. As it stands today, U.S. equities has 233 signals in its favor, lengthening the spread between #1 and #2 to nine signals. Below the DALI strategies update, we highlight one of the most-improved broad sectors within the DALI US sector breakdown and take a closer look at its corresponding sub-groups.

DALI-based Strategies Update


DALI US Sub-Sector Strength
When we dig into the DALI sector breakdown for U.S. equities, we can see where the shifts in strength are occurring across the U.S. equity landscape using the tally history link. Over the last 30 and 90 day periods, it has been the industrials sector that has gained the most tally signals, signaling that this is an area that is gaining traction. Recall that right before the COVID-19 sell-off swept across global markets, the industrials sector ranked third and had been considered a "high-RS sector," i.e., ranked in the top half of the sector rankings, since October 2016. That all changed on March 9, 2020, when industrials slid from #3 to #6 in just one day and continued to deteriorate even further over the next four months, where it moved as low as the tenth-ranked asset class in late-April and early May.

As it stands today, the industrials sector ranks seventh and trails the basic materials sector by just eight tally signals, so be sure to turn on your DALI alerts to be notified of any future sector or asset class changes. Despite being down -4.20% on a year-to-date basis, the broad industrials sector, using the Industrial Select Sector SPDR Fund XLI as a proxy, has managed to outperform the SPX on a 30, 60, and 90-day lookback. Additionally, XLI is up over 60% since the market bottom on March 23, outperforming the SPX by over 4%.
Industrials & Industrials Sub-Sectors
While the broader industrials sector has gained momentum over the last few months, not all areas within the sector are exhibiting solid long-term momentum. To identify which sub-sectors are participating more than others in the industrials sector, we ranked the +128 S&P 500 sub-industry groups by long-term relative strength. Currently, trucking and air freight & logistics both rank in the top quintile (best) of the SPX sub-industry groups, while airlines rank in the bottom quintile (worst) due to the fact that we are seeing more “stuff” being transported versus people. With Friday’s intraday action, the Dow Jones Transportation Index, the U.S.’s first stock market index that still tracks 20 of the most important companies in the sector, printed an X at 11,280, marking a new multi-year high and now sits about 3% off of its all-time high reached in September 2018.
Airlines
Recall that airlines were one of the hardest-hit areas of the U.S. economy as a result of the global pandemic, causing air travel to come to a virtual standstill. Although airlines are operating today, the International Air Transport Association, which represents most of the world's major airlines, does not expect the airline industry to recover from the coronavirus until 2024 (source: Business Insider). Many airlines charts, such as Southwest Airlines Co. LUV shown in the image below, have started to form big bases; however, they have yet to break out of them. In the case of LUV, a move to $49 or higher would move through resistance dating back to March and would signal that demand is in control, making the stock more actionable. We suggest waiting for charts like these to form bases as they continue to find a bottom. Although they may "seem" to have put in bottoms, we need further evidence of strength, especially as these companies could face lingering problems long after the virus is under control.

Trucking
Trucking, on the other hand, has thrived due in part to online shopping/e-commerce that has increased as a result of COVID-19 and the global economic shutdown. Trucking is the highest-ranked industrials sub-group at this time sitting in the seventh spot. The trucking group includes names like ODFL and J.B. Hunt Transport Services, Inc. JBHT. In the image below, we have a chart of JBHT. This stock is a solid 4 for 5'er that has given three consecutive buy signals and is trading in an overall positive trend. With yesterday's market action, JBHT printed an X at $144, marking a new all-time high for the stock. This recent rally has pushed JBHT into overbought territory with an OBOS% reading of 76%, so those looking to initiate new positions may want to scale in here or buy on a pullback/normalization of the trading band. From here, initial support sits at $126. Year-to-date, JBHT is up 22.28%, outpacing the SPX's return of 7.85%.

Air Freight & Logistics
Similar to trucking, the air freight & logistics sub-group is thriving due to the increased demand for goods versus services. Household names like United Parcel Service, Inc. UPS, and FedEx Corporation FDX are driving the strength of the air-fright subsector, both of which are perfect 5 for 5'ers. In its most recent earnings call, FDX reported a 72% increase in residential volumes versus last year and a 20% increase in FedEx group revenues (source: MarketWatch). FDX, shown in the image below, printed a new all-time high with today's action at $220. This stock has given five consecutive buy signals, confirming that demand is firmly in control. Additionally, FDX is one of just five SPX stocks that have moved to market RS buy signals over the last three weeks, telling us that FDX now possesses long-term strength when compared to the broader market. Year-to-date, FDX is up 44.30%, outpacing the SPX by over 36%. Note FDX is more than 150% overbought so those looking to initiate new long exposure may best be served on a pullback. From here, initial support sits at $168. FDX expects earnings on 9/15.

To generate the list of high-RS industrial stock ideas below, we used the Security Screener tool, housed under the Security Selection menu, to filter for high-RS, actionable industrial names within the S&P 500 Index. After adding a handful of screens to our search, we generated 17 ideas that we've listed in the table below. Note: if you run this screen any time after 8/28, your results may differ slightly due to the nature of the criteria.
High R.S. Industrials Stock Query Criteria:
| Symbol | Name | Price | Tech Attrib/Score | DWA Sector | Overbought/Oversold | ||
|---|---|---|---|---|---|---|---|
| ALLE | Allegion PLC | 103.24 |
3 |
Protection Safety Equipment |
|
||
| AMCR | Amcor PLC | 11.07 |
3 |
Business Products |
|
||
| AOS | A.O. Smith Corporation | 49.20 |
4 |
Building |
|
||
| APH | Amphenol Corporation | 108.10 |
5 |
Electronics |
|
||
| BA | The Boeing Company | 174.20 |
3 |
Aerospace Airline |
|
||
| GRMN | Garmin Ltd. | 102.57 |
5 |
Electronics |
|
||
| HWM | Howmet Aerospace Inc. | 17.43 |
4 |
Aerospace Airline |
|
||
| IT | Gartner, Inc. | 130.72 |
3 |
Business Products |
|
||
| J | Jacobs Engineering Group Inc. | 89.08 |
3 |
Building |
|
||
| PAYX | Paychex, Inc. | 76.54 |
3 |
Business Products |
|
||
| PCAR | PACCAR Inc. | 86.33 |
4 |
Autos and Parts |
|
||
| PKG | Packaging Corp of America | 102.10 |
3 |
Forest Prods/Paper |
|
||
| PKI | PerkinElmer, Inc. | 114.50 |
5 |
Electronics |
|
||
| ROK | Rockwell Automation, Inc. | 232.01 |
5 |
Electronics |
|
||
| ROP | Roper Technologies Inc. | 428.06 |
5 |
Machinery and Tools |
|
||
| TDG | TransDigm Group, Inc. | 498.32 |
5 |
Aerospace Airline |
|
||
| ZBRA | Zebra Technologies Corp | 277.26 |
5 |
Electronics |
|
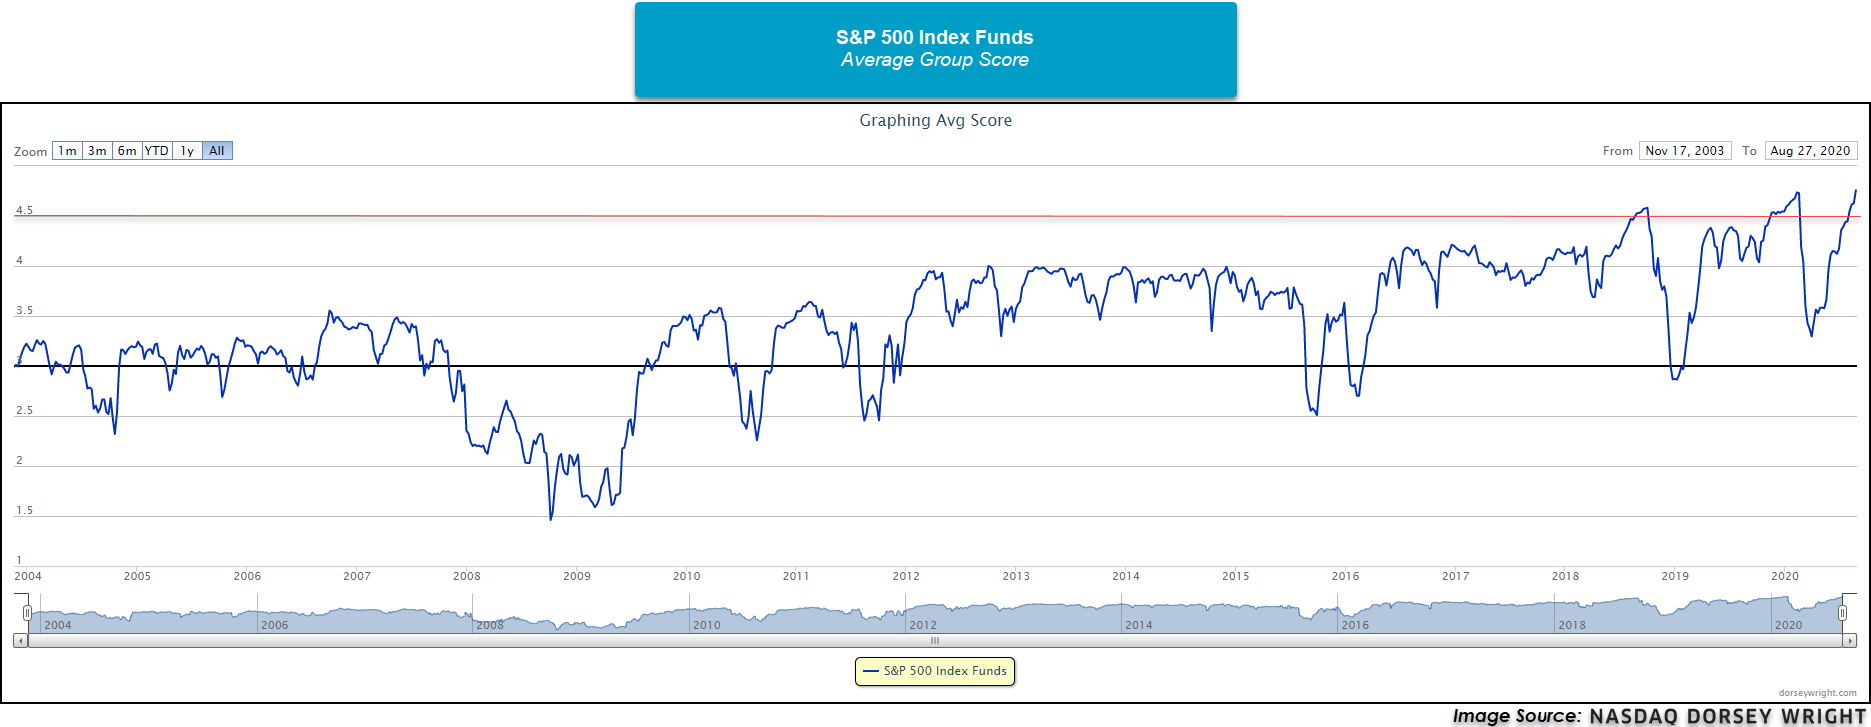
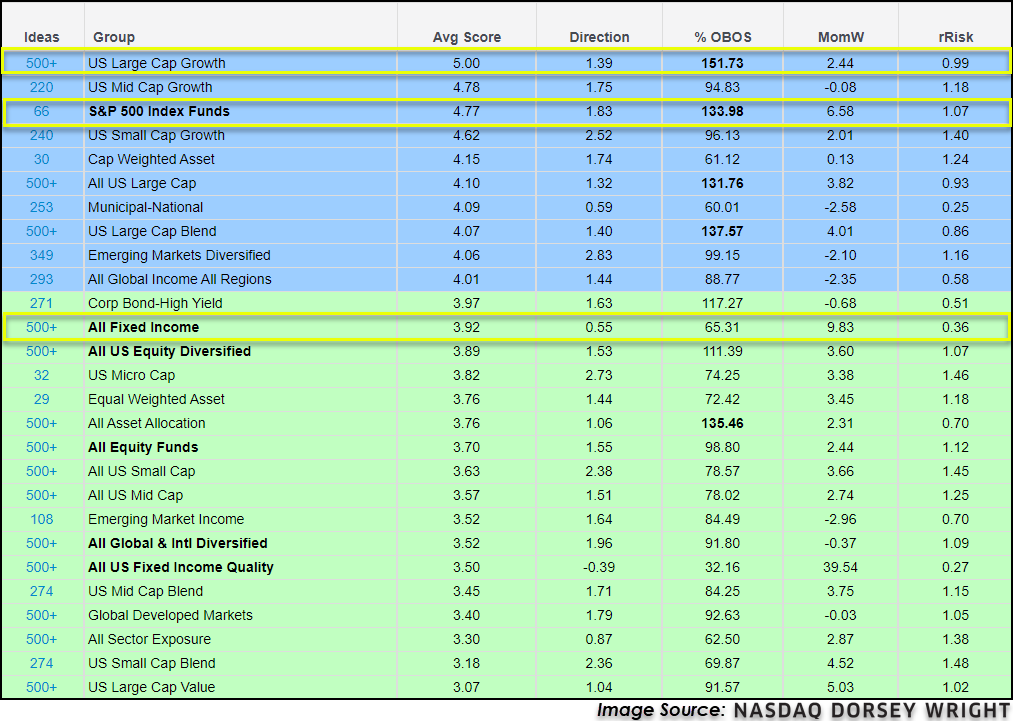
As major domestic indices continue higher and make all-time highs, the S&P 500 Index Funds group ranks atop the Macro view on the ACGS page with an average group score of 4.77, which is an all-time high for the group going back to 2002. Not only has the S&P 500 Index group been showing historic levels of strength, the US Equity Core Percent Rank is currently 94.37%, further evidencing the strength of the core US equity market. While a strong core is a major positive sign for domestic equity markets, the run-up has put the S&P 500 Index Funds group into overbought territory with an overbought/oversold reading of 133.98%. The evidence for large-cap domestic equity funds is overwhelmingly positive, but the historically high score and heavily overbought OBOS% reading for the group could be an indication for investors to tread a little more cautiously before entering large new positions. The S&P 500 Index Funds group has been above the 4.50 mark before and has continued to post positive returns after, most evidently in late 2019 until the COVID-19 sell-off where the S&P 500 Index SPX returned 7.61% (11/29/2019 – 2/14/2020) and currently where the SPX has returned 5.77% since crossing above the 4.50 mark on August 3.
Despite the two previous times the S&P 500 Index Funds group crossed above 4.50 mark, leading to heavy selling in late 2018 and early 2020, there isn’t any more evidence to justify expecting such moves again. The evidence is still very positive for domestic equities on the ACGS page although some of the stronger groups like Large Cap Growth and S&P 500 Index Funds look like they are overextended from a historic perspective. The All Fixed Income group has softened recently dropping below the 4.00 mark, but still maintains an average group score of 3.92 and a positive score direction of 0.55. This is another positive sign for US equity groups as fixed income groups typically do not score strongly during periods in which the core US market is as strong as it is today, which can be looked at more in-depth here.
As the core US equity market remains red hot, it is important to evaluate the risks associated with the group. Using it as a proxy, the S&P 500 Index group possesses strong score characteristics but its recent performance has put it into extremely overbought territory where those wishing to take new long positions may want to wait for price normalization or a pullback. The recent tick south in the All Fixed Income group relative strength adds more validity to the strength of the S&P 500 Index group, but we are still seeing fixed income groups on the ACGS possess strong average scores and most bond sleeves should remain beneficial to your total asset allocation. Moving forward, be sure to stay up to date on major market trends on the Asset Class Group Scores page and make sure you and your clients are allocated accordingly.

Average Level
40.81
| AGG | iShares US Core Bond ETF |
| USO | United States Oil Fund |
| DIA | SPDR Dow Jones Industrial Average ETF |
| DVY | iShares Dow Jones Select Dividend Index ETF |
| DX/Y | NYCE U.S.Dollar Index Spot |
| EFA | iShares MSCI EAFE ETF |
| FXE | Invesco CurrencyShares Euro Trust |
| GLD | SPDR Gold Trust |
| GSG | iShares S&P GSCI Commodity-Indexed Trust |
| HYG | iShares iBoxx $ High Yield Corporate Bond ETF |
| ICF | iShares Cohen & Steers Realty ETF |
| IEF | iShares Barclays 7-10 Yr. Tres. Bond ETF |
| LQD | iShares iBoxx $ Investment Grade Corp. Bond ETF |
| IJH | iShares S&P 400 MidCap Index Fund |
| ONEQ | Fidelity Nasdaq Composite Index Track |
| QQQ | Invesco QQQ Trust |
| RSP | Invesco S&P 500 Equal Weight ETF |
| IWM | iShares Russell 2000 Index ETF |
| SHY | iShares Barclays 1-3 Year Tres. Bond ETF |
| IJR | iShares S&P 600 SmallCap Index Fund |
| SPY | SPDR S&P 500 Index ETF Trust |
| TLT | iShares Barclays 20+ Year Treasury Bond ETF |
| GCC | WisdomTree Continuous Commodity Index Fund |
| VOOG | Vanguard S&P 500 Growth ETF |
| VOOV | Vanguard S&P 500 Value ETF |
| EEM | iShares MSCI Emerging Markets ETF |
| XLG | Invesco S&P 500 Top 50 ETF |
COLB Columbia Banking System, Inc. R ($28.11) - Banks - COLD is a 4 for 5'er that ranks in the top half of the banks sector matrix. In last week's trading, the stock gave a third consecutive buy signal when it broke a spread triple top at $32, taking out resistance dating back to June and recent flip to positive monthly momentum is a positive sign of the stock's potential for additional upside. COLB also comes with a 3.95% yield. Long exposure may be added in the $28 - $30 range and we will set our initial stop at $23, the third potential sell signal on COLB's default chart. We will use the bullish price objective of $46 as our target price, giving us a reward-to-risk ratio in excess of 3.0.
Long Ideas
Symbol
Company
Sector
Current Price
Action Price
Target
Stop
Notes
EBAY
eBay Inc.
Internet
$56.31
mid-to-upper 50s
100
46
5 for 5'er, top third of favored INET sector matrix, LT pos mkt RS, pullback from ATH
DECK
Deckers Outdoor Corporation
Textiles/Apparel
$210.82
low 200s to mid 230s
284
178
5 for 5'er, pullback from ATH, consec buy signals, pos mon mom, top 10% of DWATEXT
PLD
ProLogis
Real Estate
$101.90
hi 90s - mid 100s
116
87
5 for 5'er, top third of REAL sector matrix, spread triple top, pos monthly mom flip, 2.2% yield
ELY
Callaway Golf Company
Leisure
$20.43
mid/upper 10s
27.50
14.50
4 for 5'er, 6 consec buy signals, pos mon mom, top 1/3 of DWALEIS
V
Visa Inc.
Finance
$211.03
mid 190s - mid 200s
226
170
4 for 5'er, favored FINA sector matrix, spread quad top breakout, pos wkly & mnthly mom flips
SPGI
S&P Global Inc.
Media
$363.98
350s - 360s
407
304
5 for 5'er, top 25% of MEDI sector matrix, LT pos mkt RS, multi consec buys
ROK
Rockwell Automation, Inc.
Electronics
$232.01
220s - 230s
274
200
5 for 5'er, top 33% of ELEC sector matrix, LT pos mkt RS, spread triple top, 1.8% yield
MTH
Meritage Homes Corporation
Building
$98.45
99 - 108
112
88
5 for 5'er, #4 of 75 names in favored BUIL sector matrix, bullish catapult
ON
On Semiconductor Corp.
Semiconductors
$21.33
low 20s
36.50
18
4 for 5'er, consec buy signals, top 25% of fav DWASEMI, pos mon mom
COLB
Columbia Banking System, Inc.
Banks
$28.36
28 - 30
46
23
4 for 5'er, top half of BANK sector matrix, spread triple top, pos monthly mom flip, 3.95% yield
Short Ideas
Symbol
Company
Sector
Current Price
Action Price
Target
Stop
Notes
THS
TreeHouse Foods, Inc.
Food Beverages/Soap
$43.71
low to mid 40s
36
53
0 for 5'er, consec sell signals, LT market RS sell signal, bottom quartile of DWAFOOD
Removed Ideas
Symbol
Company
Sector
Current Price
Action Price
Target
Stop
Notes
DXCM
Dexcom Inc.
Healthcare
$427.75
410s to 470s
488
360
OK to add or maintain exposure here. Maintain $360 stop.
Follow-Up Comments
Comment
COST Costco Wholesale Corporation R ($347.32) - Retailing - We will now raise our stop to $292 a potential spread triple bottom break on COST's default chart.
DWA Spotlight Stock
17
18
19
20
48.00
C
48.00
47.00
X
O
47.00
46.00
X
O
1
•
46.00
45.00
X
X
X
O
X
O
X
•
•
45.00
44.00
X
O
X
O
X
O
X
O
3
4
O
6
•
44.00
43.00
X
O
A
O
X
O
O
X
O
X
O
X
O
•
43.00
42.00
X
1
X
B
2
X
O
X
O
X
O
•
•
42.00
41.00
C
O
X
X
X
O
X
O
•
O
X
O
C
•
C
•
41.00
40.00
X
O
4
O
6
O
X
O
•
5
9
X
O
•
X
O
•
40.00
39.00
X
2
X
O
X
O
9
•
O
X
O
•
•
A
O
•
39.00
38.00
X
3
X
5
X
8
X
•
A
B
O
X
X
•
X
•
X
2
•
38.00
37.00
X
O
O
O
X
•
O
X
O
1
O
X
O
7
O
X
O
•
37.00
36.00
X
O
•
O
X
O
X
O
X
O
X
O
9
O
•
36.00
35.00
X
•
O
X
O
X
3
X
5
X
8
X
O
•
Top
35.00
34.00
B
•
O
X
O
O
4
O
X
O
X
O
•
34.00
33.00
X
•
O
X
O
X
6
•
O
•
O
•
33.00
32.00
X
•
O
O
X
•
•
3
•
X
32.00
31.00
8
•
O
•
O
•
X
X
8
O
31.00
30.00
O
7
•
•
O
•
X
O
X
O
X
O
30.00
29.00
O
X
•
O
X
X
X
•
X
O
X
7
O
X
O
29.00
28.00
5
X
•
O
X
O
X
O
X
X
X
O
•
X
O
X
O
X
O
O
Mid
28.00
27.00
6
•
O
X
O
X
O
X
O
4
X
O
X
O
X
•
6
O
X
O
X
•
•
27.00
26.00
•
O
X
O
X
O
X
O
X
O
X
O
X
O
X
O
X
O
O
•
26.00
25.00
O
O
O
X
O
X
O
X
O
X
5
X
O
X
•
25.00
24.00
O
O
X
O
O
X
O
X
O
•
24.00
23.00
O
X
O
O
X
•
23.00
22.00
O
O
X
•
22.00
21.00
O
X
•
Bot
21.00
20.00
O
X
•
20.00
19.50
O
•
19.50
17
18
19
20
Create Portfolio
Create Portfolio

| BLDR Builders FirstSource, Inc. ($31.78) - Building - BLDR broke a double top at $32, marking the second consecutive buy signal on the chart. This stock is a 5 for 5’er that ranks 7th out of 75 names in the favored building sector RS matrix. Monthly momentum just flipped positive, suggesting the potential for higher prices. From here, initial support sits at $28. |
| CAR Avis Budget Group, Inc. ($35.11) - Retailing - CAR broke a double top at $35, marking the second consecutive buy signal on the chart. CAR is a 5 for 5’er within the favored retailing sector that is showing superior strength versus the market and its peers. Monthly momentum has been positive for one month, suggesting the potential for higher prices. From here, initial support sits at $30 while resistance lies at $36. |
| CHDN Churchill Downs Inc ($178.29) - Gaming - CHDN broke a double top at $180 before moving higher to $182 on Friday. This stock is now trading at new all-time highs with 4 out of 5 attributes in its favor. Monthly momentum just flipped positive, and CHDN is trading in an overall positive trend. From here, initials support sits at $168. |
| GH Guardant Health, Inc. ($96.05) - Biomedics/Genetics - GH broke a triple top at $97, marking the stock’s fourth consecutive buy signal. GH is a 4 for 5’er within the biomedics/genetics sector that moved into a positive trend earlier this month. From here, support sits at $93. |
| HLT Hilton Worldwide Holdings Inc ($91.39) - Leisure - HLT broke a double top at $91, marking the stock's fourth consecutive buy signal. HLT is a 3 for 5'er within the favored leisure sector that has maintained a long-term market RS buy signal since January 2018. Monthly momentum just flipped positive, and HLT has a price target of $100. From here, support sits at $87, while resistance lies at $93. |
| MSGS Madison Square Garden Sports C ($171.50) - Leisure - MSGS completed a bullish triangle on Friday with a double top breakout at $170. Today’s move marks the third consecutive buy signal for the 3 for 5’er within the favored leisure sector. Monthly momentum just flipped positive. From here, initial support sits at $162. |
| PLAN Anaplan, Inc. ($61.60) - Internet - PLAN broke a double top at $63 on Friday and is now up against its all-time high reached in February of this year. PLAN is a 4 for 5’er within the favored internet sector that moved back into a positive trend last week. Additionally, monthly momentum just flipped positive, suggesting the potential for higher prices. From here, support sits at $57. |
| TXRH Texas Roadhouse, Inc. ($65.02) - Restaurants - TXRH broke a double top at $64 before moving higher to $65 on Friday. This marks the stock's third consecutive buy signal since July. TXRH is a 3 for 5'er that ranks 8th out of 26 names in the favored restaurants sector RS matrix. Monthly momentum just flipped positive, adding to the positive technical picture. Support sits at $60 while resistance lies at $72. TXRH provides a yield of 2.88%. |
| VICR Vicor Corp ($87.45) - Electronics - VICR broke a quadruple top at $85 before rallying to $88 on Friday. As a result, the stock is now trading at new all-time highs with all 5 attributes in its favor. VICR has maintained a long-term market RS buy signal since December 2019, adding to the positive technical picture. From here, support sits at $80. |
| YEXT Yext Inc ($18.69) - Software - YEXT broke a double top at $18.50 before moving higher to $19 on Friday. This marks the fourth consecutive buy signal for YEXT, signaling that demand is in control. This stock is a 3 for 5’er within the software sector that just experienced a flip to positive weekly momentum. From here, support sits at $16, while YEXT faces resistance at $22. Note earnings are expected on 9/3. |
| Name | Option Symbol | Action | Stop Loss |
|---|---|---|---|
| Paypal Holdings Inc - $204.48 | O: 20K200.00D20 | Buy the November 200.00 calls at 19.75 | 186.00 |
| Name | Option | Action |
|---|---|---|
| Fastenal Company ( FAST) | Nov. 40.00 Calls | Raise the option stop loss to 7.20 (CP: 9.20) |
| CSX Corporation ( CSX) | Nov. 65.00 Calls | Raise the option stop loss to 11.25 (CP: 13.25) |
| Boston Scientific Corporation ( BSX) | Nov. 35.00 Calls | Raise the option stop loss to 4.75 (CP: 6.75) |
| Name | Option Symbol | Action | Stop Loss |
|---|---|---|---|
| Seagate Technology - $46.60 | O: 20X47.50D18 | Buy the December 47.50 puts at 4.60 | 51.00 |
| Name | Option | Action |
|---|---|---|
| Gilead Sciences, Inc. (GILD) | Nov. 70.00 Puts | Initiate an option stop loss of 4.50 (CP: 6.50) |
| Name | Option Sym. | Call to Sell | Call Price | Investment for 500 Shares | Annual Called Rtn. | Annual Static Rtn. | Downside Protection |
|---|---|---|---|---|---|---|---|
| Microchip Technology Incorporated $107.41 | O: 20L115.00D18 | Dec. 115.00 | 6.75 | $52,471.35 | 27.80% | 17.32% | 5.05% |
| Name | Action |
|---|---|
| Wendy's Company (WEN) - 21.51 | Sell the November 22.00 Calls. |
| Teradyne, Inc. (TER) - 84.78 | Sell the January 97.50 Calls. |
| eBay Inc. (EBAY) - 56.31 | Sell the January 60.00 Calls. |
| PulteGroup, Inc. (PHM) - 45.75 | Sell the January 50.00 Calls. |
| Qorvo Inc. (QRVO) - 127.14 | Sell the November 135.00 Calls. |
| Bank of America (BAC) - 26.05 | Sell the December 27.00 Calls. |
| eBay Inc. (EBAY) - 56.31 | Sell the January 60.00 Calls. |
| Canadian Natural Resources Ltd. (CNQ) - 20.03 | Sell the December 21.00 Calls. |
| Ally Financial Inc. (ALLY) - 23.14 | Sell the December 24.00 Calls. |
| Name | Covered Write |
|---|---|
|
|
|
Daily Equity & Market Analysis
Loading, Please Wait...
