
Most Requested Symbols

We take a look at how actively managed funds have fared during the recent market downturn.
Near-term domestic equity improvement has led the Money Market Percentile Rank (MMPR) to push further south, however, low volatility equities continue to score well below our cash proxy.
The average distribution reading is 24.30% overbought.
Today's featured stock is Verisk Analytics, Inc. (VRSK)
AAPL, ACGL, AMC, ARNA, BJ, CCXI, IBP, ROST, UHT, & ZM.
Call: PulteGroup (PHM), Put: Vornado Realty Trust (VNO), Covered Write: CSX Corp (CSX)
Market Update Webinar Rescheduled - Due to the Memorial Day holiday, next week's Market Update webinar has been rescheduled for Tuesday, May 26 at 1:00 p.m. ET. Those who have already signed up will remain registered. If you haven't already registered but would like to, click here. Reminder that the webinar will be recorded and made available to all registrants who are existing subscribers following the live presentation.
Replay of Monday's Market Update Webinar - We now have the replay available from our Monday, May 18th market update webinar. Links to the video and presentation slides are provided below.
Click here to access the replay
Click here to access the slides
Beginners Series Webinar - Join us on Friday, May 22nd at 2 PM (ET) for our NDW Beginners Series Webinar. This week's topic is Understanding the Asset Class Group Scores Page. Register here.
The technical stars have aligned for Dow, Inc. DOW and DuPont de Nemours Inc. DD, as each stock entered strong attribute territory earlier this week for the first time. As a reminder, a “strong attribute” stock is one that has at least 3 of the 5 total attributes possible in its favor. For a study on the quantitative benefits of owning strong attribute stocks, see our technical attribute research paper here.
DowDupont, a culmination of Dow Chemical and the 217-year old El du Pont de Nemours, separated its business into three distinct chemical companies last year. For those curious about the distinction, according to Barron’s: Dow focuses on commodity chemical production, DuPont on specialty chemical production, and Corteva on agricultural chemicals (Source: Barron’s.com). Since the breakup, the stock market has been generally unkind to the new shares. Dow, Inc. DOW (a member of the Dow Jones Industrial Average DJIA), DuPont de Nemours Inc. DD, and Corteva Inc. CTVA generally trended lower in 2019 and throughout the first quarter of 2020, dampening current year-to-date return figures of -33.89%, -23.88%, and -15.12% for the three companies, respectively (through 5/20). That said, since posting a bottom at the end of March, shares of DOW and DD have gained notable momentum, most recently breaking through their respective bearish resistance lines to reach strong attribute territory earlier this week on May 18th.
As for DOW and DD, this is the first time the two entities have possessed strong technical attribute ratings at the same time, and more interestingly, the deciding event occurred on the very same day. DOW currently trades on a Point & Figure buy signal, in a positive trend, and is testing resistance at the $38 level and has initial support available at $31 which is also where the bullish support line currently lies. DD also trades on a Point & Figure buy signal, in a positive trend, and sits against resistance at $49 and has initial support available at $42. To monitor for further improvements in the technical attribute ratings for each stock, make sure to click the “Set Activity Alert” button and toggle on “Positive Attribute Changes” at the bottom of the list.
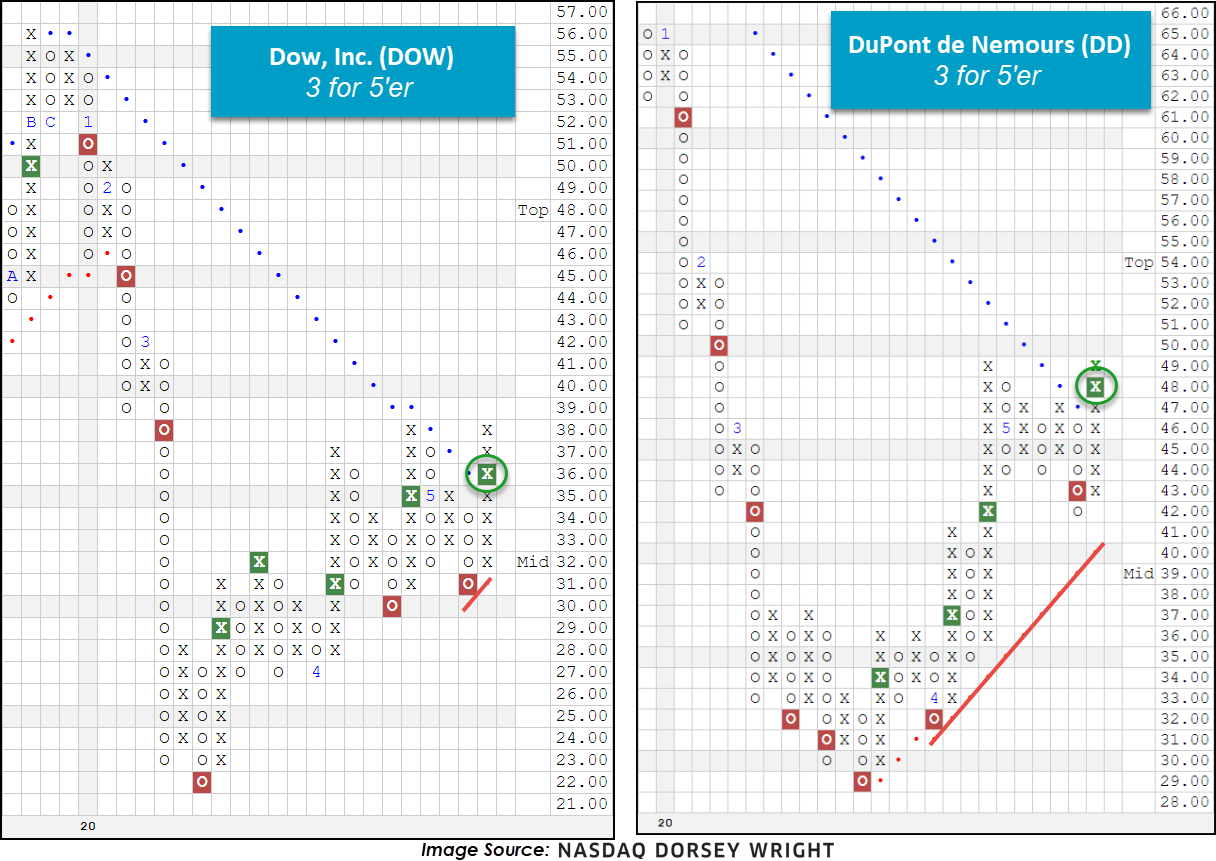
*For those reviewing the relative strength (RS) sections for DOW, DD, or CTVA and noticing the asterisk to the right of a signal, this is telling us that there is not yet enough chart information to determine a “true” signal. A “true” signal is defined as a column of Xs or Os advancing higher or lower, respectively, than the previous column and requires at least 3 columns to determine. For that matter, such will not count in favor of a security’s technical attribute rating until a “true” signal is given. Note this can be a common finding with newly traded names.

We have previously talked about the ongoing debate regarding active vs. passive management. Proponents of passive management insist that active managers cannot consistently outperform a passive benchmark and therefore investors are better off to invest in lower cost index funds. Meanwhile, those in the active camp maintain that through their analysis and expertise active managers are able to produce persistent alpha. The question of active vs. passive is often framed with the premise that active or passive is always superior and focuses largely on the U.S. equity market. However, all markets are not the same and so we should examine the merits of each style on a market-by-market basis instead of taking a one-size-fits-all approach.
The key determinate of which strategy, active or passive, is superior is market efficiency. Market efficiency describes the degree to which asset prices quickly and rationally adjust to reflect new information. In a highly-efficient market, any new information is quickly incorporated into prices and therefore it is not possible to consistently achieve above average risk-adjusted returns in this type of market. Therefore, due to their lower cost, passive investment strategies are favored over active management in a highly-efficient market. In less efficient markets, on the other hand, the opportunity exists for skilled active managers to outperform passive strategies, thereby adding value for clients.
As mentioned above, the active vs. passive debate often examines only large cap U.S. equities, which is a natural starting point for the discussion – the large cap U.S. equity market is composed of the most well-known companies in the world and represents a large portion of many retirement portfolios. However, if we stop there we ignore what should be an obvious and fundamental element of the discussion – the various markets around the globe are unlikely to all be equally efficient. The very fact that that U.S. large cap companies are the most visible and researched firms in the world suggests that the U.S. large cap equity market is likely to be more efficient than its less-well-known counterparts!
In addition to variation across markets, individual markets can also have different characteristics in distinct time periods. During the 10-year bull market from 2009 – 2019 active managers, especially in the U.S. large cap space, often struggled to match the performance of their benchmarks. One common refrain from the active camp during that time period was that active managers were skilled at identifying quality and outperformed in down/volatile markets. As measured by the VIX, March was the most volatile month on record, so with that in mind we wanted to see how things shook out.
Below we've looked at the rankings of passive benchmark-tracking ETFs across five markets, U.S. large cap, U.S. small cap, international developed, emerging markets, and domestic fixed income. The graphs break each universe down into quartiles. If the passive fund is in the top two quartiles, that means that it outperformed the majority of managers in that market. We are primarily concerned with the two left-most bars in each image which display the rankings for the month of March and for the entire first quarter.


As you can see, between the domestic equity markets, active managers appear to have done best in the small cap space as the Russell 2000 Index Fund ranks right around the 50th percentile for both March and 1Q20, meaning that about half of active managers outperformed the passive benchmark. In the large cap space, the SPDR S&P 500 ETF SPY ranked within the top half of the universe in both March and Q1, meaning that less than half of the active managers in the space outperformed it.


In both the international and emerging market equity markets our passive funds ranked well above the median for both March and 1Q20 as a whole. The recent underperformance of active in these spaces is somewhat surprising, as we can also see that the passive funds fall in the bottom half of the rankings over the longer time periods displayed.

Clearly market volatility was not helpful to active US fixed income managers in this case. The passive index ranks in the bottom two quartiles over the longer time periods, but was well within the top quartile in March and Q1. Overall, the assertion that active management outperforms during down/volatile markets does not appear to have held true in this case as the passive funds did not rank in the bottom half for either the month of March or 1Q20 in any of the five markets we examined. Of course, one month's or one quarter's results are not enough for us to draw any sweeping conclusions, but, at least in this most recent downturn, the average active fund doesn't appear to have fared any better than the passive benchmarks.
The past week has seen volatility in domestic equity markets continue, however, the movement has largely led to technical improvement on the individual charts of the major domestic equity indexes. One area that we have continued to focus on has been the 20-point chart of the S&P 500 Index SPX, which we saw continue higher earlier this week to move back to a positive trend at the 2960 level before pushing further to 2980 following trading Wednesday. We have seen this domestic equity improvement reflected at the top end of the Asset Class Group Scores page as well, with eight domestic equity-focused groups now scoring north of the 4.00 average score line and only three fixed income areas maintaining this higher field position. Recent strength has been especially noteworthy in the US mid-cap growth and aggressive growth groups, as we continue to see growth push higher on the heels of the US large-cap growth camp. Precious metals have also been an area of some significant improvement in recent weeks, with a specific focus on the recent rally in silver that was discussed in yesterday’s Alternative Investment Spotlight.

The “risk-on” strength that continues to be displayed at the top of the ACGS page is furthered by the continued fall of the Money Market Percentile Rank (MMPR), which has moved south to 35% following trading on Wednesday. In looking at the cash proxy used in the MMPR, we see that the US money market group has continued to show a downtick in its average score, with other areas continuing to push higher. US money market comes in at a recent score posting of 2.45, with quite a few other areas scoring just below the space. Namely, we see that the all mid-cap, growth & income, industrial, and Japan groups have each shown a near-term rise in score to be poised just beneath the US money market group. Keep an eye on these spaces for further follow through to the upside that may lead the MMPR to continue lower.
One group that still sits below money market but has perhaps surprisingly not shown improvement has been low volatility equities. This group comes in at an average score of 2.13 and a negative score direction of -1.85, further indicating its lack of near-term strength. In fact, we see through a view of the historical group score of the low volatility space that this recent posting marks the lowest score since the creation of the group in March of last year.

When we take a look underneath the hood at the funds that make up this space, we see a majority of the weaker scoring areas stemming from laggard areas such as international equities and small-caps. With that said, the large-cap focused low volatility space has not held up well compared to its broader benchmarks, with the Invesco S&P 500 Low Volatility Portfolio SPLV showing a year-to-date return of -17.72%, more than twice the decline of SPX at a return of -8.02%.
The addition of another growth-oriented factor onto the low volatility screen has played out better, as we see displayed through the First Trust Dorsey Wright Momentum & Low Volatility ETF DVOL. This fund has advanced off its recent bottom of $14.75 to give two consecutive buy signals and currently sits at a double top formation at $20. A movement to $20.50 would complete a bullish catapult pattern, furthering its improved technical picture. The 3.37 recent score posting of DVOL also bests the average low volatility fund at 2.18 as well as the average growth & income fund at 2.42. The ETF also carries a low relative-risk score of 0.93 and a yield of 1.97. The recent improvement has left initial support offered at $19.25 with further support at $19 and $18.75.


Average Level
24.30
| AGG | iShares US Core Bond ETF |
| USO | United States Oil Fund |
| DIA | SPDR Dow Jones Industrial Average ETF |
| DVY | iShares Dow Jones Select Dividend Index ETF |
| DX/Y | NYCE U.S.Dollar Index Spot |
| EFA | iShares MSCI EAFE ETF |
| FXE | Invesco CurrencyShares Euro Trust |
| GLD | SPDR Gold Trust |
| GSG | iShares S&P GSCI Commodity-Indexed Trust |
| HYG | iShares iBoxx $ High Yield Corporate Bond ETF |
| ICF | iShares Cohen & Steers Realty ETF |
| IEF | iShares Barclays 7-10 Yr. Tres. Bond ETF |
| LQD | iShares iBoxx $ Investment Grade Corp. Bond ETF |
| IJH | iShares S&P 400 MidCap Index Fund |
| ONEQ | Fidelity Nasdaq Composite Index Track |
| QQQ | Invesco QQQ Trust |
| RSP | Invesco S&P 500 Equal Weight ETF |
| IWM | iShares Russell 2000 Index ETF |
| SHY | iShares Barclays 1-3 Year Tres. Bond ETF |
| IJR | iShares S&P 600 SmallCap Index Fund |
| SPY | SPDR S&P 500 Index ETF Trust |
| TLT | iShares Barclays 20+ Year Treasury Bond ETF |
| GCC | WisdomTree Continuous Commodity Index Fund |
| VOOG | Vanguard S&P 500 Growth ETF |
| VOOV | Vanguard S&P 500 Value ETF |
| EEM | iShares MSCI Emerging Markets ETF |
| XLG | Invesco S&P 500 Top 50 ETF |
| Symbol | Company | Sector | Current Price | Action Price | Target | Stop | Notes |
|---|---|---|---|---|---|---|---|
| HLI | Houlihan Lokey Inc | Banks | $59.43 | upper $50s - mid to upper 60s | $68 | $49 | 5 for 5'er, pullback from AT high, consec buy signals, top 25% of DWABANK, pos week mom, 2.09% yield |
| ATSG | Air Transport Services Group Inc. | Aerospace Airline | $21.08 | low 20s | 33.50 | 17.50 | 4 for 5'er, top third of favored AERO sector matrix, spread quad top, pot. covered write, R-R>3.0 |
| ABBV | AbbVie Inc. | Drugs | $91.19 | 82 - 89 | 100 | 71 | 3 for 5'er, favored DRUG sector, triple top breakout, 5.6% yield |
| KKR | KKR & Co. L.P | Finance | $26.69 | mid-to-upper 20s | 44.50 | 21 | 4 for 5'er, top half of FINA sector matrix, triple top, 2.2% yield, cov. write opp., R-R>4.0 |
| ICE | IntercontinentalExchange Inc. | Wall Street | $93.45 | 90s | 125 | 77 | 5 for 5'er, top 25% of WALL sector matrix, LT pos mkt RS, multi consec buy signals, 1.3% yield |
| DGX | Quest Diagnostics Incorporated | Healthcare | $113.96 | mid $110s to $130s | $132 | $92 | 4 for 5'er, pullback from AT high, consec buy signals, top 25% of favored healthcare sector, 2.02% yield |
| WGO | Winnebago Industries, Inc. | Leisure | $55.01 | 53 - 57 | 61 | 44 | 5 for 5'er, #2 of 43 names in favored LEIS sector matrix, new RS buy signal, pot. cov write, Earn. 6/17 |
| VRSK | Verisk Analytics, Inc. | Business Products | $159.54 | high 150s to 170s | $184 | $126 | 5 for 5'er, LT market & peer RS buy, consec buy signals, LT pos trend |
| Symbol | Company | Sector | Current Price | Action Price | Target | Stop | Notes |
|---|---|---|---|---|---|---|---|
| HSBC | HSBC Holding PLC (United Kingdom) ADR | Banks | $25.13 | (26 - 23) | 17 | 28 | 1 for 5'er, bottom third of unfavored BANK sector matrix, LT neg mkt RS, multi sell signals, lower tops and lower bottoms |
| Symbol | Company | Sector | Current Price | Action Price | Target | Stop | Notes |
|---|---|---|---|---|---|---|---|
| CIEN | CIENA Corporation | Telephone | $52.95 | upper 40s to mid 50s | $58 | $42 | See follow comment below. |
| FNV | Franco-Nevada Corp. | Precious Metals | $147.64 | 140s to mid 150s | 171 | 118 | See follow comment below. |
| Comment |
|---|
| CIEN CIENA Corporation R ($51.94) - Telephone - CIEN has moved outside of our actionable range. We will raise our stop to $42, which would violate multiple levels of support on CIEN's default chart. |
| FNV Franco-Nevada Corp. R ($144.42) - Precious Metals - FNV moved to a sell signal. No new positions here. We will maintain our $118 stop. |
VRSK Verisk Analytics, Inc. R ($158.17) - Business Products - VRSK is a perfect 5 for 5’er that continues to trade well above its bullish support line that dates to July 2017. In addition, VRSK has maintained a long-term market RS buy signal since September 2011 while its peer RS buy signal has been in place since August 2011. Currently, VRSK ranks in the top half of the favored business products sector. This stock has given five consecutive buy signals since March and sits just one box away from a sixth at $162. New long exposure may be initiated in the high $150s to 170s. We will set our initial stop loss at $126, which would take out multiple levels of support on VRSK’s default chart. We will use the stock’s bullish price objective of $184 as our near-term price target.
| 17 | 18 | 19 | 20 | ||||||||||||||||||||||||||||||||||||||||||||||||||
| 170.00 | X | X | 170.00 | ||||||||||||||||||||||||||||||||||||||||||||||||||
| 168.00 | X | O | X | O | X | 168.00 | |||||||||||||||||||||||||||||||||||||||||||||||
| 166.00 | 2 | O | X | O | X | O | 166.00 | ||||||||||||||||||||||||||||||||||||||||||||||
| 164.00 | 9 | X | O | O | X | O | 164.00 | ||||||||||||||||||||||||||||||||||||||||||||||
| 162.00 | X | O | X | O | X | O | 162.00 | ||||||||||||||||||||||||||||||||||||||||||||||
| 160.00 | X | O | X | X | O | X | O | X | X | 160.00 | |||||||||||||||||||||||||||||||||||||||||||
| 158.00 | X | O | X | O | X | X | O | X | O | X | X | O | X | 158.00 | |||||||||||||||||||||||||||||||||||||||
| 156.00 | X | O | X | O | X | O | X | O | 3 | O | X | X | O | X | O | X | 156.00 | ||||||||||||||||||||||||||||||||||||
| 154.00 | 8 | O | A | X | O | X | O | X | O | X | O | X | X | O | X | O | X | 154.00 | |||||||||||||||||||||||||||||||||||
| 152.00 | X | O | O | 1 | O | X | O | X | O | X | X | O | X | O | X | O | 152.00 | ||||||||||||||||||||||||||||||||||||
| 150.00 | X | O | C | O | O | X | O | X | O | X | O | X | 5 | 150.00 | |||||||||||||||||||||||||||||||||||||||
| 148.00 | 7 | O | X | O | X | O | X | X | O | X | O | X | Mid | 148.00 | |||||||||||||||||||||||||||||||||||||||
| 146.00 | 6 | O | X | O | O | X | X | O | X | X | O | X | O | 146.00 | |||||||||||||||||||||||||||||||||||||||
| 144.00 | X | B | X | O | X | O | X | O | X | X | O | X | O | 144.00 | |||||||||||||||||||||||||||||||||||||||
| 142.00 | 5 | O | X | O | X | O | X | O | X | O | X | O | X | • | 142.00 | ||||||||||||||||||||||||||||||||||||||
| 140.00 | X | O | X | O | X | O | X | O | X | O | X | O | X | • | 140.00 | ||||||||||||||||||||||||||||||||||||||
| 138.00 | X | O | X | O | X | O | X | O | X | O | X | X | 4 | X | • | 138.00 | |||||||||||||||||||||||||||||||||||||
| 136.00 | X | O | O | X | O | X | O | X | O | X | O | X | O | X | • | 136.00 | |||||||||||||||||||||||||||||||||||||
| 134.00 | 4 | O | X | O | X | O | X | O | X | O | X | O | • | 134.00 | |||||||||||||||||||||||||||||||||||||||
| 132.00 | X | O | O | X | O | X | O | X | O | X | • | 132.00 | |||||||||||||||||||||||||||||||||||||||||
| 130.00 | X | O | O | X | O | X | O | X | • | 130.00 | |||||||||||||||||||||||||||||||||||||||||||
| 128.00 | 3 | O | X | O | X | O | • | 128.00 | |||||||||||||||||||||||||||||||||||||||||||||
| 126.00 | X | O | X | O | X | • | 126.00 | ||||||||||||||||||||||||||||||||||||||||||||||
| 124.00 | X | X | O | O | X | • | 124.00 | ||||||||||||||||||||||||||||||||||||||||||||||
| 122.00 | X | B | O | X | O | X | • | 122.00 | |||||||||||||||||||||||||||||||||||||||||||||
| 120.00 | 9 | O | X | O | 2 | O | X | • | 120.00 | ||||||||||||||||||||||||||||||||||||||||||||
| 118.00 | X | O | X | C | X | O | • | 118.00 | |||||||||||||||||||||||||||||||||||||||||||||
| 116.00 | 8 | A | X | O | X | • | • | 116.00 | |||||||||||||||||||||||||||||||||||||||||||||
| 114.00 | X | O | X | O | X | • | 114.00 | ||||||||||||||||||||||||||||||||||||||||||||||
| 112.00 | 7 | O | O | X | • | 112.00 | |||||||||||||||||||||||||||||||||||||||||||||||
| 110.00 | 6 | O | 1 | • | Bot | 110.00 | |||||||||||||||||||||||||||||||||||||||||||||||
| 108.00 | 4 | X | O | X | • | 108.00 | |||||||||||||||||||||||||||||||||||||||||||||||
| 106.00 | X | O | X | O | X | • | 106.00 | ||||||||||||||||||||||||||||||||||||||||||||||
| 104.00 | 3 | O | X | O | • | 104.00 | |||||||||||||||||||||||||||||||||||||||||||||||
| 102.00 | X | 5 | X | • | 102.00 | ||||||||||||||||||||||||||||||||||||||||||||||||
| 100.00 | X | X | O | X | • | 100.00 | |||||||||||||||||||||||||||||||||||||||||||||||
| 99.00 | X | O | X | O | X | • | 99.00 | ||||||||||||||||||||||||||||||||||||||||||||||
| 98.00 | X | 1 | O | X | O | X | • | 98.00 | |||||||||||||||||||||||||||||||||||||||||||||
| 97.00 | C | O | X | 2 | X | O | X | • | 97.00 | ||||||||||||||||||||||||||||||||||||||||||||
| 96.00 | X | O | X | O | X | X | O | • | 96.00 | ||||||||||||||||||||||||||||||||||||||||||||
| 95.00 | X | O | X | O | X | O | X | • | 95.00 | ||||||||||||||||||||||||||||||||||||||||||||
| 94.00 | X | O | O | X | O | X | • | 94.00 | |||||||||||||||||||||||||||||||||||||||||||||
| 93.00 | X | O | O | X | • | 93.00 | |||||||||||||||||||||||||||||||||||||||||||||||
| 92.00 | X | O | X | • | 92.00 | ||||||||||||||||||||||||||||||||||||||||||||||||
| 91.00 | X | O | • | 91.00 | |||||||||||||||||||||||||||||||||||||||||||||||||
| 90.00 | X | • | 90.00 | ||||||||||||||||||||||||||||||||||||||||||||||||||
| 89.00 | X | • | 89.00 | ||||||||||||||||||||||||||||||||||||||||||||||||||
| 88.00 | • | X | X | • | 88.00 | ||||||||||||||||||||||||||||||||||||||||||||||||
| 87.00 | X | • | X | O | X | • | 87.00 | ||||||||||||||||||||||||||||||||||||||||||||||
| 86.00 | X | O | • | X | O | B | • | 86.00 | |||||||||||||||||||||||||||||||||||||||||||||
| 85.00 | X | O | • | 7 | 8 | X | • | 85.00 | |||||||||||||||||||||||||||||||||||||||||||||
| 84.00 | 2 | O | X | O | A | • | 84.00 | ||||||||||||||||||||||||||||||||||||||||||||||
| 83.00 | X | O | X | X | O | X | • | 83.00 | |||||||||||||||||||||||||||||||||||||||||||||
| 82.00 | X | 3 | X | O | 6 | O | 9 | • | 82.00 | ||||||||||||||||||||||||||||||||||||||||||||
| 81.00 | O | X | O | X | O | X | • | 81.00 | |||||||||||||||||||||||||||||||||||||||||||||
| 80.00 | O | X | 5 | X | O | X | • | 80.00 | |||||||||||||||||||||||||||||||||||||||||||||
| 79.00 | 4 | O | X | O | • | 79.00 | |||||||||||||||||||||||||||||||||||||||||||||||
| 78.00 | O | X | • | 78.00 | |||||||||||||||||||||||||||||||||||||||||||||||||
| 77.00 | • | O | X | • | 77.00 | ||||||||||||||||||||||||||||||||||||||||||||||||
| 76.00 | • | O | • | 76.00 | |||||||||||||||||||||||||||||||||||||||||||||||||
| 17 | 18 | 19 | 20 |

| AAPL Apple Inc. ($316.77) - Computers - Shares of AAPL rose Thursday to break a double top at $320, marking a fourth consecutive buy signal. This 5 for 5'er moved back to a positive trend at the end of March and ranks in the top half of the favored computers sector RS matrix. The stock has also been on an RS buy signal against the market since early-2004 and recently reversed back up into a column of Xs on its market RS chart at the beginning of May. The overall technical picture remains strong. Those looking to add exposure can consider AAPL at current levels or on a pullback as the stock may be nearing overbought territory. Initial support can be found at $304 with further support offered at $268. The potential for overhead resistance may come into play at all-time highs of $324 from the beginning of the year. |
| ACGL Arch Capital Group Ltd. ($27.51) - Insurance - ACGL returned to a buy signal on Thursday with a double top break at $27. This stock is a 3 for 5’er that has been trading in a positive trend since December 2001. Weekly momentum has been positive for three weeks, suggesting the potential for higher prices. From here, support sits at $21. |
| AIMC Altra Industrial Motion Corp. ($28.92) - Machinery and Tools - AIMC moved higher Thursday to break a double top at $29. This 3 for 5'er moved to a positive trend at the end of April and ranks 3rd out of 63 names in the machinery and tools sector RS matrix. The weight of the technical evidence continues to improve here. Note that the stock is currently at resistance from April, while initial support is offered at $24. |
| ARNA Arena Pharmaceuticals, Inc. ($56.34) - Biomedics/Genetics - Arena Pharmaceuticals broke a double top at $55 today to return to a buy signal before advancing further past resistance to $56. This 4 for 5'er returned to a positive trend in early April and has maintained a market RS buy signal since January of 2019, confirming long-term strength against the broader market. Additionally, monthly momentum recently flipped positive for ARNA, suggesting the potential for further gains. Okay to add long exposure here as demand is in control. Support is offered at $45. |
| BJ BJ's Wholesale Club Holdings Inc ($32.78) - Retailing - BJ's Wholesale broke a double top at $32 today in response to earnings to mark a second consecutive buy signal before advancing past resistance to a new all-time high of $33. This 3 for 5'er moved to a positive trend and market RS buy signal in March and has recently experienced positive flips of both weekly and monthly momentum. The weight of the evidence is positive but today's action has sent BJ into overbought territory. Those considering long exposure may be well served to wait for a pullback, noting that support is offered at $22. |
| CCXI ChemoCentryx Inc. ($59.20) - Biomedics/Genetics - Shares of CCXI reversed up into a column of Xs Thursday and broke a triple top at $60, marking a new all-time high. This 5 for 5'er moved to a positive trend in November of last year and ranks in the top quintile of names in the favored biomedics/genetics sector RS matrix. The technical picture continues to strengthen, however, those looking to add exposure may be best served to wait for a pullback or normalization of the trading band as CCXI is overbought. Initial support is offered at $55 with further support at $50. |
| IBP Installed Building Products, Inc. ($59.19) - Building - Shares of IBP reversed up into a column of Xs on Thursday, breaking a double top at $60 to give a fourth consecutive buy signal. The acceptable 3 for 5’er ranks in the top quartile of the favored building stock sector matrix and demonstrates positive long-term relative strength versus the market, remaining on an RS buy signal since November of 2014. In addition, IBP resides one box away from returning to a positive trend and remains actionable from an overbought/oversold (OBOS) perspective. The weight of the evidence is positive and those looking to initiate new long exposure may consider IBP at current levels or upon additional bullish confirmation with a move to $61, which would also push IBP past current resistance at $60. Initial support can be found at $56. |
| ROST Ross Stores, Inc. ($96.79) - Retailing - ROST broke a double top at $93 before moving higher to $99 on Thursday. This break marks the second consecutive buy signal on the chart for this 4 for 5’er within the favored retailing sector. ROST moved back into a positive trend in late March and has maintained a long-term market RS buy signal since February 2015. From here, initial support sits at $88. |
| UHT Universal Health RLTY Inc T ($89.56) - Real Estate - UHT returned to a buy signal on Thursday with a double top break at $93. This stock is a 3 for 5’er within the favored real estate sector that has maintained a long-term peer RS buy signal since June 2017. Additionally, UHT is trading well above the bullish support line and offers a yield of 3.06%. Demand is in control. New support has been established at the $87 level while overhead resistance sits at $100. |
| ZM Zoom Video Communications, Inc. Class A ($172.46) - Telephone - ZM broke a double top at $176 on Thursday, marking the third consecutive buy signal on the chart. This stock is a perfect 5 for 5’er that ranks in the top decile of the favored telephone sector RS matrix. ZM continues to trade well above its bullish support line that dates to January of this year. Demand is in control and the technical picture is positive. From here, initial support sits at $164 while overhead resistance is at $180. Earnings are expected 6/2. |
| Name | Option Symbol | Action | Stop Loss |
|---|---|---|---|
| PulteGroup, Inc. - $32.69 | PHM2016J30 | Buy the October 30.00 calls at 5.80 | 26.00 |
| Name | Option | Action |
|---|---|---|
| Eli Lilly and Company ( LLY) | Sep. 150.00 Calls | Stopped at 150.00 (CP: 152.01) |
| AbbVie Inc. ( ABBV) | Sep. 80.00 Calls | Raise the option stop loss to 12.30 (CP: 14.30) |
| Name | Option Symbol | Action | Stop Loss |
|---|---|---|---|
| Vornado Realty Trust - $35.75 | VNO2018U40 | Buy the September 40.00 puts at 7.30 | 40.00 |
| Name | Option | Action |
|---|---|---|
|
|
||
| Name | Option Sym. | Call to Sell | Call Price | Investment for 500 Shares | Annual Called Rtn. | Annual Static Rtn. | Downside Protection |
|---|---|---|---|---|---|---|---|
| CSX Corporation $68.36 | CSX2021H70 | Aug. 70.00 | 3.65 | $32,432.25 | 27.26% | 17.95% | 4.33% |
| Name | Action |
|---|---|
| Copart Incorporated (CPRT) - 86.69 | Sell the August 85.00 Calls. |
| Micron Technology, Inc. (MU) - 46.64 | Sell the October 50.00 Calls. |
| Apollo Global Management Inc. (APO) - 44.99 | Sell the September 45.00 Calls. |
| Chevron Corporation (CVX) - 93.00 | Sell the September 95.00 Calls. |
| Newmont Corp (NEM) - 65.72 | Sell the September 70.00 Calls. |
| Activision Blizzard, Inc. (ATVI) - 73.78 | Sell the August 75.00 Calls. |
| Name | Covered Write |
|---|---|
| Rent-A-Center, Inc. ( RCII - 24.89 ) | September 25.00 covered write. |
Daily Equity & Market Analysis
Loading, Please Wait...
