With equity markets experiencing continued turbulence amid the advance of the COVID-19 outbreak, an awareness of potential tools available to investors is more essential than ever. The use of options in your investment practice can offer flexibility in the form of taking directional bets with limited capital exposure, generating income, or hedging existing positions. Although most of you undoubtedly have your hands full with client calls, quarterly adjustments, and tactical posturing, understanding your “options” can provide you with alternative ways to play this rapidly-changing market and potentially earn new business during this trying time.
As a refresher, Options are financial instruments that are derivatives based on the value of underlying securities, such as stocks or ETFs. There are two types of options: calls and puts. Call buyers seek to participate in the upside price movement of an underlying security and have the right to purchase said security if the option moves “in the money.” Call sellers take the opposite side of the trade, generally betting that the price of the underlying security will stay below the strike price of the option at expiration and generating premiums for selling the obligation to deliver the shares should they move “in the money.” Put buyers, on the other hand, benefit when the price of the underlying security moves lower, as they own the right to sell shares at the option’s strike price. Put sellers take the opposite side of the trade and collect premiums for the obligation to be “put to” the shares should the underlying price be hit. Simply put: investors buy options when they want the right to participate in a security’s directional move and may do so for capital appreciation or to hedge a long or short position by taking the opposite directional trade (ie. buy a call to hedge a short position, buy a put to hedge a long position). It is also important to remember that one option contract provides a right or obligation to 100 shares of the underlying security, meaning that when you purchase an option contract or contracts, you must account for the number of shares represented by the number of contracts bought or sold. For example, if you bought 3 Microsoft call options for $1, your total out-of-pocket cost would be 3 x $1 x 100, or $300. Today, we are going to show you a few timely and relevant ways to utilize these instruments in the current market environment.
Using and Interpreting the Implied Momentum Bellcurve
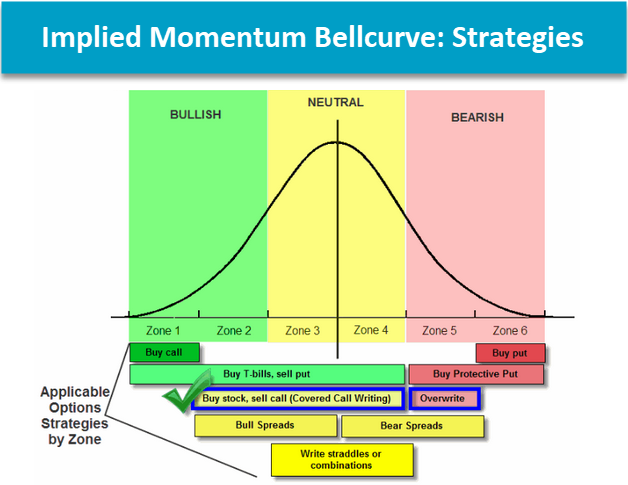
The Implied Momentum tool, which can be found under Asset Allocation > Distribution Curves > Implied Momentum Bellcurve is built around the "Zone Concept," developed and pioneered by the late Jim Yates. Jim Yates developed the "Zone Concept" using a "bell-curve" distribution but applied to the investment world. Jim's zonal tool was so simple that it was basically "Normal Distributions for Dummies". What Jim had created was an elegant way of viewing the market in terms of that bell curve distribution, such that anyone between the ages of 8 and 80 could understand it. He did so by creating an implied volatility calculation for stocks based upon their option premiums. He took an at-the-money option, worked backward through the Black & Scholes model, and ultimately determined the volatility of the underlying stock needed to warrant that option price the market had agreed upon. He simply used the market to provide a volatility measurement to him for all optionable securities. The net result was a way of placing each stock on its own bell curve, based upon where its current price was within the natural volatility range that the market had agreed upon through the options pricing. Jim organized the market into "zones" by simply placing each stock (by symbol) on a big bell curve based upon where they resided on their individual distribution (shown in the image below), ultimately providing a beautiful visual of the market. There were 6 "Zones," equal in size to one another, and we know from statistics 101 class that 66% of our occurrences will appear in the "middle" of that curve for normally distributed data. Whether we are referring to the height of men around the world, or blood pressures across developed countries, 66% of the data points should reside within +/- one "Zone" (or standard deviation) above or below trend (or mean rather). We consider trend to be an intermediate-term moving average for the stock. The Zones then add perspective to how far above or below "normal" a stock, or the market as a whole, have become. If 66% of the time the market is middling then the right strategy for an investor is a relatively neutral strategy 2/3rds of the time. The Covered Write, for instance, is a "right answer" for most stocks in most markets, as shown below, and in extreme conditions like today's market, more extreme postures are validated.
The Implied Momentum Bell Curve for S&P 100 Index constituents (shown below) shows how the 100 OEX stocks, which are typically the most well-known and widely-owned U.S. stocks, are skewed to the oversold side of the curve, as most stocks are located between Zones 1-3, with a particular emphasis on Zone 1. The curve has shifted to left significantly since late February when large-cap domestic equity indices were trading near all-time highs. At that point in time, the curve resembled a more evenly-distributed bell curve with the majority of constituents residing in Zones 3-5.

Buying Calls
Stocks in Zone 1 can be examined for potential long call ideas, especially for those looking for securities that might offer "mean reversion" opportunities following the recent market sell-off. Many of the stocks in Zone 1 are typically short-term laggards and are often the types of stocks that you try not to get married to. In some cases, they may have experienced a short-term pullback and other times they are going through long term corrections. Additionally, Zone 1 stocks are good candidates for short-term trading purposes since you have a pre-determined amount of risk -- the price of the option. When purchasing calls, we use a couple of general guidelines. We want to go out several months, usually about three to six months, to give the option time to work. We also recommend buying in-the-money calls. Finally, we recommend you only buy as many calls as you have an appetite for round lots of the stock (especially if you are using the calls as stock substitutes). If you are normally a 500 share buyer of a $30 stock, only buy 5 calls.
The list below represents is a shortlist of stocks that appear in Zone 1, are on a PnF buy signal, and have a Technical Attribute rating of 3, 4, or 5. Be sure to consult the listed strike and stop-loss points before you purchase, and more importantly, make sure you review the Point & Figure charts for the securities, as they may have changed during this writing. Again, if you go the call route, be sure to buy in-the-money and give yourself some time.
| Symbol |
Name |
Price |
Tech Attrib/Score |
DWA Sector |
Overbought/Oversold |
|
Apple Inc. |
241.41 |
5 
|
Computers |
|
|
The Allstate Corporation |
85.96 |
4 
|
Insurance |
|
|
Bank of America |
20.03 |
3
|
Banks |
|
|
Comcast Corporation |
33.95 |
5
|
Media |
|
|
ConocoPhillips |
32.91 |
3
|
Oil |
|
|
The Walt Disney Company |
93.88 |
3
|
Media |
|
|
Mastercard Inc. |
237.03 |
4
|
Finance |
|
|
The Southern Company |
50.27 |
3
|
Utilities/Electricity |
|
Covered Calls via Overwrites and Covered Writes:
The Implied Momentum Curve can also help you identify potential overwrite candidates. Recall that overwriting is the sale of calls against stock that you already own, turning the position into a covered write. Doing this will give you cash right now in the form of option premium which can act as a hedge in the portfolio. The cash will give you some downside protection in case the stock declines and it will generate above-average returns should the market move sideways. In overwriting, you sell the calls at a later date, after the stock has been previously purchased and ideally has rallied. On the other hand, covered writing, which we frequently discuss in this report, is when you buy the stock and simultaneously sell calls against the position. The benefit of an overwrite versus a protective put is that the overwrite brings cash into the account, providing the "downside protection".
Selling calls against an existing long position is not always the right answer, but when a stock has performed well and reached a point at which partial profit-taking is being considered, overwriting the position can create a more productive outcome. Overwriting is only suggested with stocks that are A.) generally positive on a technical basis, and B.) willing to be sold by the investor, as selling calls obligates the overwriter to so do at the specified strike price. We typically suggest overwriting stocks in Zone 5, however, in today's market, investors can be a bit more flexible. Below is a list of stocks in the OEX that are in Zones 2-5 that are trading on a PnF buy signal and have TA ratings of 3, 4, or 5.
Points to Remember on Overwriting:
- By definition overwriting is selling calls against a position you already own. Covered writing is simultaneously buying the stock and selling the call.
- This strategy can help make the sell decision easier -- the stock is above the strike price on the expiration date, you are obligated to deliver the stock.
- The strategy provides a hedge on the downside by the premium you are taking in from selling the option.
- You must be willing to have the stock called away at the strike price otherwise you are a Closet Naked Writer.
- Overwriting is a good strategy to consider when the stock is overall still bullish but the short term indicators like momentum and trading bands suggest a pullback or consolidation phase.
| Symbol |
Name |
Price |
Tech Attrib/Score |
DWA Sector |
Overbought/Oversold |
|
AbbVie Inc. |
73.37 |
3
|
Drugs |
|
|
Abbott Laboratories |
79.45 |
4
|
Drugs |
|
|
Allergan plc |
175.71 |
5
|
Drugs |
|
|
Amgen Inc. |
205.41 |
4
|
Biomedics/Genetics |
|
|
Amazon.com Inc. |
1906.59 |
5
|
Internet |
|
|
Biogen Inc. |
300.51 |
3
|
Biomedics/Genetics |
|
|
Bristol-Myers Squibb Company |
55.53 |
3
|
Drugs |
|
|
Charter Communications, Inc. |
433.80 |
5
|
Media |
|
|
Costco Wholesale Corporation |
288.65 |
4
|
Retailing |
|
|
Cisco Systems, Inc. |
39.06 |
4
|
Computers |
|
|
Danaher Corporation |
135.15 |
4
|
Machinery and Tools |
|
|
Gilead Sciences, Inc. |
78.21 |
4
|
Biomedics/Genetics |
|
|
Intel Corporation |
54.13 |
4
|
Semiconductors |
|
|
Eli Lilly and Company |
139.66 |
4
|
Drugs |
|
|
Lockheed Martin Corporation |
350.50 |
4
|
Aerospace Airline |
|
|
Mondelez International Inc. |
50.79 |
4
|
Food Beverages/Soap |
|
|
Merck & Co., Inc. |
76.25 |
4
|
Drugs |
|
|
Microsoft Corporation |
153.83 |
5
|
Software |
|
|
NextEra Energy, Inc. |
221.64 |
4
|
Utilities/Electricity |
|
|
NetFlix Inc. |
361.76 |
5
|
Internet |
|
|
Oracle Corporation |
49.40 |
5
|
Software |
|
|
PepsiCo, Inc. |
124.59 |
3
|
Food Beverages/Soap |
|
|
The Procter & Gamble Company |
115.08 |
3
|
Food Beverages/Soap |
|
|
Philip Morris International Inc. |
73.46 |
3
|
Food Beverages/Soap |
|
|
Verizon Communications Inc. |
54.70 |
3
|
Telephone |
|
|
Walmart Inc. |
119.48 |
5
|
Retailing |
|
Using OptionsPlay Integration with Nasdaq Dorsey Wright Platform
Last year, we partnered with OptionsPlay to provide integration with the Nasdaq Dorsey Wright platform that scores potential options strategies by risk and potential reward. The tool, which is accessible by clicking the blue and green OptionsPlay logo next to a chart title, details bullish, bearish, and income-based strategies including covered write and put writes for individual stocks and ETFs. Additionally, subscribers with the add-on also have the ability to screen existing portfolios for OptionsPlay covered call recommendations, as indicated by the colored icon column header or a highlighted OptionsPlay tab on top of the portfolio. In the example below, we used the OptionsPlay integration to screen for income-generating ideas among a portfolio of 30 blue-chip mega-cap stocks. By using a medium timeframe and optimal risk tolerance (both defaults found under Income Settings), the OptionsPlay recommendation for a covered call on Microsoft is to sell the May 1st, 2020 $175 strike for $2.19 per share in premium. Using hypothetical ownership of 300 shares, or 3 contracts, the play generates $657 in premium, which results in a 19.35% annualized return and has a 71.57% chance of expiring worthless. Recall that a covered call will expire worthless when the stock remains “out of the money”, or below the strike price, at expiration. This strategy sweetens the deal for current shareholders already receiving a 1.26% dividend yield for owning the stock. Additionally, OptionsPlay provides recommendations for potential put-write scenarios, as shown below.

The previously-mentioned process can be replicated using an optionable inventory of ETFs, as well. Additionally, OptionsPlay can help provide guidance regarding directional options strategies and multi-leg income-producing trades. For more information regarding OptionsPlay, check out our Educational videos here.
To signup for OptionsPlay, please contact us by phone at 804-212-0333 or by email at dwa@dorseywright.com.