We review the DWA Momentum Plus Index ETF suite, exploring the methodology and technical picture for Momentum Plus Value (DVLU) and its underlying holdings.
Momentum has proven to be a robust standalone factor, as evidenced by the success of pure momentum strategies available across the Nasdaq Dorsey Wright model and index suite. When momentum is paired with additional factors, however, it can yield positive results that diversify return streams in different market environments. In an effort to capture these potential opportunities, NDW developed the Momentum Plus series of indices that are tracked by three First Trust ETFs. The ETFs provide you with ways of accessing three unique factor combinations that have been shown to provide unique exposure and adaptability over different market cycles. The factor combinations that are available are Momentum & Low Volatility , Momentum & Value , and Momentum & Dividend . For years, we've been discussing the power of combining these different factors with momentum and many of you have employed the concept into your practice, Since launching on September 5th, 2018, investors have had the ability to access these factor combinations in single-cusip products. Today, we'll review the process behind each of the Momentum Plus Indexes and then take a look at some individual stock ideas using momentum plus value for idea generation.
DWA Momentum Plus Indexes
The three ETFs available from First Trust are the First Trust Dorsey Wright Momentum & Dividend ETF , the First Trust Dorsey Wright Momentum & Low Volatility ETF , and the First Trust Dorsey Wright Momentum & Value ETF . Each of these funds tracks one of our DWA Momentum Plus Indexes, which combine relative strength with an additional fundamental factor in a single strategy. The goal of each index is to get exposure to a particular fundamental factor while still ensuring each holding has positive relative strength against a broad domestic market representative. We have provided factsheets for each of the underlying indexes, which can be accessed below:
Each of these strategies takes a broad inventory of US large and mid-cap equities and compares them to the market using relative strength (momentum). Once we determine which stocks pass the initial RS screen, we then rank them on one of three fundamental factors to construct the index. The 50 securities with the highest attribution for each respective factor are selected for inclusion in that index. The addition of fundamental factor screens differentiates the Momentum Plus Indexes from other our other indexes and is designed to tilt the index differently than a momentum only strategy.
- Low Volatility: We calculate the standard deviation of daily price changes over the last year. The 50 securities with the lowest volatility scores are selected for the index.
- Dividend: The 50 securities with the highest current dividend yields are selected or the index.
- Value: We create a composite value score using price-to-earnings, price-to-sales, price-to-book, and price-to-cash flow. In order to be eligible, a security must have data for at least three of the four ratios or it is not eligible. The 50 securities with the best value scores are selected for the index.

Momentum Plus Value
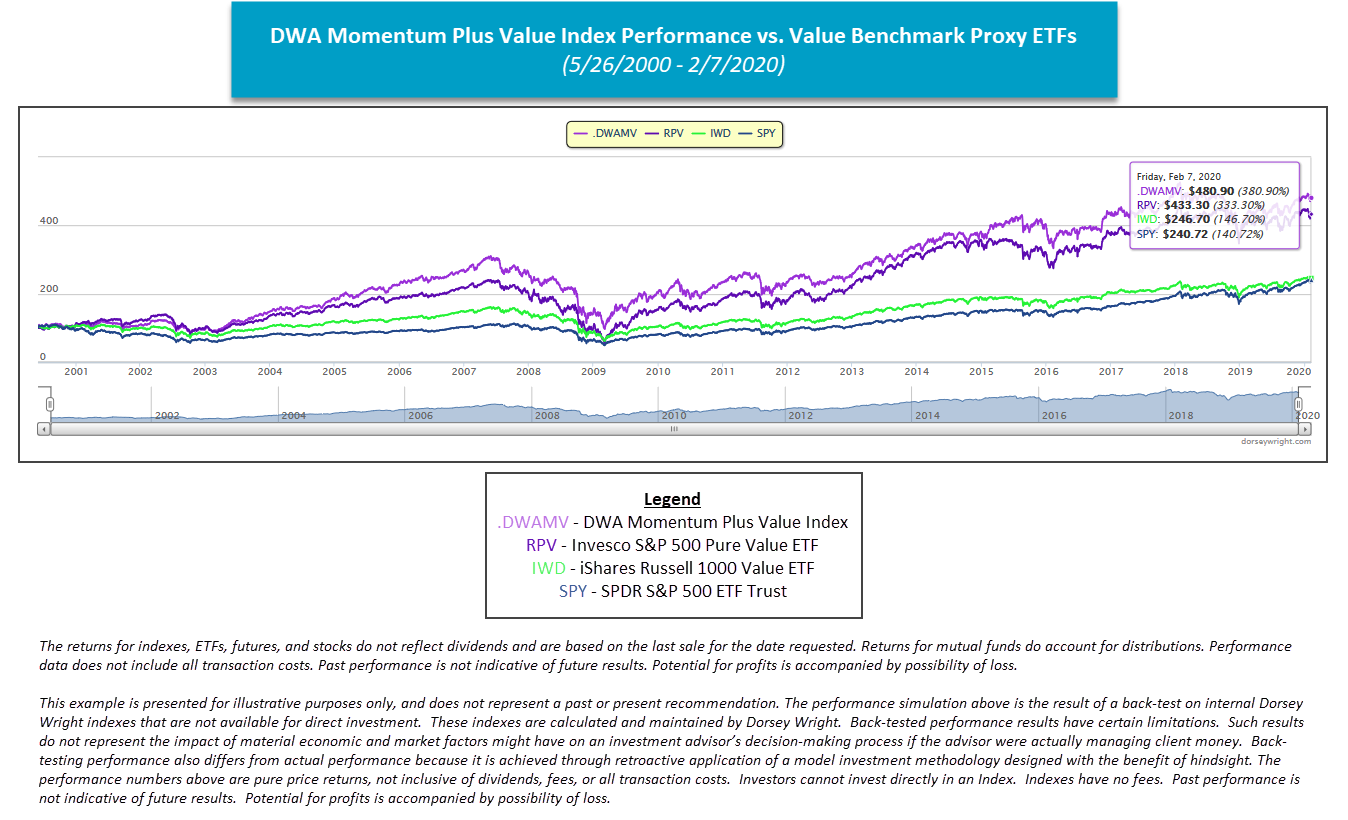
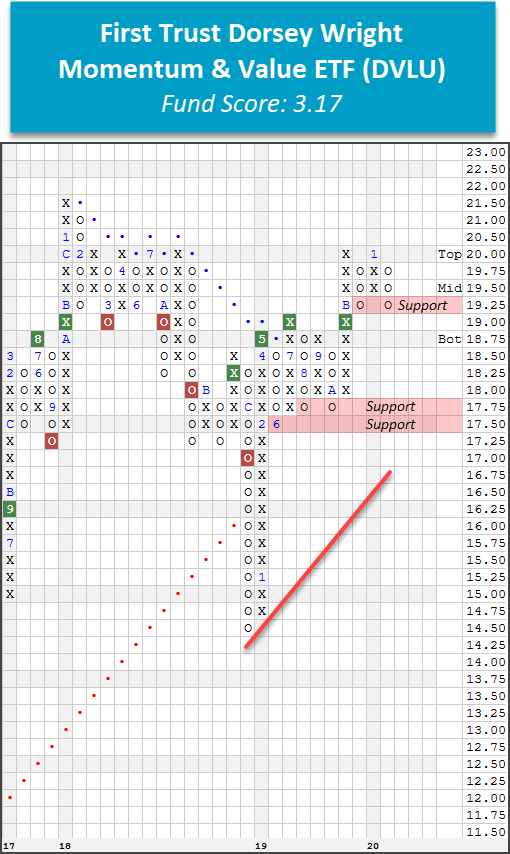
Today's featured Momentum Plus strategy is the First Trust Dorsey Wright Momentum & Value ETF . Recall that the fund screens 900+ large and mid-cap US equities for high RS names. From this list, each strong momentum name is ranked by the value factor, specifically assessing four metrics including price-to-sales, price-to-book, price-to-earnings, and price-to cash flow ratios for each potential candidate. Finally, the 50 names with the highest value scores are selected for inclusion in the fund’s underlying index and are factor-weighted, meaning the securities with the highest value scores are weighted the highest. After a bumpy start amid the volatility of late 2018, DVLU went on to outperform the both the Invesco S&P 500 Pure Value ETF and the iShares Russell 1000 Value ETF by significant margins in 2019, returning 31.21% on the year versus to 21.83% and 22.90% for RPV and IWD, respectively. DVLU's stellar year even outpaced the S&P 500 Index , which returned 28.88%. DVLU continues to outpace its value ETF counterparts on a year-to-date basis, returning 1.53% as of 2/7/2020 relative to RPV's negative return of -2.99% and IWD's modest gain of 0.32%. The fund currently sports an acceptable fund score of 3.17 with a positive score direction of 0.86. DVLU currently trades on a third consecutive buy signal and has recently pulled back from a 52-week high at $20. Exposure may be added here, noting that DVLU is testing support at $19.25 on the default chart.

DVLU currently maintains a strong overweight position toward financials, which comprise nearly 41% of the fund's underlying holdings. Industrials and information technology also make up a significant portion of the portfolio, weighing in at 17.63% and 14.07%, respectively. Although DVLU provides a strong comprehensive and individual option for investors, you can also use the NDW platform to drill down to a focused list of names from the fund’s underlying holdings. By clicking “All Holdings” on the top of DVLU’s chart and then selecting “Send To”, we’re able to create a new portfolio of the 50 names included in the ETF. We then can use the Security Screener to narrow down the names to a list of technically-favorable holdings that are 5 for 5’ers, point & figure buy signals, trading in a positive trend, and have reward-to-risk ratios greater than or equal to 2. A table of the16 names that meet these criteria is below.
Momentum Plus Value: Shopping List of Ideas
Featured Long Ideas
Fidelity National Financial, Inc. (FNF)
Fidelity National is a strong 5 for 5'er that trades well above its long-term bullish support line. The stock has also been on a market RS buy signal since October of 2017 and ranks 15th of 71 names included in the insurance sector RS matrix. FNF reversed lower on Friday (2/7), pulling back from a freshly-minted all-time high at $49 to offer a more attractive entry point for long exposure. Despite the pullback, FNF remains on a second consecutive buy signal and is actionable here as the stock is now in oversold territory. From here, support is offered at $45. FNF carries a yield of 2.9%.

OneMain Holdings Inc. (OMF)
OMF is a strong-attribute name that has traded in a positive trend since February of 2019. This 5 for 5'er has also been on a market RS buy signal since October of 2017, confirming long-term strength against the broader market, and ranks 22nd of 82 names included in the favored finance sector RS matrix. Additionally, both weekly and monthly momentum have recently flipped positive, suggesting the potential for further gain. OMF currently trades on a buy signal and tests resistance at $44. A further advance to $45 would result in a triple top break, marking a second consecutive buy signal and a new multi-year high for the stock. Demand is in control and long exposure may be added here, noting that initial support is offered at $41. OMF further compensates shareholders with a yield of 2.28%.

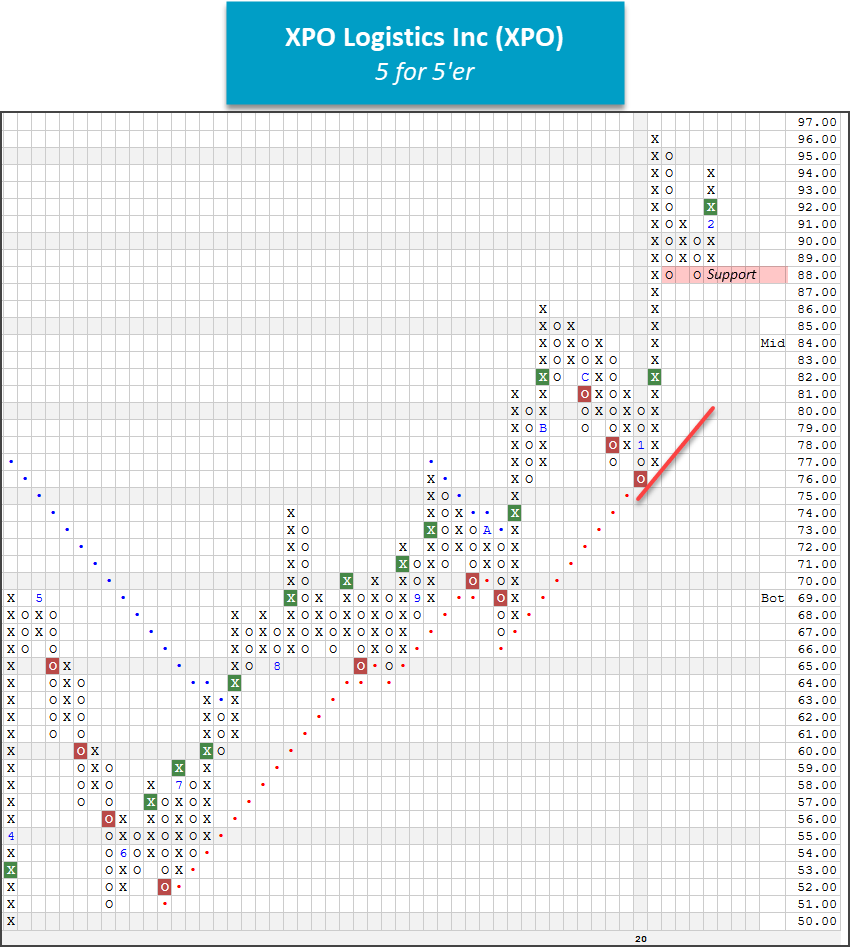
XPO Logistics Inc (XPO)
XPO Logistics shares recently broke a double top at $92, marking a second consecutive buy signal. This strong 5 for 5'er returned to a positive trend in October of 2019 and also moved o a market RS buy signal in August of 2019. Additionally, XPO ranks fifth of 50 names included in the transports/non-air sector matrix. Demand is in control and long exposure may be added here. Initial support is offered at $88, while overhead resistance is found at the 52-week high of $96.