
Most Requested Symbols

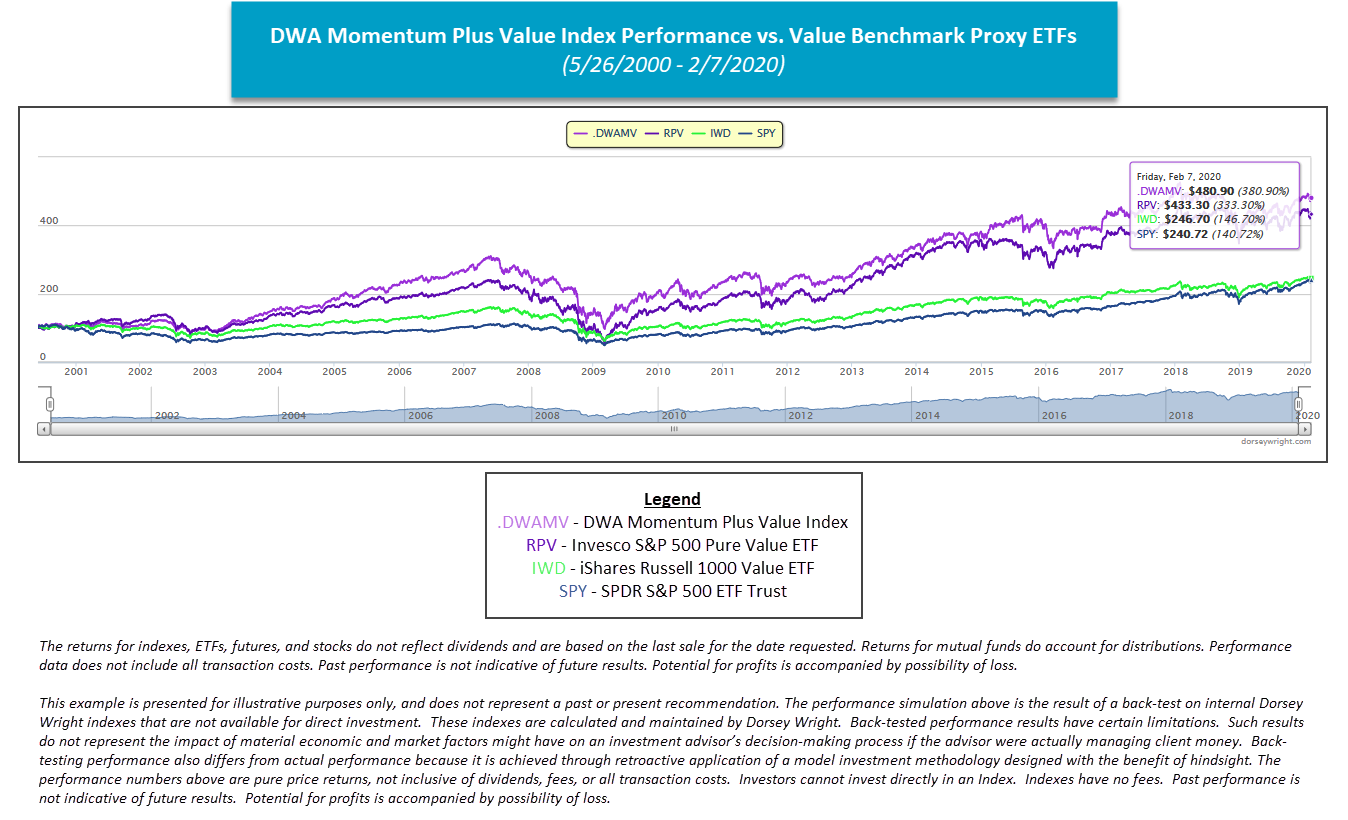
We review the DWA Momentum Plus Index ETF suite, exploring the methodology and technical picture for Momentum Plus Value (DVLU) and its underlying holdings.
Today's featured stock is Citigroup, Inc. (C)
AHS, EHC, GNRC, HLNE, BLD, CUE, FRPT, APLS, BMI, & PFGC
Call: Citigroup (C), Put: Eastman Chemical Company (EMN), Covered Write: Pan American Silver Corp (PAAS)

Surprise! Stick with the technicals. Earnings season for Q4 2019 results is well underway, with 64% of the companies in the S&P 500 Index SPX having reported as of Friday, February 7th. So far, 71% of the companies included in the large cap domestic equity index that have reported posted surprise earnings per share (EPS) beats, while 67% of the companies reporting have posted positive revenue surprise beats. Currently, the blended earnings growth rate for the S&P 500 is 0.7%, which, if sustained, will mark the first time the index has reported year-over-year growth in earnings since Q4 of 2018. Additionally, the S&P 500’s forward 12-month price/earnings (P/E) ratio is 18.8, well above the 5-year average reading of 16.7 and the 10-year average figure of 15.0 (source: FactSet Earnings Insight).

With the positive backdrop and abundance of exceeded expectations, do earnings surprises suggest an immediate technical turnaround? Not necessarily. When assessing the top ten EPS surprises, we find that the blended portfolio has an average technical attribute rating of 2.10. While 60% of the names are on a Point & Figure buy signal, only 40% trade in a positive trend. This is not much better than a blended portfolio of the 10 worst EPS misses, which displays an average tech attribute rating of 1.70 with 50% of the stocks included trading on PnF buy signals. Additionally, 50% of the names included in the "Miss" portfolio trade in a positive trend, exceeding the current average figure for the "Beat" portfolio. Earnings season is undoubtedly an important time of year for investors as it sets the tone for future sentiment and expectations. However, until the weight of the technical evidence turns positive, a surprise earnings beat may be less of a catalyst for new potential long investment and more of a reiteration of what has already been priced in.


Momentum has proven to be a robust standalone factor, as evidenced by the success of pure momentum strategies available across the Nasdaq Dorsey Wright model and index suite. When momentum is paired with additional factors, however, it can yield positive results that diversify return streams in different market environments. In an effort to capture these potential opportunities, NDW developed the Momentum Plus series of indices that are tracked by three First Trust ETFs. The ETFs provide you with ways of accessing three unique factor combinations that have been shown to provide unique exposure and adaptability over different market cycles. The factor combinations that are available are Momentum & Low Volatility DVOL, Momentum & Value DVLU, and Momentum & Dividend DDIV. For years, we've been discussing the power of combining these different factors with momentum and many of you have employed the concept into your practice, Since launching on September 5th, 2018, investors have had the ability to access these factor combinations in single-cusip products. Today, we'll review the process behind each of the Momentum Plus Indexes and then take a look at some individual stock ideas using momentum plus value for idea generation.
The three ETFs available from First Trust are the First Trust Dorsey Wright Momentum & Dividend ETF DDIV, the First Trust Dorsey Wright Momentum & Low Volatility ETF DVOL, and the First Trust Dorsey Wright Momentum & Value ETF DVLU. Each of these funds tracks one of our DWA Momentum Plus Indexes, which combine relative strength with an additional fundamental factor in a single strategy. The goal of each index is to get exposure to a particular fundamental factor while still ensuring each holding has positive relative strength against a broad domestic market representative. We have provided factsheets for each of the underlying indexes, which can be accessed below:
Each of these strategies takes a broad inventory of US large and mid-cap equities and compares them to the market using relative strength (momentum). Once we determine which stocks pass the initial RS screen, we then rank them on one of three fundamental factors to construct the index. The 50 securities with the highest attribution for each respective factor are selected for inclusion in that index. The addition of fundamental factor screens differentiates the Momentum Plus Indexes from other our other indexes and is designed to tilt the index differently than a momentum only strategy.

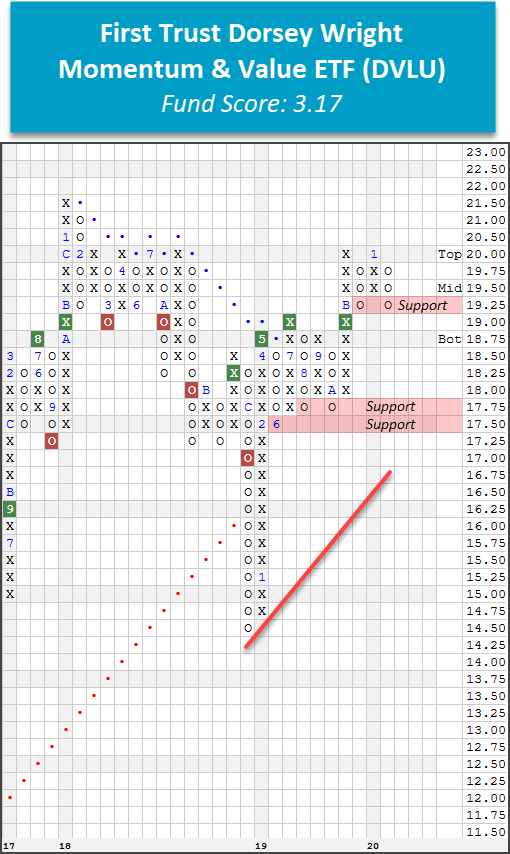
Today's featured Momentum Plus strategy is the First Trust Dorsey Wright Momentum & Value ETF DVLU. Recall that the fund screens 900+ large and mid-cap US equities for high RS names. From this list, each strong momentum name is ranked by the value factor, specifically assessing four metrics including price-to-sales, price-to-book, price-to-earnings, and price-to cash flow ratios for each potential candidate. Finally, the 50 names with the highest value scores are selected for inclusion in the fund’s underlying index and are factor-weighted, meaning the securities with the highest value scores are weighted the highest. After a bumpy start amid the volatility of late 2018, DVLU went on to outperform the both the Invesco S&P 500 Pure Value ETF RPV and the iShares Russell 1000 Value ETF IWD by significant margins in 2019, returning 31.21% on the year versus to 21.83% and 22.90% for RPV and IWD, respectively. DVLU's stellar year even outpaced the S&P 500 Index SPX, which returned 28.88%. DVLU continues to outpace its value ETF counterparts on a year-to-date basis, returning 1.53% as of 2/7/2020 relative to RPV's negative return of -2.99% and IWD's modest gain of 0.32%. The fund currently sports an acceptable fund score of 3.17 with a positive score direction of 0.86. DVLU currently trades on a third consecutive buy signal and has recently pulled back from a 52-week high at $20. Exposure may be added here, noting that DVLU is testing support at $19.25 on the default chart.

DVLU currently maintains a strong overweight position toward financials, which comprise nearly 41% of the fund's underlying holdings. Industrials and information technology also make up a significant portion of the portfolio, weighing in at 17.63% and 14.07%, respectively. Although DVLU provides a strong comprehensive and individual option for investors, you can also use the NDW platform to drill down to a focused list of names from the fund’s underlying holdings. By clicking “All Holdings” on the top of DVLU’s chart and then selecting “Send To”, we’re able to create a new portfolio of the 50 names included in the ETF. We then can use the Security Screener to narrow down the names to a list of technically-favorable holdings that are 5 for 5’ers, point & figure buy signals, trading in a positive trend, and have reward-to-risk ratios greater than or equal to 2. A table of the16 names that meet these criteria is below.
|
Symbol |
Name | Price | Tech Attrib/Score | DWA Sector | Overbought/Oversold | ||
|---|---|---|---|---|---|---|---|
| AGO | Assured Guaranty Ltd. | 46.86 |
5 |
Insurance |
|
||
| AMP | Ameriprise Financial | 175.32 |
5 |
Finance |
|
||
| BPOP | Popular, Inc. | 56.11 |
5 |
Banks |
|
||
| CACI | CACI International Inc. | 272.00 |
5 |
Computers |
|
||
| DHI | D.R. Horton, Inc. | 60.70 |
5 |
Building |
|
||
| ESNT | Essent Group Ltd | 51.89 |
5 |
Insurance |
|
||
| FAF | First American Financial Corporation | 60.92 |
5 |
Insurance |
|
||
| FNF | Fidelity National Financial, Inc. | 45.98 |
5 |
Insurance |
|
||
| GPK | Graphic Packaging Intl. | 15.86 |
5 |
Forest Prods/Paper |
|
||
| J | Jacobs Engineering Group Inc. | 95.78 |
5 |
Building |
|
||
| KBR | KBR, Inc. | 29.18 |
5 |
Building |
|
||
| MTG | MGIC Investment Corporation | 14.25 |
5 |
Insurance |
|
||
| NXST | Nexstar Media Group Inc. | 122.21 |
5 |
Media |
|
||
| OMF | OneMain Holdings Inc. | 43.74 |
5 |
Finance |
|
||
| WDC | Western Digital Corporation | 67.03 |
5 |
Computers |
|
||
| XPO | XPO Logistics Inc | 93.21 |
5 |
Transports/Non Air |
|
Fidelity National is a strong 5 for 5'er that trades well above its long-term bullish support line. The stock has also been on a market RS buy signal since October of 2017 and ranks 15th of 71 names included in the insurance sector RS matrix. FNF reversed lower on Friday (2/7), pulling back from a freshly-minted all-time high at $49 to offer a more attractive entry point for long exposure. Despite the pullback, FNF remains on a second consecutive buy signal and is actionable here as the stock is now in oversold territory. From here, support is offered at $45. FNF carries a yield of 2.9%.

OMF is a strong-attribute name that has traded in a positive trend since February of 2019. This 5 for 5'er has also been on a market RS buy signal since October of 2017, confirming long-term strength against the broader market, and ranks 22nd of 82 names included in the favored finance sector RS matrix. Additionally, both weekly and monthly momentum have recently flipped positive, suggesting the potential for further gain. OMF currently trades on a buy signal and tests resistance at $44. A further advance to $45 would result in a triple top break, marking a second consecutive buy signal and a new multi-year high for the stock. Demand is in control and long exposure may be added here, noting that initial support is offered at $41. OMF further compensates shareholders with a yield of 2.28%.

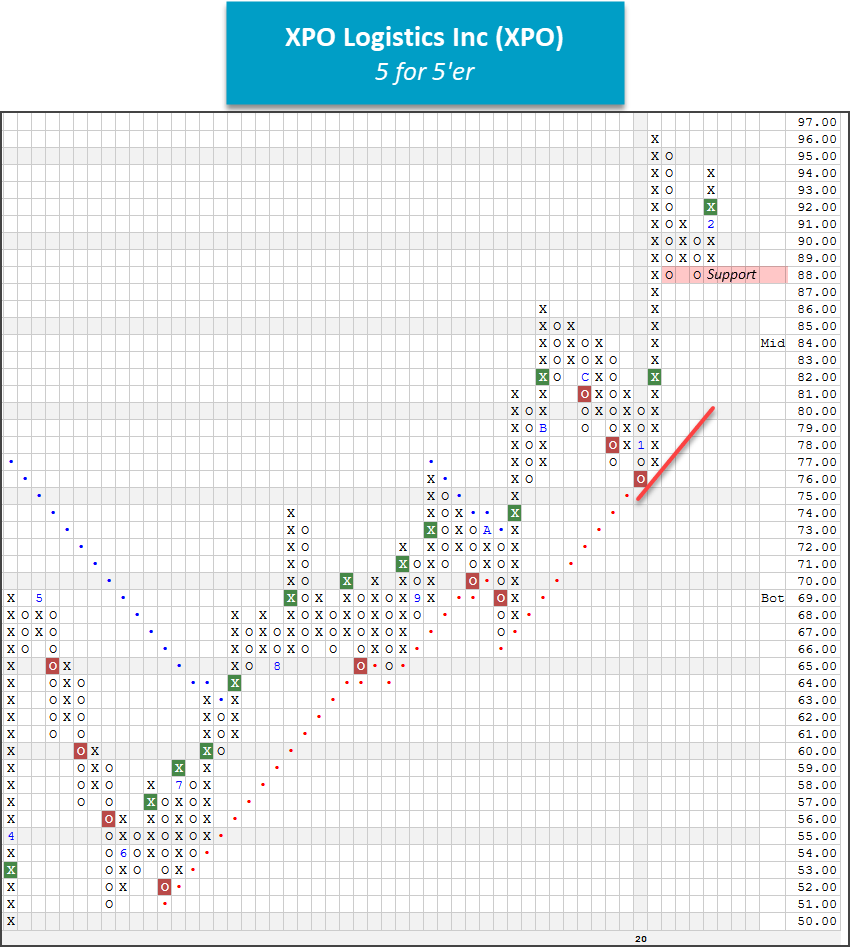
XPO Logistics shares recently broke a double top at $92, marking a second consecutive buy signal. This strong 5 for 5'er returned to a positive trend in October of 2019 and also moved o a market RS buy signal in August of 2019. Additionally, XPO ranks fifth of 50 names included in the transports/non-air sector matrix. Demand is in control and long exposure may be added here. Initial support is offered at $88, while overhead resistance is found at the 52-week high of $96.
Average Level
20.71
| AGG | iShares US Core Bond ETF |
| USO | United States Oil Fund |
| DIA | SPDR Dow Jones Industrial Average ETF |
| DVY | iShares Dow Jones Select Dividend Index ETF |
| DX/Y | NYCE U.S.Dollar Index Spot |
| EFA | iShares MSCI EAFE ETF |
| FXE | Invesco CurrencyShares Euro Trust |
| GLD | SPDR Gold Trust |
| GSG | iShares S&P GSCI Commodity-Indexed Trust |
| HYG | iShares iBoxx $ High Yield Corporate Bond ETF |
| ICF | iShares Cohen & Steers Realty ETF |
| IEF | iShares Barclays 7-10 Yr. Tres. Bond ETF |
| LQD | iShares iBoxx $ Investment Grade Corp. Bond ETF |
| IJH | iShares S&P 400 MidCap Index Fund |
| ONEQ | Fidelity Nasdaq Composite Index Track |
| QQQ | Invesco QQQ Trust |
| RSP | Invesco S&P 500 Equal Weight ETF |
| IWM | iShares Russell 2000 Index ETF |
| SHY | iShares Barclays 1-3 Year Tres. Bond ETF |
| IJR | iShares S&P 600 SmallCap Index Fund |
| SPY | SPDR S&P 500 Index ETF Trust |
| TLT | iShares Barclays 20+ Year Treasury Bond ETF |
| GCC | WisdomTree Continuous Commodity Index Fund |
| VOOG | Vanguard S&P 500 Growth ETF |
| VOOV | Vanguard S&P 500 Value ETF |
| EEM | iShares MSCI Emerging Markets ETF |
| XLG | Invesco S&P 500 Top 50 ETF |

| Symbol | Company | Sector | Current Price | Action Price | Target | Stop | Notes |
|---|---|---|---|---|---|---|---|
| FSS | Federal Signal Corporation | Autos and Parts | $32.42 | low-to-mid 30s | 49.50 | 28 | 5 for 5'er, top third of AUTO sector matrix, mutli consec buys, LT pos trend, pot covered write, R-R>2.0, |
| IBP | Installed Building Products, Inc. | Building | $75.77 | mid-to-high 70s | 105 | 65 | 4 for 5'er, top 20% of favored BUIL sector matrix, spread triple top, pullback from ATH, pos wkly mom flip, R-R>2.0 |
| STNE | StoneCo Ltd. Class A | Business Products | $40.78 | mid to upper 40s | $53 | $33 | 5 for 5'er, top 10% of fav DWABUSI, bullish catapult, consec buy signals |
| RJF | Raymond James Financial Inc | Wall Street | $94.05 | low to upper 90s | $99 | $74 | 4 for 5'er, long-term market/peer RS, consec buy signals, pullback from 52 week high, 1.62% yield |
| AMP | Ameriprise Financial | Finance | $175.32 | mid 160s to mid/upper 170s | $202 | $132 | 5 for 5'er, top 25% of DWAFINA, consec buy signals, pullback from 52 week high, 2.32% yield |
| BAH | Booz Allen Hamilton Holding | Business Products | $77.43 | mid 70s to low 80s | 109 | 66 | 5 for 5'er, top third of favored BUSI sector matrix, quad top, pullback from ATH, R-R>2.0 1.6% yield |
| NSA | National Storage Affiliates | Real Estate | $35.78 | 33 - 36 | 54 | 31 | 5 for 5'er, top 33% of favored REAL sector matrix, LT pos trend, 3.8% yield triple top, Earnings 2/24 |
| AMGN | Amgen Inc. | Biomedics/Genetics | $229.33 | $220s - $250s | $276 | $184 | 4 for 5'er, LT market RS buy, consec buy signals, pullback from AT high, 2.77% yield |
| MTSI | MACOM Technology Solutions Holdings Inc. | Semiconductors | $28.69 | 27 - 30 | 32.5 | 23 | 5 for 5'er, #2 of 61 names in favored SEMI sector matrix, multi consec buys, pos wkly mom flip, pot. cov. write |
| C | Citigroup, Inc. | Banks | $78.69 | mid-$70s to mid-$80s | $99 | $63 | 4 for 5'er, top 10% of DWABANK, consec buy signals, pullback from multiyear high, 2.6% yield |
| Symbol | Company | Sector | Current Price | Action Price | Target | Stop | Notes |
|---|---|---|---|---|---|---|---|
| SUPN | Supernus Pharmaceuticals Inc | Biomedics/Genetics | $23.93 | low-to-mid 20s | 19.50 | 30 | 0 for 5'er, bottom 20% of BIOM sector matrix, multi consec sell signals, LT neg. trend, rally from multi-year low Earnings 2/24 |
| Symbol | Company | Sector | Current Price | Action Price | Target | Stop | Notes |
|---|---|---|---|---|---|---|---|
| TJX | The TJX Companies, Inc. | Retailing | $61.38 | upper 50s - low to mid-60s | $72 | $49 | See follow comment below. |
| Comment |
|---|
| FIS Fidelity National Information Services, R ($150.18) - Finance - Raise stop to $124, which would violate two levels of support on the default chart. |
| GNRC Generac Holdings, Inc. R ($108.92) - Building - Raise stop to $91, which would violate three levels of support on the default chart. |
| TJX The TJX Companies, Inc. R ($61.28) - Retailing - Okay to add new exposure at current levels. We will continue to abide by our $49 stop. Note earnings are expected 2/26. |
C Citigroup, Inc. R ($78.41) - Banks - C is a solid 4 for 5’er that ranks within the top decile of the banks sector RS matrix. This stock continues to trade well above the bullish support line that was established in April 2019. C has given two consecutive buy signals and most recently printed a new a multi-year high at $83. After marking a new high, shares of C pulled back to $74 before reversing back up into Xs to $79 where the stock sits today. Okay to initiate new exposure in the mid $70s to mid $80s range. We will set our initial stop loss at $63, the bullish support line. We will use the stock’s bullish price objective of $99 as our near-term price target. Note this stock offers a yield of 2.60%.
| 18 | 19 | 20 | |||||||||||||||||||||||||||||||||||||||||||||||||||
| 83.00 | X | 83.00 | |||||||||||||||||||||||||||||||||||||||||||||||||||
| 82.00 | X | O | 82.00 | ||||||||||||||||||||||||||||||||||||||||||||||||||
| 81.00 | 1 | O | 81.00 | ||||||||||||||||||||||||||||||||||||||||||||||||||
| 80.00 | X | X | O | 80.00 | |||||||||||||||||||||||||||||||||||||||||||||||||
| 79.00 | X | O | • | X | O | X | 79.00 | ||||||||||||||||||||||||||||||||||||||||||||||
| 78.00 | X | O | X | • | X | O | X | Mid | 78.00 | ||||||||||||||||||||||||||||||||||||||||||||
| 77.00 | C | 1 | 2 | X | O | • | X | O | 2 | 77.00 | |||||||||||||||||||||||||||||||||||||||||||
| 76.00 | X | X | O | X | O | X | X | O | X | • | • | X | X | O | X | 76.00 | |||||||||||||||||||||||||||||||||||||
| 75.00 | X | O | X | O | X | O | X | O | X | 3 | X | O | • | X | • | B | O | X | O | X | 75.00 | ||||||||||||||||||||||||||||||||
| 74.00 | X | O | X | X | O | O | X | O | X | O | X | O | • | • | X | O | • | X | O | X | O | 74.00 | |||||||||||||||||||||||||||||||
| 73.00 | A | O | X | O | X | O | X | O | X | O | X | O | X | X | • | 8 | X | O | • | X | X | C | 73.00 | ||||||||||||||||||||||||||||||
| 72.00 | X | O | X | O | X | O | O | X | O | O | X | O | X | O | • | X | O | X | X | O | • | X | O | X | 72.00 | ||||||||||||||||||||||||||||
| 71.00 | X | O | B | O | O | X | O | X | O | • | X | O | X | O | X | A | • | X | 7 | O | X | 71.00 | |||||||||||||||||||||||||||||||
| 70.00 | X | O | X | O | X | O | X | O | X | O | X | O | • | X | O | X | 8 | X | X | Bot | 70.00 | ||||||||||||||||||||||||||||||||
| 69.00 | 8 | 9 | X | O | X | O | X | O | 6 | 7 | O | 9 | • | O | X | • | X | O | X | O | X | O | X | 69.00 | |||||||||||||||||||||||||||||
| 68.00 | 7 | O | X | O | X | O | X | 5 | X | O | X | O | X | • | O | X | O | • | X | 5 | X | O | X | O | X | 68.00 | |||||||||||||||||||||||||||
| 67.00 | X | O | X | O | X | 4 | O | O | X | O | X | • | O | B | O | • | X | O | X | O | X | A | X | 67.00 | |||||||||||||||||||||||||||||
| 66.00 | X | O | O | O | • | O | X | • | O | X | O | C | X | X | O | X | O | X | O | X | 66.00 | ||||||||||||||||||||||||||||||||
| 65.00 | X | • | • | O | • | O | X | O | X | O | 2 | X | O | X | O | 6 | O | 9 | O | 65.00 | |||||||||||||||||||||||||||||||||
| 64.00 | X | • | • | O | O | X | O | X | O | X | O | 4 | O | X | O | X | 64.00 | ||||||||||||||||||||||||||||||||||||
| 63.00 | 6 | • | O | X | O | X | O | X | O | X | O | X | O | X | • | 63.00 | |||||||||||||||||||||||||||||||||||||
| 62.00 | X | • | O | O | X | 3 | X | O | X | O | O | X | • | 62.00 | |||||||||||||||||||||||||||||||||||||||
| 61.00 | 4 | 5 | • | O | X | O | O | O | • | 61.00 | |||||||||||||||||||||||||||||||||||||||||||
| 60.00 | X | O | X | • | O | X | • | 60.00 | |||||||||||||||||||||||||||||||||||||||||||||
| 59.00 | X | O | X | • | O | X | • | 59.00 | |||||||||||||||||||||||||||||||||||||||||||||
| 58.00 | X | O | • | O | X | • | 58.00 | ||||||||||||||||||||||||||||||||||||||||||||||
| 57.00 | • | O | X | • | 57.00 | ||||||||||||||||||||||||||||||||||||||||||||||||
| 56.00 | • | O | X | • | 56.00 | ||||||||||||||||||||||||||||||||||||||||||||||||
| 55.00 | • | O | X | • | 55.00 | ||||||||||||||||||||||||||||||||||||||||||||||||
| 54.00 | • | O | X | • | 54.00 | ||||||||||||||||||||||||||||||||||||||||||||||||
| 53.00 | • | O | 1 | • | 53.00 | ||||||||||||||||||||||||||||||||||||||||||||||||
| 52.00 | • | O | X | • | 52.00 | ||||||||||||||||||||||||||||||||||||||||||||||||
| 51.00 | • | O | X | • | 51.00 | ||||||||||||||||||||||||||||||||||||||||||||||||
| 50.00 | • | O | X | • | 50.00 | ||||||||||||||||||||||||||||||||||||||||||||||||
| 49.00 | • | O | • | 49.00 | |||||||||||||||||||||||||||||||||||||||||||||||||
| 18 | 19 | 20 |
| APLS Apellis Pharmaceuticals, Inc. ($44.62) - Biomedics/Genetics - APLS broke a double top at $45 on Monday and is now trading at new 52 week highs. This stock is a perfect 5 for 5’er that ranks 8th out of 111 stocks in the favored biomedics/genetics sector. Additionally, monthly momentum just flipped positive, suggesting the potential for higher prices. From here, initial support is offered at $40. |
| ASH Ashland Inc. ($80.58) - Chemicals - Shares of ASH moved higher Monday to break a spread triple top at $80. This 4 for 5'er moved to a positive trend last month and has been on an RS buy signal against the market since mid-2009. Weekly and monthly momentum also recently flipped positive, suggesting the potential for further upside from here. Those looking to add exposure may consider ASH at current levels. Initial support can be found at $74, which is also the current location of the bullish support line. Further support is offered at $71. |
| BLD Topbuild Corp. ($118.81) - Building - BLD reversed up into a column of Xs Monday and broke a double top at $120, which also marked a new all-time high. This 5 for 5'er moved to a positive trend in March of last year and ranks 9th out of 74 names in the favored building sector RS matrix. The stock has also been on an RS buy signal against the market since early-2017. Exposure may be considered at current levels, or on a pullback/normalization of the trading band as BLD is nearing overbought territory. Initial support can be found at $112 with further support at $100. Earnings are expected on 2/25. |
| BMI Badger Meter Inc. ($67.29) - Electronics - BMI broke a double top at $67 on Monday and is now trading at new multi-year highs. This marks the third consecutive buy signal for the electronics stock, confirming that demand is in control. From here, initial support is offered at $59. |
| CUE Cue Biopharma, Inc. ($18.69) - Biomedics/Genetics - Shares of CUE advanced Monday to break a spread triple top at $17.50 before rising to a new all-time high at $18.50 intraday. This 5 for 5'er moved to a positive trend and gave an RS buy signal against the market in November of last year. The weight of the evidence is positive here and continues to improve. Exposure may be considered at current levels, with initial support at $15. Further support can be found at $14.50, $13.50, and $13, which is the current location of the bullish support line. |
| EHC Encompass Health Corp. ($81.33) - Healthcare - EHC rose Monday to complete a bullish triangle pattern with a double top break at $81, marking a new 52-week high. This 3 for 5'er moved to a positive trend in September of last year and ranks in the top half of the favored healthcare sector RS matrix. Weekly and monthly momentum are each positive, suggesting the potential for higher prices. However, those looking to add exposure would be best served to wait for a pullback or normalization of the trading band as EHC is in overbought territory. Initial support can be found at $76 with the bullish support line currently found at $69. |
| FRPT Freshpet Inc ($68.12) - Food Beverages/Soap - FRPT moved higher Monday to break a double top at $68, marking its fifth consecutive buy signal and a new all-time high. This 5 for 5'er moved to a positive trend in August of last year and ranks 2nd out of 68 names in the food beverages/soap sector RS matrix. The stock has also maintained an RS buy signal against the market since mid-2016. Exposure may be considered at current levels, with initial support found at $63. Multiple additional support levels exist from $57 to the bullish support line, which currently sits at $50. Earnings are expected on 3/4. |
| GNRC Generac Holdings, Inc. ($108.92) - Building - GNRC reversed up into a column of Xs Monday and broke a double top at $112, marking its sixth consecutive buy signal following its inclusion in the S&P MidCap 400 that led to this new all-time high. This 5 for 5'er moved to a positive trend in April of 2019 and ranks third out of 74 names in the favored building sector RS matrix. The stock has also been on an RS buy signal against the market since late-2017. Those looking to add exposure may consider GNRC at current levels, or upon a pullback as the stock may be entering overbought territory. Initial support can be found at $102 with further support at $96, $92, and $90. Earnings are expected on 2/13. |
| HLNE Hamilton Lane Inc ($71.03) - Finance - HLNE moved higher Monday to break a double top at $70 before reaching a new all-time high intraday at $71. This 5 for 5'er has maintained a positive trend since mid-2017 and ranks in the top third of the favored finance sector RS matrix. The weight of the evidence is positive here, however, those seeking to add long exposure may be best served to wait for a pullback or normalization of the trading band as HLNE is overbought. Initial support can be found at $63 with further support at $59. |
| PFGC Performance Food Group Co Formerly ($53.98) - Food Beverages/Soap - PFCG broke a double top at $54, marking a new all-time high and the fourth consecutive buy signal on the chart. This stock is a strong 5 for 5’er that ranks 3rd out of 68 names in the food beverages/soap sector matrix. In addition, PFCG just experienced a flip to positive monthly momentum, suggesting the potential for higher prices. From here, initial support is offered at $49. |

| Name | Option Symbol | Action | Stop Loss |
|---|---|---|---|
| Citigroup, Inc. - $78.49 | C2019F75 | Buy the June 75.00 calls at 6.40 | 72.00 |
| Name | Option | Action |
|---|---|---|
| CBRE Group, Inc. ( CBRE) | Mar. 55.00 Calls | Raise the option stop loss to 7.20 (CP: 9.20) |
| Arthur J. Gallagher & Co. ( AJG) | Apr. 90.00 Calls | Raise the option stop loss to 14.30 (CP: 16.30) |
| Arthur J. Gallagher & Co. ( AJG) | Apr. 90.00 Calls | Raise the option stop loss to 14.10 (CP: 16.30) |
| Guidewire Software Inc ( GWRE) | Apr. 105.00 Calls | Raise the option stop loss to 14.70 (CP: 16.70) |
| CSX Corporation ( CSX) | May. 72.50 Calls | Initiate an option stop loss of 5.60 (CP: 7.60) |
| Axon Enterprise Inc. ( AAXN) | Jun. 80.00 Calls | Initiate an option stop loss of 10.60 (CP: 12.60) |
| Name | Option Symbol | Action | Stop Loss |
|---|---|---|---|
| Eastman Chemical Company - $73.13 | EMN2019R80 | Buy the June 80.00 puts at 9.50 | 76.00 |
| Name | Option | Action |
|---|---|---|
| Cantel Medical Corp. (CMD) | Jun. 70.00 Puts | Raise the option stop loss to 8.00 (CP: 10.00) |
| Rite Aid Corporation (RAD) | Apr. 13.00 Puts | Stopped at 14.00 (CP: 13.76) |
| Name | Option Sym. | Call to Sell | Call Price | Investment for 500 Shares | Annual Called Rtn. | Annual Static Rtn. | Downside Protection |
|---|---|---|---|---|---|---|---|
| Pan American Silver Corp $22.29 | PAAS2017G23 | Jul. 23.00 | 2.15 | $10,353.80 | 23.05% | 21.22% | 8.41% |
| Name | Action |
|---|---|
| Stericycle, Inc. (SRCL) - 64.45 | Sell the May 65.00 Calls. |
| Fastly, Inc. Class A (FSLY) - 21.61 | Sell the June 27.00 Calls. |
| Axon Enterprise Inc. (AAXN) - 82.85 | Sell the June 85.00 Calls. |
| Crocs, Inc. (CROX) - 37.84 | Sell the June 41.00 Calls. |
| Axon Enterprise Inc. (AAXN) - 82.85 | Sell the June 80.00 Calls. |
| Eldorado Resorts Inc (ERI) - 62.30 | Sell the June 65.00 Calls. |
| Western Digital Corporation (WDC) - 67.03 | Sell the June 70.00 Calls. |
| Micron Technology, Inc. (MU) - 56.88 | Sell the June 60.00 Calls. |
| Aerovironment, Inc. (AVAV) - 67.80 | Sell the June 75.00 Calls. |
| Tempur Sealy International Inc. (TPX) - 90.49 | Sell the June 95.00 Calls. |
| Name | Covered Write |
|---|---|
| Planet Fitness Inc ( PLNT - 82.58 ) | May 82.50 covered write. |
| Okta Inc ( OKTA - 132.79 ) | May 130.00 covered write. |
Daily Equity & Market Analysis
Loading, Please Wait...
