
Most Requested Symbols

One thing that caught our attention recently was a Wall Street Journal Article entitled “What We’ve Learned About Target-Date Funds, 10 Years Later.” Similar to robo-advisors, target date funds are another way that some fund companies have attempted to usurp the role of the financial advisor, however, they also offer you an opportunity.
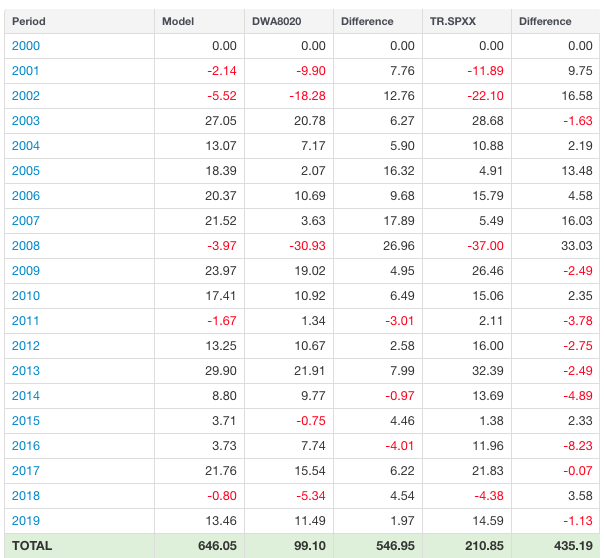
Introducing a new FSM Master Model: The Tortoise & Hare 80-20.
Today's featured stock is WEX Inc. (WEX)
BHVN, CDNA, CHE, EEFT, EXP, FATE, FICO, LEN, SEDG, SMAR, & VRTU
Call: Cisco Systems (CSCO); Put: Newell Brands Inc (NWL); Covered Call: Five Below Inc. (FIVE)
Beginner Webinar Series: Join us on Friday, May 17th, at 2:00 pm EST for our weekly Beginner Series. This week, we will be focusing on understanding and utilizing the D.A.L.I. tool. Click here to register for the upcoming webinar. Note that this series is now hosted through Zoom. Participants will have the opportunity to ask questions.
While much of our research over the past few weeks has centered on the shift in market seasonality, the month of May holds another spot that is near and dear to many of our hearts - National Hamburger Month. While thoughts of hamburgers typically do not lead to conclusions on the economy, advancements in data availability have given us the opportunity to draw such conclusions through the Big Mac Index, which measures the average price for McDonald’s top-selling burger across various countries around the world. First published by the Economist in 1986, the Big Mac Index can be used as another way to display purchasing power parity from country to country, as the burger is produced and served in a standard way in every McDonald’s restaurant (source: statista.com). In the Index evaluation from January, the United States proved to have the fourth most expensive Big Mac in the world at an average price of $5.58, with the northern European countries of Switzerland, Norway, and Sweden making up the top three of the rankings. Russia had the cheapest average price at only $1.65. The top ten countries ranked by average Big Mac price are shown below, with the entire list available here.

source: statista.com
This consistency in production has attributed to the strength of McDonald’s Corporation MCD, as evidenced in the stock’s recent reversal back up into a column of X's to match its all-time high at $200. MCD is a 4 for 5’er that has been in a positive trend since 2015 and currently ranks in the top half of the Restaurants sector RS matrix. Monthly momentum just flipped positive, and the bullish price objective of $254 suggests the potential for further upside from here. MCD also carries a yield of 2.32%. As we approach Memorial Day weekend, those looking to celebrate National Burger Month without worrying about the calories may consider adding exposure to MCD at current levels, with initial support offered at $194, and further support at $174 and $170.


One thing that caught our attention recently was a Wall Street Journal Article entitled “What We’ve Learned About Target-Date Funds, 10 Years Later.” The article begins by discussing how many investors, who were close to retirement in 2008, and were invested in 2010 target-date funds, were taken by surprise when the target-date funds in which they had invested their retirement portfolio lost a substantial portion of their value during the financial crisis. For many of us, even if we don’t know the performance of specific 2010 target-date funds during the financial crisis, this is unsurprising as we now know, that 2008 shined a spotlight on one of the major defects of modern portfolio theory – the proclaimed benefits of diversification disappeared as previously uncorrelated assets suddenly became highly correlated as panic set in and investors looked to liquidate exposure to asset classes across the board. It goes on to say that since then, the amount invested in target-date funds has grown by $532 billion, largely due to investments by 401(k) plan participants. Our point here isn't to tear apart the method by which these funds are actually constructed and rebalanced – unexpectedly large drawdowns during 2008 were by no means restricted only to target-date funds and besides, the biggest problems with target-date funds are more fundamental than simply being too reliant on historical correlations, they lie within the target-date fund concept itself.

Before we jump into the problems, it is worth pointing out, that despite their shortcomings, target-date funds are not without redeeming qualities. Well, maybe one redeeming quality, but, it is a significant one – they provide a default option for 401(k)’s and other retirement plans, many of which, thanks to the research of Richard Thaler and others, have moved to an opt-out instead of opt-in format in an effort to encourage their participants to save for retirement. And people who would not be putting aside money for retirement if they were automatically enrolled in a 401(k) plan and defaulted to a target-date fund are definitely better off than they otherwise would be. However, this does not mean we need to embrace these funds beyond this limited use case.
Similar to robo-advisors, target date funds are another way that some fund companies have attempted to usurp the role of the financial advisor. Essentially what target-date funds do is attempt to take all of the asset allocation work an advisor does for a client and boil it down to a one-size-fits allocation based on a single number – age. The further away the target-date is, the more risk-on the fund is, and as the target date draws closer, the fund’s allocation shifts to a “safer” allocation with greater weight in fixed income. Some of the problems here are immediately apparent. Aside from the questionableness of how safe these funds truly become even when they are very close to their target date, anyone who has actually prepared an asset allocation for a client can tell you trying to generate an optimal allocation based on nothing but age is a fool’s errand. Variables like income, marital status, and lifestyle all have a material impact on how a retirement portfolio should be allocated, but, of course, target-date funds factor in none of these considerations. Target-date funds also don’t take into account individual goals for retirement nor do they adjust to changing conditions. Perhaps a 30% fixed income allocation will allow you to reach your goals if bonds are yielding 5%, however, if bond yields are only 3%, the same allocation may not provide the return you need. But, target-date-funds stay the same whether your goal is to have $500,000 or $5 million and whether bonds are yielding 2% or 10%.
We’ve highlighted the shortcomings of target-date funds, but, as an advisor they also offer you an opportunity. Next time you’re talking to a prospect, ask them about their retirement plan, ask them if they have a target date fund. If they do, it offers a golden opportunity to explain the pitfalls of these funds, show them how you would create a more suitable allocation, and to talk about your methodology. In the past, we’ve also talked about the difficulties of connecting with millennial clients and with making your clients’ children into clients as well. Target date funds offer a great in-road for both. Next time you’re talking to a client with kids who are entering or are close to entering the workforce, ask them about their child’s retirement plan, ask them if they’re using a target-date fund. If they are, offer to put together a sample allocation that will better meet their needs – using the Fund Score system, you can quickly make selections from amongst their 401(k) menu and hopefully add them to your list of clients. You can use a similar approach for millennials who may not have many assets outside of their retirement plan yet, but, by offering to show them an alternative to the target-date fund in their 401(k), you’ll already have an established relationship with them down the road when they need more of the services you provide.
This business is often exposed to new products, new ideas, or new claims of being the “next best thing”. While innovation leads us forward, the promise of going where no fund, product, or manager has gone before is an oft-repeated one. You’ve been there before. Things are “as presented” until they are not, at which point the same wholesaler (who might be at a new firm by now) calls you with the new “next best thing”. Who can blame them? There are very few shortcuts in this business and in life. As the fable goes, slow and steady wins the race.

We’re pleased to announce the addition of a new Fund Score Method (FSM) model: The Tortoise & Hare 80-20. Our “next big thing” introduces a Multi-Sleeve component to the FSM models, including the ability to maintain a strategic and dynamic asset allocation that fits in with your firm’s expectations. Many of you have incorporated FSM models into your own “sleeves”, which by all accounts is still a winning strategy. Tortoise & Hare creates guardrails by establishing minimum and maximum equity/fixed income allocations during “normal” markets, with a 20% allocation specifically reserved for both equity and fixed income exposure. The CoreSolution Models, both US Core and All Cap World, serve as the designated allocation towards equities, with 10% of your total allocation going towards each model. The Franklin Fixed Income Model and Vanguard Bond Market Fund VBMFX each get 10% of the total allocation as well to round out the 20% reserved for fixed income. The dynamic aspect of the model involves being fluid to reflect market conditions, as the flexible nature of the FSM models will overweighting equities or fixed income to fill the remaining 60%. Additionally, the model sleeves have the ability to move entirely to cash by using the risk-triggers based on the US Equity Core Percentile and Money Market Percentile Rankings.
Master Model of:

By pairing multiple steadfast shop cultures, as well as the Core ETF selection, the Tortoise and Hare Model brings active and passive together into one deliverable and easy-to-implement package. Diversification with a focused tilt creates the perfect vehicle for running the long race so that your new "next big thing" doesn't become your last.

Average Level
0.80
The average Bullish Percent reading this week is 46.27% down 4.24% from the previous week
| AGG | iShares US Core Bond ETF |
| CL/ | Crude Oil Continuous |
| DJIA | Dow Jones Industrial Average |
| DVY | iShares Dow Jones Select Dividend Index |
| DX/Y | NYCE U.S.Dollar Index Spot |
| EFA | iSharesMSCI EAFE Index Fund |
| FXE | CurrencyShares Euro Trust |
| GC/ | Gold Continuous |
| GSG | iShares S&P GSCI Commodity-Indexed Trust |
| HYG | iShares iBoxx $ High Yield Corporate Bond ETF |
| ICF | iShares Cohen & Steers Realty Index |
| IEF | iShares Barclays 7-10 Yr. Tres. Bond Fund |
| LQD | iShares iBoxx $ Investment Grade Corp. |
| MID | S&P 400 MidCap Index |
| NASD | Nasdaq Composite |
| NDX | NASDAQ-100 Index |
| RSP | Guggenheim S&P 500 Equal Weight ETF |
| RUT | Russell 2000 Index |
| SHY | iShares Barclays 1-3 Year Tres. Bond Fund |
| SML | S&P 600 Small Cap Index |
| SPX | S & P 500 Index |
| TLT | iShares Barclays 20+ Year Treasury Bond Fund |
| UV/Y | Continuous Commodity Index |
| VOOG | Vanguard S&P 500 Growth ETF |
| VOOV | Vanguard S&P 500 Value ETF |
| EEM | iShares MSCI Emerging Markets ETF |
| XLG | Invesco S&P 500 Top 50 ETF |
| Symbol | Company | Sector | Current Price | Action Price | Target | Stop | Notes |
|---|---|---|---|---|---|---|---|
| DKS | Dick's Sporting Goods, Inc. | Retailing | $35.97 | $38 - $42 | $61 | $32 | 3 for 5’er, consec buy signals, pos mon mom, top half of RETA matrix, 3.03% yield, Earn. 5/29 |
| WDAY | Workday Inc. | Software | $204.99 | hi 190s - low 210s | 236 | 174 | 5 for 5'er, top 20% of favored SOFT sector matrix, bullish catapult to new all-time high, potential covered write opp, Raised Stop. Earn. 5/28 |
| BAX | Baxter International Inc. | Healthcare | $75.94 | mid-70s to low-80s | 132 | 61 | 4 for 5'er, pullback from all-time high, one box from peer RS buy, R-R>2.0 |
| CE | Celanese Corporation | Chemicals | $101.20 | $97 - $108 | $138.50 | $92 | 4 for 5’er, 5 consec buy signals, pos mon mom, 2.32% yield |
| CCI | Crown Castle International Corp. | Real Estate | $127.24 | 120 - 130 | 145 | 102 | 5 for 5'er, top 20% of REAL sector matrix, 3.6% yield, long-term positive RS |
| XEL | Xcel Energy, Inc. | Utilities/Electricity | $57.22 | 54 - 58 | 79 | 47 | 4 for 5'er, top 25% of favored EUTI sector matrix, one box away from mkt RS buy signal, pos wkly mom flip, 2.81% yield |
| ENSG | Ensign Group, Inc. | Healthcare | $55.96 | 53 - 58 | 75 | 46 | 5 for 5'er, top 10% in HEAL sector matrix, LT pos trend, pos wkly & mnthly mom flips |
| PAYC | Paycom Software Inc | Software | $204.39 | $194-$210 | $232 | $168 | 5 for 5'er, top 10% of fav SOFT matrix, consec buy signals, pullback from all-time high, pos week & mon mom |
| WEX | WEX Inc. | Business Products | $199.56 | $196 - $212 | $224 | $170 | 5 for 5’er, 4 consec buy signals, top 33% of BUSI matrix, pullback from all-time high, pos mon mom |
| Symbol | Company | Sector | Current Price | Action Price | Target | Stop | Notes |
|---|---|---|---|---|---|---|---|
| AA | Alcoa Inc. | Metals Non Ferrous | $25.01 | mid-to-upper 20s | 20 | 32 | 0 for 5'er, dead last in META sector matrix, negative trend |
| NOV | National-Oilwell, Inc. | Oil Service | $24.71 | (24 - 27) | 20 | 30 | 1 for 5'er, bottom 25% of unfavored OILS sector matrix, bearish triangle, neg. wkly mom |
| Symbol | Company | Sector | Current Price | Action Price | Target | Stop | Notes |
|---|---|---|---|---|---|---|---|
| CHTR | Charter Communications, Inc. | Media | $377.19 | 350 - 380 | 500 | 332 | See follow up comment below. |
| MELI | Mercadolibre, Inc. | Internet | $572.93 | 500s | 832 | 520 | See follow up comment below. |
| Comment |
|---|
| ADP Automatic Data Processing, Inc. R ($161.64) - Business Products - We will now raise our stop to $134, the potential trend line violation on ADP's $1-per-box chart. |
| TEAM Atlassian Corp. PLC R ($130.09) - Software - We will now raise our stop to $106, which would violate the bullish support line on TEAM's 1 point per box chart. |
| TWLO Twilio Inc R ($143.46) - Internet - We will now raise our stop to $118, which would take out two previous levels of support on TWLO's default chart. |
| RNG RingCentral, Inc. R ($123.90) - Telephone - We will now raise our stop to $100, which would take out two levels of support on RNG's default chart. |
| CYBR Cyber Ark Software R ($131.53) - Software - We will raise our stop to $108, which would take out four levels of previous support on CYBR's default chart. |
| WDAY Workday Inc. R ($211.66) - Software - We will now raise our stop to $174, which would violate the bullish support line on WDAY's default chart. |
| CHTR Charter Communications, Inc. R ($382.21) - Media - Moved above the ideal action range. Raise stop to $332. |
| MELI Mercadolibre, Inc. R ($591.39) - Internet - MELI has moved above the ideal action range. Raise stop to $520. |
WEX WEX Inc. R ($202.90) - Business Products - WEX is a perfect 5 for 5’er that ranks within the top third of the business products sector RS matrix. In addition, the stock continues to trade well above its bullish support line which has been in place since February of this year. Since returning to a buy signal in January at $160, WEX has given four consecutive buy signals with the last occurring at $194 in April. Since then, the stock rallied to $212, a new all-time high before pulling back slightly to $196. With today’s (5/16) market action, WEX reversed back up into Xs and sits just three boxes away from a new all-time high as well as the fifth consecutive buy signal, which would come with a move to $216. Monthly momentum recently flipped positive, adding to the positive technical picture. Long exposure may be added in the $196 - $212 range and we will set our initial stop at $170. We will use the bullish price objective of $224 as our target price.
| 18 | 19 | |||||||||||||||||||||||||||||||||||||||||||||||||||||
| 212.00 | 5 | 212.00 | ||||||||||||||||||||||||||||||||||||||||||||||||||||
| 208.00 | X | O | 208.00 | |||||||||||||||||||||||||||||||||||||||||||||||||||
| 204.00 | • | X | O | x | 204.00 | |||||||||||||||||||||||||||||||||||||||||||||||||
| 200.00 | X | X | • | X | O | x | 200.00 | |||||||||||||||||||||||||||||||||||||||||||||||
| 198.00 | X | X | O | X | O | • | X | O | x | 198.00 | ||||||||||||||||||||||||||||||||||||||||||||
| 196.00 | X | O | X | O | X | O | • | X | O | 196.00 | ||||||||||||||||||||||||||||||||||||||||||||
| 194.00 | 7 | O | X | O | A | • | 4 | Mid | 194.00 | |||||||||||||||||||||||||||||||||||||||||||||
| 192.00 | X | X | O | 9 | O | • | X | X | 192.00 | |||||||||||||||||||||||||||||||||||||||||||||
| 190.00 | X | O | X | O | X | X | O | X | • | X | O | X | 190.00 | |||||||||||||||||||||||||||||||||||||||||
| 188.00 | X | O | X | 8 | X | O | X | O | X | O | • | X | O | X | 188.00 | |||||||||||||||||||||||||||||||||||||||
| 186.00 | X | O | O | X | O | X | O | X | O | • | X | O | X | 186.00 | ||||||||||||||||||||||||||||||||||||||||
| 184.00 | X | X | O | X | O | X | O | X | O | • | X | O | 184.00 | |||||||||||||||||||||||||||||||||||||||||
| 182.00 | X | O | X | O | X | O | O | X | O | • | X | X | 182.00 | |||||||||||||||||||||||||||||||||||||||||
| 180.00 | X | O | 6 | O | O | X | O | X | • | 3 | O | X | 180.00 | |||||||||||||||||||||||||||||||||||||||||
| 178.00 | X | O | X | O | X | O | X | O | • | X | O | X | 178.00 | |||||||||||||||||||||||||||||||||||||||||
| 176.00 | X | O | X | O | O | X | O | • | X | O | X | 176.00 | ||||||||||||||||||||||||||||||||||||||||||
| 174.00 | X | O | X | O | X | B | • | X | O | X | 174.00 | |||||||||||||||||||||||||||||||||||||||||||
| 172.00 | X | O | O | X | O | • | X | O | 172.00 | |||||||||||||||||||||||||||||||||||||||||||||
| 170.00 | X | O | X | O | X | Bot | 170.00 | |||||||||||||||||||||||||||||||||||||||||||||||
| 168.00 | X | O | X | O | X | 168.00 | ||||||||||||||||||||||||||||||||||||||||||||||||
| 166.00 | X | O | X | O | X | 166.00 | ||||||||||||||||||||||||||||||||||||||||||||||||
| 164.00 | X | 5 | O | O | 2 | 164.00 | ||||||||||||||||||||||||||||||||||||||||||||||||
| 162.00 | X | X | O | X | O | X | X | X | X | 162.00 | ||||||||||||||||||||||||||||||||||||||||||||
| 160.00 | X | O | X | O | X | O | X | O | X | O | X | O | X | 160.00 | ||||||||||||||||||||||||||||||||||||||||
| 158.00 | X | X | O | X | X | O | O | X | O | X | X | X | O | X | O | X | 158.00 | |||||||||||||||||||||||||||||||||||||
| 156.00 | X | X | O | X | O | X | O | X | O | X | O | X | O | X | O | X | O | O | 156.00 | |||||||||||||||||||||||||||||||||||
| 154.00 | X | O | X | O | X | O | X | O | X | O | O | X | O | X | O | X | 154.00 | |||||||||||||||||||||||||||||||||||||
| 152.00 | X | O | X | O | X | O | X | 4 | O | C | X | O | X | 152.00 | ||||||||||||||||||||||||||||||||||||||||
| 150.00 | X | 2 | X | O | X | O | O | O | X | • | 150.00 | |||||||||||||||||||||||||||||||||||||||||||
| 148.00 | X | O | X | 3 | O | X | • | 148.00 | ||||||||||||||||||||||||||||||||||||||||||||||
| 146.00 | X | O | X | • | O | X | • | 146.00 | ||||||||||||||||||||||||||||||||||||||||||||||
| 144.00 | 1 | O | X | • | O | X | • | 144.00 | ||||||||||||||||||||||||||||||||||||||||||||||
| 142.00 | X | O | X | • | O | 1 | • | 142.00 | ||||||||||||||||||||||||||||||||||||||||||||||
| 140.00 | X | O | X | • | O | X | • | 140.00 | ||||||||||||||||||||||||||||||||||||||||||||||
| 138.00 | X | O | X | • | O | X | • | 138.00 | ||||||||||||||||||||||||||||||||||||||||||||||
| 136.00 | X | O | X | • | O | X | • | 136.00 | ||||||||||||||||||||||||||||||||||||||||||||||
| 134.00 | X | O | X | • | O | X | • | 134.00 | ||||||||||||||||||||||||||||||||||||||||||||||
| 132.00 | X | O | • | O | • | 132.00 | ||||||||||||||||||||||||||||||||||||||||||||||||
| 130.00 | C | • | • | 130.00 | ||||||||||||||||||||||||||||||||||||||||||||||||||
| 128.00 | X | • | 128.00 | |||||||||||||||||||||||||||||||||||||||||||||||||||
| 126.00 | B | • | 126.00 | |||||||||||||||||||||||||||||||||||||||||||||||||||
| 124.00 | X | • | 124.00 | |||||||||||||||||||||||||||||||||||||||||||||||||||
| 122.00 | X | • | 122.00 | |||||||||||||||||||||||||||||||||||||||||||||||||||
| 120.00 | O | X | • | 120.00 | ||||||||||||||||||||||||||||||||||||||||||||||||||
| 118.00 | O | X | • | 118.00 | ||||||||||||||||||||||||||||||||||||||||||||||||||
| 116.00 | O | A | • | 116.00 | ||||||||||||||||||||||||||||||||||||||||||||||||||
| 114.00 | O | X | X | • | 114.00 | |||||||||||||||||||||||||||||||||||||||||||||||||
| 112.00 | O | X | O | X | X | • | 112.00 | |||||||||||||||||||||||||||||||||||||||||||||||
| 110.00 | O | X | O | X | O | 9 | • | 110.00 | ||||||||||||||||||||||||||||||||||||||||||||||
| 108.00 | 3 | X | X | 7 | O | X | O | X | • | 108.00 | ||||||||||||||||||||||||||||||||||||||||||||
| 106.00 | O | 4 | O | 6 | O | X | O | X | 8 | X | • | 106.00 | ||||||||||||||||||||||||||||||||||||||||||
| 104.00 | O | X | O | X | O | X | O | O | X | • | 104.00 | |||||||||||||||||||||||||||||||||||||||||||
| 102.00 | O | X | O | X | O | O | • | 102.00 | ||||||||||||||||||||||||||||||||||||||||||||||
| 100.00 | O | 5 | X | • | 100.00 | |||||||||||||||||||||||||||||||||||||||||||||||||
| 99.00 | O | X | • | 99.00 | ||||||||||||||||||||||||||||||||||||||||||||||||||
| 98.00 | O | • | 98.00 | |||||||||||||||||||||||||||||||||||||||||||||||||||
| 18 | 19 |

| BHVN Biohaven Pharmaceutical Holding Company Ltd. ($64.06) - Drugs - Biohaven returned to a buy signal with a triple top break at $65. The advance marks a new all-time high for the 5 for 5’er that has been in a positive trend since May 2018. In addition, the stock maintained a market RS buy signal since June 2018, confirming its long-term strength relative to the broader market. Okay to buy or hold here as demand is in control. Note initial support is offered at $61, with subsequent support at $56. |
| CDNA CareDx Inc. ($34.63) - Healthcare - CDNA broke a double top at $35, marking the second consecutive buy signal on the chart. This 5 for 5'er has maintained both its bullish support line and market RS buy signal since 2017. The recent flip to positive weekly momentum and the bullish price objective of $51 indicate the potential for further price appreciation from here. Initial support can be found at $31, with the potential for overhead resistance coming at $39. |
| CHE Chemed, Inc. ($334.87) - Household Goods - CHE broke a spread triple top at $336 on Thursday and is now trading at new all-time highs. CHE, a 5 for 5’er, ranks in the top quartile of the favored household goods sector and continues to trade well above its bullish support line that has been in place since late 2013. In addition, both weekly and monthly momentum recently flipped positive, adding to the positive technical picture. Demand is in control and the technical picture is strong. Okay to buy or hold here. Initial support is offered at $316, the April low. |
| EEFT Euronet Services Inc. ($153.65) - Finance - EEFT reversed back into Xs Thursday and broke a double top at $154, marking a new all-time high as well as the fourth consecutive buy signal. This 5 for 5'er ranks 4th out of 82 names in the Finance sector RS matrix and moved back to a positive trend in January. The technical picture for EEFT is strong, however, those looking to add exposure would be best served to wait for a pullback as the stock is entering overbought territory. Initial support comes at $146 with further support at $140 and $136. |
| EXP Eagle Materials, Inc. ($90.92) - Building - EXP reversed back up into Xs and broke a double top at $93 following their earnings release Thursday morning, marking the fourth consecutive buy signal on the chart. This 4 for 5'er moved to a positive trend in March and ranks in the upper quartile of names in the Building sector RS matrix. EXP has also maintained a market RS buy signal since early 2012, confirming the stock’s long-term strength versus the broader market. Those looking to add exposure may consider the stock at current levels, with initial support at $87 and further support at $82. |
| FATE Fate Therapeutics, Inc, ($19.62) - Healthcare - FATE moved higher today and broke a double top at $18.50 before ultimately moving through multiple levels of resistance to hit an all-time high at $20. Today’s move marks a positive trend reversal, promoting FATE to a 4 for 5’er. In addition, FATE continues to show long-term strength relative to both the market and its peers. Weekly and monthly momentum recently flipped positive, suggesting the potential for further gains. Demand is in control. Note with today’s move, FATE is nearing overbought territory. Initial support is found at $16. |
| FICO Fair, Isaac & Company, Incorporated ($294.21) - Software - FICO broke a double top at $292 before moving higher to $296 on Thursday, marking a new all-time high as well as the third consecutive buy signal. This stock ranks within the top quartile of the favored software sector matrix and has maintained its market RS buy signal since August of 2009. In addition, the bullish price target of $494 suggests the potential for higher prices. At this time, FICO is nearing overbought territory. Note initial support is offered at $276. |
| LEN Lennar Corporation ($53.87) - Building - Shares of LEN moved higher Thursday to break a double top at $54, marking its fourth consecutive buy signal of 2019. This 3 for 5'er moved to a positive trend in February and ranks in the top third of the Building sector RS matrix. The bullish price objective of $66 suggests the potential for further upside from here. LEN has initial support at $49 and further support at $45. |
| SEDG Solaredge Technologies ($55.51) - Machinery and Tools - SEDG shares reversed to a column of Xs today, advancing to $55 to break a double top, marking a second consecutive buy signal. Solaredge, a perfect 5 for 5’er, flipped to a positive trend in April, and ranks in the top decile of the Machinery and Tools sector matrix. It has been on a market RS buy signal since February 2018, confirming long-term strength to the broader market. From here, support resides at $50, while initial overhead resistance is found at $58. Prospective longs may be best served to wait for a pullback before adding exposure as SEDG is heavily overbought at current levels. |
| SMAR Smartsheet, Inc. Class A ($42.52) - Software - After a period of consolidation on the chart, SMAR completed a bullish triangle pattern with a double top break at $43. SMAR, a 4 for 5'er within the favored software sector, moved to a positive trend in January and gave a RS buy signal against the market in February. The technical picture for SMAR is improving. Initial support can be found at $39 and further support at $37 and $36. Overhead resistance can be found at the all-time high of $49 from March of this year. |
| VRTU Virtusa Corporation ($42.61) - Computers - VRTU broke a triple bottom at $51, returning to a sell signal before printing a long column of Os to $42. The decline follows negative earnings news for the stock and results in a trend violation, demoting VRTU to a 4 for 5’er. We would caution against adding new exposure at this time and those with open positions may wish to reevaluate. From here, the next level of support is found at $38. Today’s action puts VRTU in heavily oversold territory. |
| Name | Option Symbol | Action | Stop Loss |
|---|---|---|---|
| Cisco Systems, Inc. - $55.93 | O:CSCO 19H55.00D16 | Buy the August 55.00 calls at 3.10 | 51.00 |
| Name | Option | Action |
|---|---|---|
| T-Mobile US Inc. ( TMUS) | Jun. 65.00 Calls | Raise the option stop loss to 8.15 (CP: 10.15) |
| KB Home ( KBH) | Jul. 23.00 Calls | Initiate an option stop loss of 2.70 (CP: 4.70) |
| Fidelity National Information Services, ( FIS) | Jul. 110.00 Calls | Raise the option stop loss to 8.00 (CP: 10.00) |
| Sysco Corporation ( SYY) | Aug. 60.00 Calls | Raise the option stop loss to 12.60 (CP: 14.60) |
| Name | Option Symbol | Action | Stop Loss |
|---|---|---|---|
| Newell Brands Inc. - $15.54 | O:NWL 19U16.00D20 | Buy the September 16.00 puts at 1.90 | 17.00 |
| Name | Option | Action |
|---|---|---|
| AbbVie Inc. (ABBV) | Aug. 82.50 Puts | Stopped at 5.75 (CP: 5.75) |
| Big Lots, Inc. (BIG) | Jul. 45.00 Puts | Raise the option stop loss to 10.00 (CP: 12.00) |
| Nordstrom, Inc. (JWN) | Oct. 45.00 Puts | Raise the option stop loss to 7.15 (CP: 9.15) |
| Baidu, Inc. (China) ADR (BIDU) | Sep. 175.00 Puts | Stopped at 24.95 (CP: 23.80) |
| Name | Option Sym. | Call to Sell | Call Price | Investment for 500 Shares | Annual Called Rtn. | Annual Static Rtn. | Downside Protection |
|---|---|---|---|---|---|---|---|
| Five Below Inc $127.76 | O:FIVE 19H130.00D16 | Aug. 130.00 | 8.80 | $59,900.20 | 29.56% | 24.64% | 5.85% |
| Name | Action |
|---|---|
| Liveramp Holdings Inc. (RAMP) - 55.74 | Sell the August 60.00 Calls. |
| Advanced Micro Devices, Inc. (AMD) - 27.58 | Sell the October 29.00 Calls. |
| Workday Inc. (WDAY) - 204.99 | Sell the September 210.00 Calls. |
| Twitter, Inc (TWTR) - 37.90 | Sell the September 40.00 Calls. |
| Iridium Communications, Inc. (IRDM) - 24.98 | Sell the October 28.00 Calls. |
| Okta Inc (OKTA) - 106.13 | Sell the August 110.00 Calls. |
| Wayfair Inc. (W) - 144.22 | Sell the August 155.00 Calls. |
| Twilio Inc (TWLO) - 135.45 | Sell the October 140.00 Calls. |
| Atlassian Corp. PLC (TEAM) - 126.08 | Sell the August 130.00 Calls. |
| Name | Covered Write |
|---|---|
| D.R. Horton, Inc. ( DHI - 44.05 ) | August 45.00 covered write. |
| Paycom Software Inc ( PAYC - 204.39 ) | August 210.00 covered write. |
Daily Equity & Market Analysis
Loading, Please Wait...
