Registration for Friday's Beginner Webinar Series, and a timely indicator for National Burger Month
Beginner Webinar Series: Join us on Friday, May 17th, at 2:00 pm EST for our weekly Beginner Series. This week, we will be focusing on understanding and utilizing the D.A.L.I. tool. Click here to register for the upcoming webinar. Note that this series is now hosted through Zoom. Participants will have the opportunity to ask questions.
While much of our research over the past few weeks has centered on the shift in market seasonality, the month of May holds another spot that is near and dear to many of our hearts - National Hamburger Month. While thoughts of hamburgers typically do not lead to conclusions on the economy, advancements in data availability have given us the opportunity to draw such conclusions through the Big Mac Index, which measures the average price for McDonald’s top-selling burger across various countries around the world. First published by the Economist in 1986, the Big Mac Index can be used as another way to display purchasing power parity from country to country, as the burger is produced and served in a standard way in every McDonald’s restaurant (source: statista.com). In the Index evaluation from January, the United States proved to have the fourth most expensive Big Mac in the world at an average price of $5.58, with the northern European countries of Switzerland, Norway, and Sweden making up the top three of the rankings. Russia had the cheapest average price at only $1.65. The top ten countries ranked by average Big Mac price are shown below, with the entire list available here.

source: statista.com
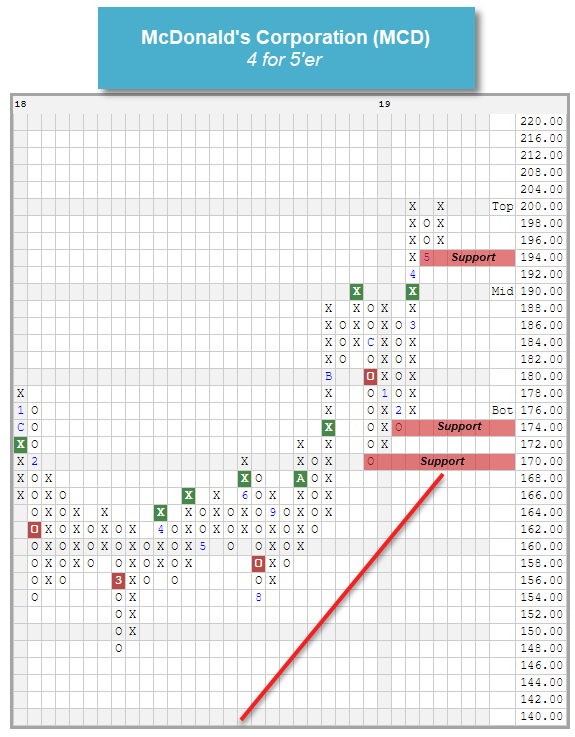
This consistency in production has attributed to the strength of McDonald’s Corporation MCD, as evidenced in the stock’s recent reversal back up into a column of X's to match its all-time high at $200. MCD is a 4 for 5’er that has been in a positive trend since 2015 and currently ranks in the top half of the Restaurants sector RS matrix. Monthly momentum just flipped positive, and the bullish price objective of $254 suggests the potential for further upside from here. MCD also carries a yield of 2.32%. As we approach Memorial Day weekend, those looking to celebrate National Burger Month without worrying about the calories may consider adding exposure to MCD at current levels, with initial support offered at $194, and further support at $174 and $170.

