Most Requested Symbols

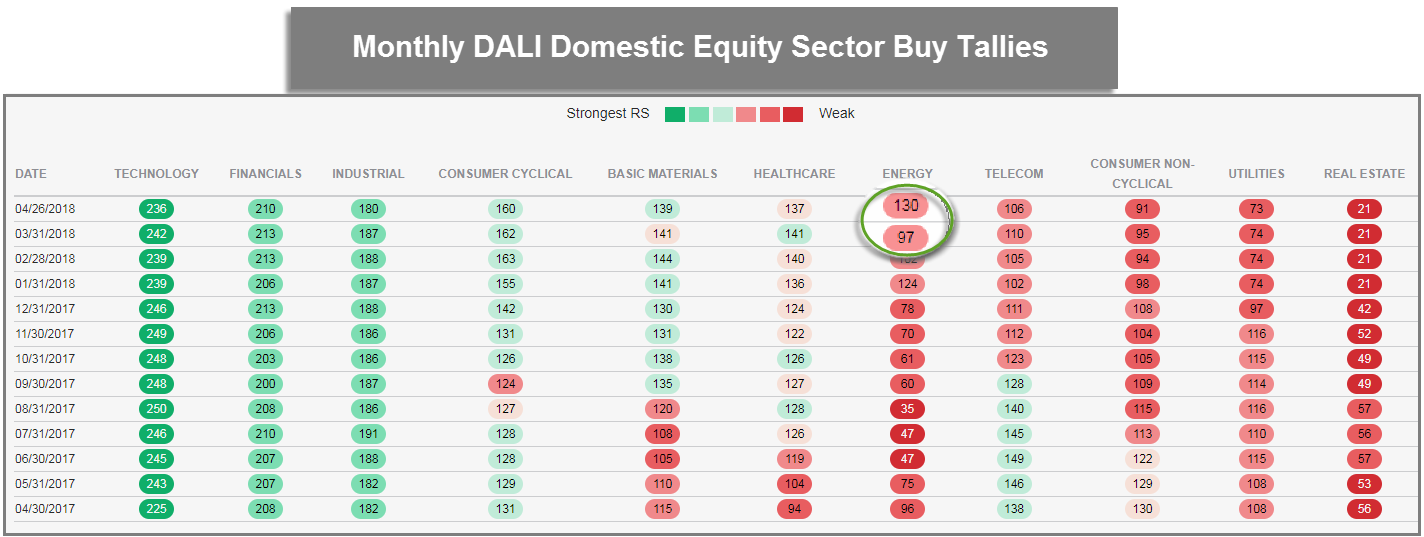
Thus far in April, Energy is by far the most improved domestic equity sector in DALI, having gained 33 buy signals since March 31. Actually, Energy is the only sector to have gained buy signals, as it has siphoned signals from every other domestic equity sector, with the exception of Real Estate. The biggest contributor to Energy's gain has been the Oil sub-sector, which has accumulated 16 of the 33 buy signals and currently sits a column of X’s against every other constituent of the DALI sector matrix. In fact, if the matrix is ranked by the number of relative strength charts in X’s, each of the top four funds belong to the Energy sector, reflecting the significant improvement of the sector over the short-term.

ESG. No, it’s not another CUSIP to add to your watch lists, but an important acronym that we think advisors should become familiar with. ESG stands for Environment, Social, and Governance. Why does this matter? According to the 2016 Global Survey of Individual Investors by Natixis Global Asset Management, almost 70% of investors think it’s important to invest in companies with a positive social impact. In fact, according to US News, "twenty-eight percent of millennials said they were "very interested" in sustainable investing compared to just 19 percent of the overall population. Two years later, in 2017, Morgan Stanley took the numbers again. This time, 86 percent of millennials were interested in sustainable investing, including 38 percent who were "very interested." (Source: US News)
So what is ESG? ESG refers to an investment strategy that promotes causes around human rights, consumer protection, and environmental contributions, just to name a few. Socially responsible investing typically includes the avoidance of companies that are involved with "unethical" products or practices such as alcohol or alcohol production, gambling, and tobacco. As seen in the image below (source: MSCI ESG Research), ESG has a wide range of practices that it evaluates from climate change, to labor standards, pay, and natural capital. ESG names typically come from consumer-consious sectors like Technology, Consumer Cyclical, and Healthcare, while avoiding sub-sectors such as defense names, gun stocks, and tobacco companies.
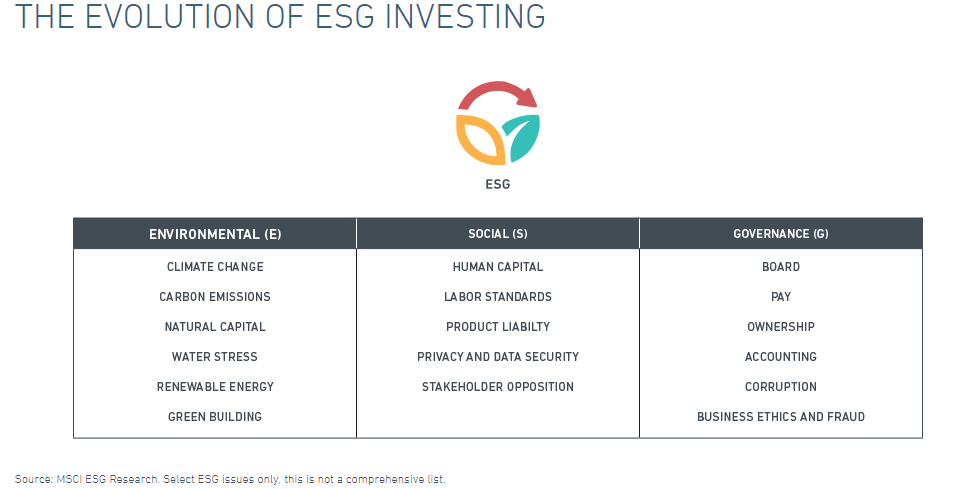
(Image Source: MSCI ESG Research)
Over the past few weeks, we’ve witnessed many non-socially responsible sectors start to break down (think guns, tobacco, defense), which brought our attention back to this growing space. After doing some digging, we found that there are about 50+ ESG ETFs that are trading in the US. So how can investors actually go about exposure to this growing area of the market? Using the DWA system, we were able to identify an attractive ESG-related fund, review the fund’s technical health, and screen the holdings for individual ideas, all of which you will find below.
One socially responsible fund that we came across is the iShares MSCI ESG Select ETF SUSA. SUSA offers investors the ability to participate in this area of the market as the fund, “seeks to track the investment results of an index composed of U.S. companies that have positive environmental, social and governance characteristics as identified by the index provider.” (ishares.com) Comprised of 101 companies, SUSA has managed to come across our radar for its triangle formation and the fact that many of its holdings have come across our technical screens. Additionally, SUSA has a solid fund score above the 3-threshold. Of course, you can take a diversified approach and consider SUSA on its own, or you can consider buying some of SUSA’s holdings, giving you a more focused take on this area of the market. Before we examine SUSA for individual ideas, let’s take a look at its holdings using three tools on the DWA research platform - ETF holdings, Portfolio breakdown, and the RS matrix.
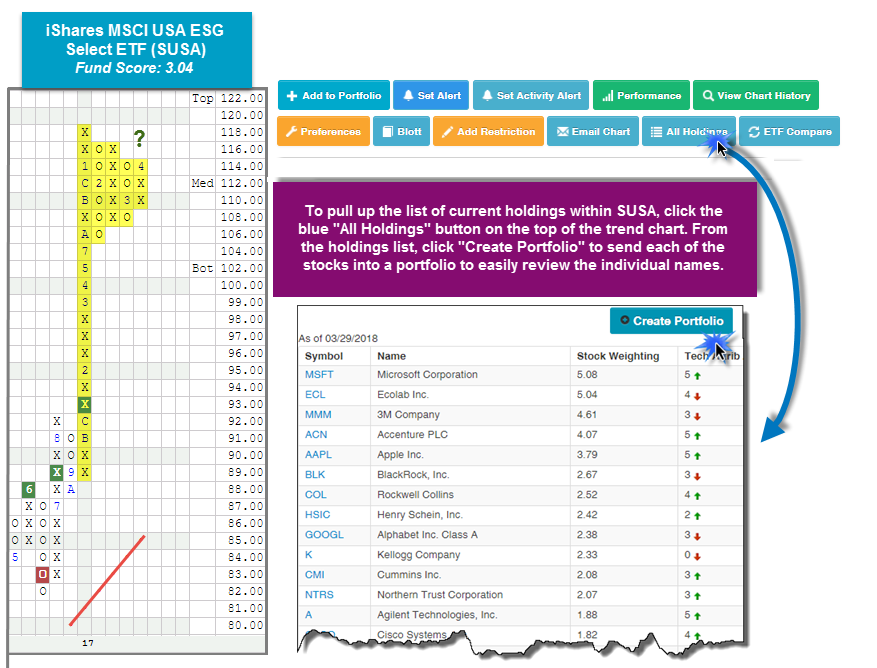
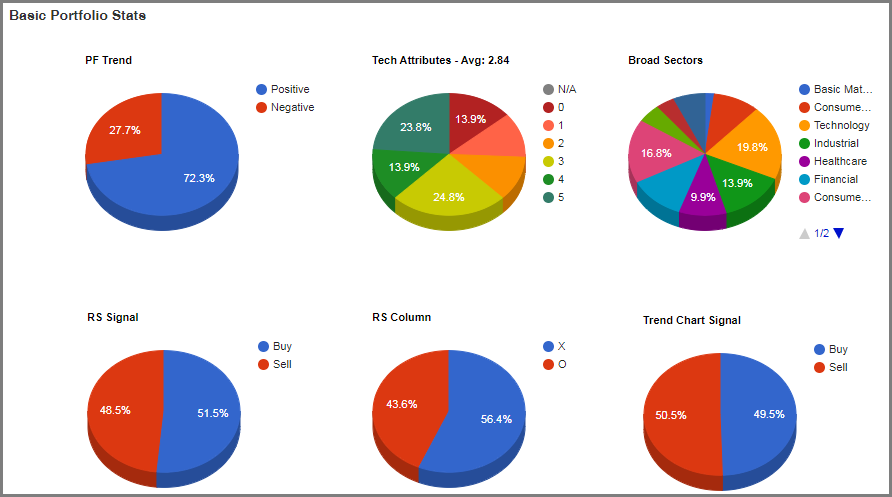
To begin our review of the fund's holdings, we first need to add the individual stocks to a portfolio. Directly off of the trend chart, simply click the blue “All Holdings” button. This populates a list of the current holdings. From here, click the “Create Portfolio” button. You have now created a portfolio of all of the holdings within the fund and we can now begin our analysis. From the portfolio, simply click the “Evaluation” tab to generate the pie charts in the image below. Generally speaking, SUSA offers a fairly healthy, technically sound portfolio. In total, roughly 51.5% of the portfolio is on a Market RS Buy Signal and 56.40% are in Xs versus the Market, as well. Additionally, 72% of the stocks are trading in an overall positive trend and 62.5% have technical attribute readings of 3 or higher. From a sector perspective, SUSA has an overweight to the strongest RS sectors with a 20% overweight to the Technology sector, followed by a 17% weighing to the Consumer Cyclical sector.
An efficient way to find the leaders within the ESG space is to run the current SUSA holdings through a relative strength Matrix screening. This will compare each of the holdings on a relative strength basis to one another. From the portfolio created earlier, click on “Portfolio Actions” and “Create Matrix”. Note that the matrix tool is able to compare 100 tickers at a time, so for today’s example we’ve weeded out Campbell Soup Company CPB, the Procter & Gamble Company PG, and General Mills GIS from the list due to their extreme technical weakness. Once the RS Matrix has been calculated and ranked, you are left with an objective ranking of SUSA’s stocks, ordered by their respective relative strength. In the image below, we have provided you with a ranking of SUSA’s holdings, along with two benchmarks, the SUSA itself and the broader market (SPY), which are both highlighted in yellow. At the top of the matrix, you are provided with the elite ESG names, at least from a relative strength standpoint while the stocks at the bottom of the matrix have experienced some sort of technical breach, causing them to rank low on a relative strength basis.
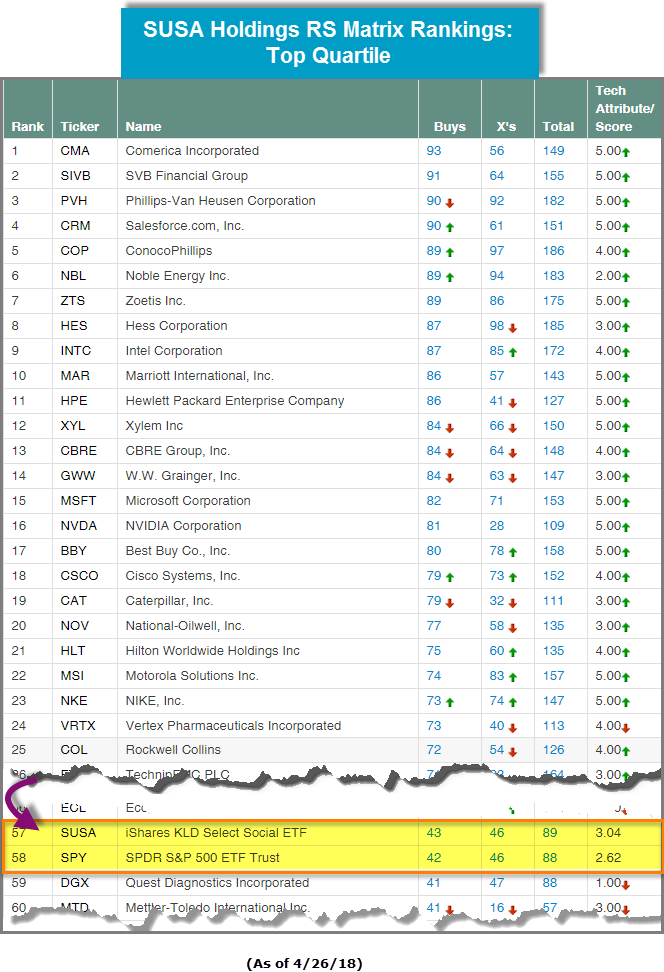
Focusing on the top quartile of the matrix, we find CRM. CRM’s long term trend of outperformance has pushed it up to the fourth position on the SUSA matrix. In addition to its high ranking, it has all 5 technical attributes in its favor, speaking to its long and short term strength versus the market and its peers. Looking to the trend chart below, notice how CRM has given six consecutive buy signals since June 2017, confirming that demand is in control. Additionally, we see that with recent action, CRM has formed a triangle pattern on the chart after a period of consolidation over the past month. With yesterday’s (4/26) market action, CRM reversed up into Xs at $122 and is now two boxes away from completing a bullish triangle pattern on the chart.
While CRM has maintained a market RS buy signal since 2013, CSCO, ranked in 18th place on the matrix and well above SUSA, recently experienced a notable market RS buy signal for the first time since moving to a sell signal on August 31st, 2010. CSCO has maintained a positive trend since September 2012 and has given three consecutive buy signals since July 2016. CSCO, which "designs, manufactures, and sells Internet Protocol (IP) based networking and other products related to the communications and information technology industry worldwide" (source: Yahoo Finance), is rated a 4 for 5'er and with today’s (4/27) intraday action, printed another X at $45, sitting just two boxes away from a buy signal as well as a new 18-year high. At this time, both CRM and CSCO are trading in the middle of their trading bands with OBOS% readings of +9%, and +8%, respectively. Given these levels, these two positions are actionable here. CRM has support between the $112 and $116 levels, while the long-term trend line can be found at $96. Support for CSCO can be found at $41, followed by $38.

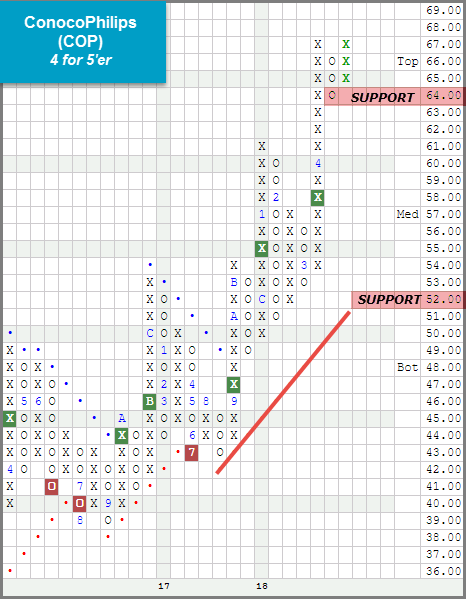
Another attractive ESG name from the top quartile of the matrix above is COP. COP, which ranks fifth, is a strong 4 for 5’er within the favored Oil sector. As seen on the chart below, COP completed a bullish triangle pattern in March after a period of consolidation which was then followed by a strong rally to $67. Earlier this month, COP exhaled slightly to $64 and, with yesterday’s (4/26) action, reversed up into Xs where it has formed a double top at $67. From here, a move to $68 would complete a fourth consecutive buy signal and mark a new multi-year high. At this juncture, COP is 104% overbought so those looking to initiate new positions would best be served on a pullback to the lower $60's. Support for COP lies at $64, while the bullish support line is at $52.
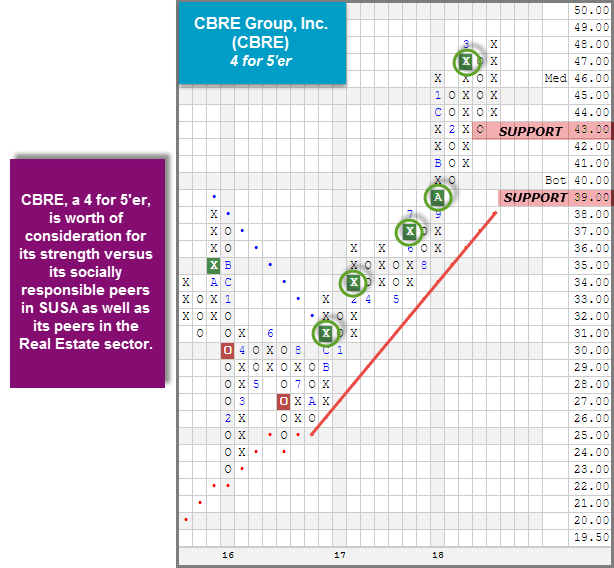
Similar to COP, CBRE is a 4 for 5’er that ranks in the top quartile of the SUSA matrix (13th). In December 2016, CBRE experienced a positive trend change and has given five consecutive buy signals since as demand has remained in control. CBRE offers a healthy technical picture and is currently just one box away from a new all-time high on the chart. CBRE is worthy of consideration for its strength versus its socially responsible peers in SUSA as well as its peers in the Real Estate sector, which is Unfavored. For those looking to initiate new positions, CBRE has an OBOS% reading of -23%, so you may look to scale in current levels. The first sign of trouble from here would occur at $42, a double bottom sell signal, while a move to $38 would violate the long term trend line.
Does it seem like the pace of change seems to be accelerating as time goes on? Well, indeed it is when it comes to the average company lifespan in the S&P 500 Index (Source Innosight).
Imagine a world in which the average company lasted just 12 years on the S&P 500. That’s the reality we could be living in by 2027, according to Innosight’s biennial corporate longevity forecast.
There are a variety of reasons why companies drop off the list. They can be overtaken by a faster growing company and fall below the market cap size threshold (currently that cutoff is about $6 billion). Or they can enter into a merger, acquisition or buyout deal. At the current and forecasted turnover rate, the Innosight study shows that nearly 50% of the current S&P 500 will be replaced over the next ten years. This projection is consistent with our previous analysis from 2012 and 2016, which Innosight originally conducted with Creative Destruction author Richard Foster.

Over the past five years alone, the companies that have been displaced from the S&P list include many iconic corporations (Table 1).

By tracking all the additions and deletions from the S&P 500 over the past half century, our study shows that lifespans of companies tend to fluctuate in cycles that often mirror the state of the economy and reflect disruption from technologies, ranging from biotech breakthroughs to social media to cloud computing. Over time, the larger trendline is for average longevity to continue to slope downward.
My emphasis added. Although there are wide-ranging implications of this trend, there are some specific takeaways for active investors. First, the idea of investing in specific companies for the long-run is increasingly impossible even if you wanted to! Technological innovation, digital disruption, globalization and many other factors are at play here.
Does this have any implications for relative strength investors? Is there a need to use more sensitive relative strength signals going forward? I don’t think so; at least I haven’t seen that show up in any of the ongoing relative strength research that I consume. However, I think this trend of accelerating creative destruction does mean that active investors need to closely monitor their holdings. I think it does mean that if you have a client who buys a portfolio of stocks and plans to hold those positions for decades they may very well have a rude awakening when they look at the results. I think it does mean that investors need to have an investment strategy that isn’t trapped by yesterday’s assumptions. We are in a dynamic economic environment---having a data driven approach to monitoring your holdings may be increasing important in the years ahead.
The relative strength strategy is NOT a guarantee. There may be times where all investments and strategies are unfavorable and depreciate in value. Past performance is not indicative of future results. Potential for profits is accompanied by possibility of loss.

International funds have slipped in score over the week and in retrospect have migrated to a lower score than 4th quarter last year. A recent dip in Emerging Market related funds have helped add to the more recent dip in April. The macro collection of All Global & Non-US funds now scores at a 3.62, down 0.4 points from the recent high score of just over the 4 handle. More recently, you've seen the number of blue groups within the International groups begin to diminish relative to the beginning of the year. The slip is enough to at least cause you to monitor the situation and inspect you inventory to make sure that your funds are doing what you expect them to be doing.

As a result of recent slips in International funds the relative remainder is primarily US Funds at the top of the scores. Due to the S&P 500 not giving up its vigor also, the net result is a rise in the CorePR reading. CorePR is now near the 79% level, which places the S&P type of investments at the top quintile of relative strength concerning all asset classes. That is a strong level that should cause you to be confident with your US investment strategy, provided you have a healthy amount of investment into the Core of the market itself. Leading groups that measure above the core of the market include the Internet, Small Growth, Technology and Banks. As for Non-US exposures, Latin America is at that lead with a 4.41 score with the Pacific Basin close behind. The best directional movers of the blue groups goes to Small Growth and MicroCaps, which share a directional value of 0.23 points.

The Distribution Report below places Major Market ETFs and Indices into a bell curve style table based upon their current location on their 10-week trading band. The middle of the bell curve represents areas of the market that are "normally" distributed, with the far right being 100% overbought on a weekly distribution and the far left being 100% oversold on a weekly distribution. The weekly distribution ranges are calculated at the end of each week, while the placement within that range will fluctuate during the week. In addition to information regarding the statistical distribution of these market indexes, a symbol that is in UPPER CASE indicates that the RS chart is on a Buy Signal. If the symbol is dark Green then the stock is on a Point & Figure buy signal, and if the symbol is bright Red then it is on a Point & Figure sell signal. Box Color indicates the Sector Status Rating. Green = Favored, Yellow = Average, and Red = Unfavored.
The average Bullish Percent reading this week is 47.45% down 1.83% from the previous week
| <--100 | -100--80 | -80--60 | -60--40 | -40--20 | -20-0 | 0-20 | 20-40 | 40-60 | 60-80 | 80-100 | 100-> | |||
 |
||||||||||||||
| Symbol | Name | Symbol | Name |
| AGG | iShares US Core Bond ETF | NASD | Nasdaq Composite |
| CL/ | Crude Oil Continuous | NDX | NASDAQ-100 Index |
| DJIA | Dow Jones Industrial Average | RSP | Guggenheim S&P 500 Equal Weight ETF |
| DVY | iShares Dow Jones Select Dividend Index | RUT | Russell 2000 Index |
| DX/Y | NYCE U.S.Dollar Index Spot | SHY | iShares Barclays 1-3 Year Tres. Bond Fund |
| EFA | iSharesMSCI EAFE Index Fund | SML | S&P 600 Small Cap Index |
| FXE | CurrencyShares Euro Trust | SPX | S & P 500 Index |
| GC/ | Gold Continuous | TLT | iShares Barclays 20+ Year Treasury Bond Fund |
| GSG | iShares S&P GSCI Commodity-Indexed Trust | UV/Y | Continuous Commodity Index |
| HYG | iShares iBoxx $ High Yield Corporate Bond ETF | VOOG | Vanguard S&P 500 Growth ETF |
| ICF | iShares Cohen & Steers Realty Index | VOOV | Vanguard S&P 500 Value ETF |
| IEF | iShares Barclays 7-10 Yr. Tres. Bond Fund | VWO | Vanguard FTSE Emerging Markets ETF |
| LQD | iShares iBoxx $ Investment Grade Corp. | XLG | Guggenheim S&P 500 Top 50 ETF |
| MID | S&P 400 MidCap Index |

| Stock | Symbol | Sector | Current Price | Action Price | Target | Stop | Notes |
|---|---|---|---|---|---|---|---|
| Avis Budget Group, Inc. | CAR | Retailing | $48.56 | 48 - 52 | 68 | 41 | 5 for 5'er, top 25% of RETA sector matrix, spread triple top, recent mkt RS buy signal, good R-R Earn. 5/2/18 |
| GoDaddy Inc. | GDDY | Internet | $64.75 | low 60's | 70 | 50 | 5 for 5'er, top 25% of favored INET sector, consistently bullish pattern, new peer RS buy signal, Earn. 5/8/18 |
| Globus Medical, Inc. | GMED | Healthcare | $51.97 | 50 - 53 | 83 | 42 | 5 for 5'er, top 10% of favored HEAL sector matrix, recent RS buy signals, R-R>3 Earn. 5/1 |
| Hewlett Packard Enterprise Company | HPE | Computers | $17.39 | 17 - 19 | 20.50 | 14.50 | 5 for 5'er, top 25% of favored COMP sector matrix, bullish pattern, fresh peer RS reversal & buy signal, 2.2% yield |
| IAC/InterActiveCorp | IAC | Media | $160.47 | 163 - 170 | 206 | 148 | 5 for 5'er, #1 in Media sector matrix, bullish chart pattern, at action pt. of potential shakeout, Earn. 5/9/18 |
| Keysight Technologies Inc | KEYS | Electronics | $53.79 | 52 - 55 | 64 | 42 | 4 for 5'er, top 10% of ELEC sector matrix, bullish catapult, new mkt RS buy signal, |
| East West Bancorp, Inc. | EWBC | Banks | $66.52 | 64 - 70 | 91 | 59 | 5 for 5'er, top 20% of favored BANK sector matrix, action pt. of pot. shakeout, pos. wkly mom change |
| Intuit Inc. | INTU | Software | $185.18 | 174 - 188 | 206 | 150 | 5 for 5'er, top half of favored SOFT matrix, breakout to new all-time high, pos. wkly mom. change, raised action range. Earn. 5/21/18 |
| BB & T Corporation | BBT | Banks | $53.32 | 52 - 57 | 45 | 45 | 3 for 5'er. top half of favored BANK sector matrix, potential shakeout, pos. weekly mom change, 2.8% yield |
| Stock | Symbol | Sector | Current Price | Action Price | Target | Stop | Notes |
|---|---|---|---|---|---|---|---|
| Dave & Busters Entertainment | PLAY | Restaurants | $42.55 | low 40s | 29 | 48/51 | 0 for 5'er, 33 out of 35 in REST Matrix, new 52-week low, negative trend |
| Prestige Brand Holdings, Inc. | PBH | Drugs | $31.83 | (30 - 33) | 28 | 37 | 0 for 5'er, 49 of 51 in unfavored DRUG sector matrix, LT bearish pattern, recent mkt RS sell signal, Earn. 4/10/18 |
| Stock | Symbol | Sector | Current Price | Action Price | Target | Stop | Notes |
|---|---|---|---|---|---|---|---|
| Acuity Brands, Inc. | AYI | Building | $124.68 | (124 - 138) | 108 | 156 | AYI has moved below our ideal action range. OK to hold here. Abide by $156 buy-stop. |
| Comment |
|---|
| PFPT Proofpoint Inc R ($117.14) - Software - We will now raise our stop loss to $98, the point at which PFPT would violate its trend line on its default chart. |
PBH Prestige Brand Holdings, Inc. R ($31.09) - Drugs - PBH is a 0 for 5'er that ranks 49 of 51 in the unfavored Drugs sector matrix. The stock has given four consecutive sell signals since October of last year, most recently breaking breaking a double bottom on 4/12/18. PBH also went on an RS sell signal vs SPXEWI in February, demonstrating long-term negative divergence. PBH is actionable in the $30 - $33 range and we use $37, the first buy signal on PBH's default chart as our initial buy-stop. We will use the bearish price objective - $28 - as our near-term price target.
| 14 | 15 | 16 | 17 | 18 | |||||||||||||||||||||||||||||||||||||||||||||||||
| 59.00 | 4 | • | 59.00 | ||||||||||||||||||||||||||||||||||||||||||||||||||
| 58.00 | 5 | 3 | O | • | 58.00 | ||||||||||||||||||||||||||||||||||||||||||||||||
| 57.00 | X | O | X | X | O | • | 57.00 | ||||||||||||||||||||||||||||||||||||||||||||||
| 56.00 | X | O | 7 | O | X | O | • | 56.00 | |||||||||||||||||||||||||||||||||||||||||||||
| 55.00 | X | O | X | O | X | 5 | • | 55.00 | |||||||||||||||||||||||||||||||||||||||||||||
| 54.00 | X | 4 | O | X | O | 2 | O | • | 54.00 | ||||||||||||||||||||||||||||||||||||||||||||
| 53.00 | X | O | X | X | X | 6 | X | 8 | 1 | O | 6 | • | 53.00 | ||||||||||||||||||||||||||||||||||||||||
| 52.00 | X | O | C | O | 3 | O | X | O | O | X | O | X | O | • | 52.00 | ||||||||||||||||||||||||||||||||||||||
| 51.00 | X | X | O | X | O | X | X | O | X | O | X | X | O | X | O | • | 51.00 | ||||||||||||||||||||||||||||||||||||
| 50.00 | X | O | X | X | O | X | 1 | X | O | X | O | O | X | X | O | X | O | X | 9 | 50.00 | |||||||||||||||||||||||||||||||||
| 49.00 | 8 | O | X | X | O | X | O | O | X | O | X | O | X | O | X | O | X | O | O | 49.00 | |||||||||||||||||||||||||||||||||
| 48.00 | 7 | O | X | O | X | O | X | O | X | X | O | X | O | X | O | X | O | X | A | X | 48.00 | ||||||||||||||||||||||||||||||||
| 47.00 | X | O | 9 | O | A | B | O | X | O | X | O | O | 9 | X | C | • | O | C | O | 47.00 | |||||||||||||||||||||||||||||||||
| 46.00 | 6 | O | X | O | X | O | X | O | X | A | X | • | O | X | O | 46.00 | |||||||||||||||||||||||||||||||||||||
| 45.00 | X | X | O | X | O | X | O | 2 | X | B | • | B | X | O | 45.00 | ||||||||||||||||||||||||||||||||||||||
| 44.00 | 4 | O | X | O | X | O | O | • | O | X | 1 | 44.00 | |||||||||||||||||||||||||||||||||||||||||
| 43.00 | X | O | 5 | O | • | O | X | O | 43.00 | ||||||||||||||||||||||||||||||||||||||||||||
| 42.00 | X | O | X | • | O | X | O | 42.00 | |||||||||||||||||||||||||||||||||||||||||||||
| 41.00 | 3 | O | X | • | O | 2 | 41.00 | ||||||||||||||||||||||||||||||||||||||||||||||
| 40.00 | X | O | • | O | Top | 40.00 | |||||||||||||||||||||||||||||||||||||||||||||||
| 39.00 | X | • | O | X | 39.00 | ||||||||||||||||||||||||||||||||||||||||||||||||
| 38.00 | X | X | • | O | X | O | 38.00 | ||||||||||||||||||||||||||||||||||||||||||||||
| 37.00 | B | O | 1 | 2 | • | O | X | O | 3 | 37.00 | |||||||||||||||||||||||||||||||||||||||||||
| 36.00 | C | X | O | X | O | X | • | O | O | X | O | 36.00 | |||||||||||||||||||||||||||||||||||||||||
| 35.00 | X | X | O | 6 | X | X | O | C | O | X | • | O | X | O | 35.00 | ||||||||||||||||||||||||||||||||||||||
| 34.00 | O | X | O | X | O | 5 | O | 8 | O | X | O | X | O | • | O | X | O | Med | 34.00 | ||||||||||||||||||||||||||||||||||
| 33.00 | O | X | O | B | 1 | X | O | X | O | X | O | X | • | O | O | 33.00 | |||||||||||||||||||||||||||||||||||||
| 32.00 | O | X | 8 | X | O | X | 7 | X | 9 | X | O | X | • | 4 | 32.00 | ||||||||||||||||||||||||||||||||||||||
| 31.00 | O | 7 | 9 | X | O | X | O | A | O | • | O | 31.00 | |||||||||||||||||||||||||||||||||||||||||
| 30.00 | O | X | O | O | X | X | • | 30.00 | |||||||||||||||||||||||||||||||||||||||||||||
| 29.00 | O | X | 2 | 3 | O | X | • | 29.00 | |||||||||||||||||||||||||||||||||||||||||||||
| 28.00 | 6 | O | X | O | X | • | Bot | 28.00 | |||||||||||||||||||||||||||||||||||||||||||||
| 27.00 | O | X | O | X | • | 27.00 | |||||||||||||||||||||||||||||||||||||||||||||||
| 26.00 | O | X | 4 | • | 26.00 | ||||||||||||||||||||||||||||||||||||||||||||||||
| 25.00 | O | • | 25.00 | ||||||||||||||||||||||||||||||||||||||||||||||||||
| 14 | 15 | 16 | 17 | 18 |
| Comments |
|---|
| B Barnes Group Inc ($55.90) - Machinery and Tools - After a negative earnings release, Barnes Group broke a spread quadruple bottom at $57 and then proceeded to violate its bullish support line by falling further to $56 intraday. The stock will lose an attribute as a result and begin trading in a negative trend. Those long should look to exit positions here or on a reversal up into X's and avoid Barnes Group moving forward. |
| BDC Belden, Inc. ($63.70) - Electronics - BDC broke a triple bottom at $64 with the most recent action, marking a new 52 week low on the chart. This stock is an unacceptable 1 for 5’er that is trading well below the bearish resistance line. Additionally, this is the second consecutive sell signal on the chart, confirming that supply is in control. Monthly momentum has also been negative for three months, suggesting the potential for lower prices. Avoid. From here, final support lies at $61, the November 2017 bottom. Earnings are expected 5/2. |
| BIDU Baidu, Inc. (China) ADR ($252.21) - Internet - BIDU broke a double top at $244 after bouncing off its bullish support line. Those long may continue to hold. No new positions here until the stock can exceed overhead resistance in the lower $270s. Those long may implement a trend violation as a stop loss. |
| BUD Anheuser-Busch InBev NV (Belgium) ADR ($100.09) - Food Beverages/Soap - BUD broke a second consecutive double bottom on the chart at $100. This stock is an unacceptable 0 for 5’er that has been trading in a negative trend since October 2016. Weekly momentum has been negative for three weeks, suggesting the potential for lower prices. Overall, supply is in control and the technical picture is negative. Avoid. Final support lies at $99, the December 2016 low. |
| COLM Columbia Sportswear Company ($85.07) - Textiles/Apparel - COLM broke a double top at $84 and continued higher intraday to $87, a new high. This breakout is also notable because it completes a bullish catapult formation following the spread triple top break earlier in the month at $80. New positions are best served on a pullback from here since the stock trades at the top of its trading band. Support is at $79. |
| DRQ Dril-Quip ($41.28) - Oil Service - DRQ, a weak 1 for 5’er within the Oil Service sector, broke a triple bottom at $42 and fell lower to $39. This stock is trading in a negative trend and recently saw its weekly momentum flip negative. Additionally, DRQ has maintained a market RS sell signal for nearly four years. The technical weight of the evidence is negative. Avoid. |
| EHC Encompass Health Corp. ($61.95) - Healthcare - EHC broke a double top at $60, the stocks fifth consecutive buy signal and new high. The 3 for 5'er also ranks in the top third of the favored Healthcare sector matrix. New positions may be initiated on a pullback since the stock is approaching overbought territory. Support is offered at $56 and $53 from here. |
| FIX Comfort Systems U.S.A. ($43.43) - Building - Shares of FIX moved higher to $48 after a positive reaction to earnings on Friday, breaking a spread triple top at $45 along the way. This stock is a strong 4 for 5’er that has maintained a positive trend for nearly four years. Weekly momentum recently flipped positive, suggesting the potential for higher prices. Additionally, FIX has a price target of $69, adding to the positive technical picture. Okay to hold here or buy on a pullback as FIX is in overbought territory at this time. From here, significant support lies at $40, while the bullish support line lies at $38. |
| FSLR First Solar, Inc. ($79.15) - Semiconductors - FSLR broke a double top at $79 and continued higher intraday to $81, a new multi-year high and completion of a bullish catapult formation following the shakeout completed earlier this month at $75. New positions in the 4 for 5'er may be initiated at current levels or in the mid $70s from here. Support is visible at $72. |
| MATW Matthews International Corp ($48.03) - Business Products - MATW broke a double bottom at $48, completing a bearish catapult pattern on the chart. MATW does not have any positive trending or RS characteristics in its favor at this time, making it a weak 0 for 5’er. At this time, MATW ranks 95th out of 101 names in the Business Products sector, confirming its weakness. Avoid as supply is in control and the technical picture is weak. Final support lies at $45. |
| Name | Option Symbol | Action | Stop Loss |
|---|---|---|---|
| MSCI Inc. - $150.14 | O:MSCI 18F140.00D15 | Buy the June 140.00 calls at 12.60 | 140.00 |
| Name | Option | Action |
|---|---|---|
| Chevron Corporation ( CVX) | Jun. 115.00 Calls | Raise the option stop loss to 9.80 (CP: 11.80) |
| E*trade Group, Inc. ( ETFC) | Jul. 50.00 Calls | Raise the option stop loss to 9.60 (CP: 11.60) |
| The Charles Schwab Corporation ( SCHW) | Sep. 50.00 Calls | Raise the option stop loss to 5.70 (CP: 7.70) |
| Halliburton Company ( HAL) | Oct. 45.00 Calls | Raise the option stop loss to 6.95 (CP: 8.95) |
| V.F. Corporation ( VFC) | Aug. 72.50 Calls | Raise the option stop loss to 7.60 (CP: 9.60) |
| The TJX Companies, Inc. ( TJX) | Jul. 75.00 Calls | Raise the stock price stop loss to 79.00 (CP: 86.29) |
| UnitedHealth Group Incorporated ( UNH) | Jun. 220.00 Calls | Raise the option stop loss to 18.85 (CP: 20.85) |
| Name | Option Symbol | Action | Stop Loss |
|---|---|---|---|
| Delta Air Lines Inc. - $53.48 | O:DAL 18S57.50D20 | Buy the July 57.50 puts at 5.15 | 58.00 |
| Name | Option | Action |
|---|---|---|
| Expedia Group Inc. (EXPE) | Jul. 115.00 Puts | Stopped at 116.00 (CP: 115.00) |
| Acuity Brands, Inc. (AYI) | Aug. 135.00 Puts | Raise the option stop loss to 14.00 (CP: 16.00) |
| Nordstrom, Inc. (JWN) | Jul. 52.50 Puts | Stopped at 51.00 (CP: 51.20) |
| Name | Option Sym. | Call to Sell | Call Price | Investment for 500 Shares | Annual Called Rtn. | Annual Static Rtn. | Downside Protection |
|---|---|---|---|---|---|---|---|
| NetApp, Inc. $67.46 | O:NTAP 18I70.00D21 | Sep. 70.00 | 67.47 | $32,018.10 | 20.51% | 13.31% | 5.09% |
| Name | Action |
|---|---|
| Avis Budget Group, Inc. (CAR) - 48.56 | Sell the August 52.50 Calls. |
| Deckers Outdoor Corporation (DECK) - 92.06 | Sell the September 97.50 Calls. |
| Take-Two Interactive Software, Inc. (TTWO) - 99.19 | Sell the September 100.00 Calls. |
| Lam Research Corporation (LRCX) - 190.40 | Sell the August 195.00 Calls. |
| Name | Covered Write |
|---|---|
| First Solar, Inc. ( FSLR - 75.08 ) | September 75.00 covered write. |
| First Solar, Inc. ( FSLR - 75.08 ) | September 75.50 covered write. |
| Alcoa Inc. ( AA - 52.94 ) | October 60.00 covered write. |
Daily Equity & Market Analysis
Loading, Please Wait...

Create Portfolio