What is ESG? Today we look into socially-responsible investing trends and examine the holdings of the iShares MSCI ESG Select ETF (SUSA) while offering actionable ideas.
ESG. No, it’s not another CUSIP to add to your watch lists, but an important acronym that we think advisors should become familiar with. ESG stands for Environment, Social, and Governance. Why does this matter? According to the 2016 Global Survey of Individual Investors by Natixis Global Asset Management, almost 70% of investors think it’s important to invest in companies with a positive social impact. In fact, according to US News, "twenty-eight percent of millennials said they were "very interested" in sustainable investing compared to just 19 percent of the overall population. Two years later, in 2017, Morgan Stanley took the numbers again. This time, 86 percent of millennials were interested in sustainable investing, including 38 percent who were "very interested." (Source: US News)
So what is ESG? ESG refers to an investment strategy that promotes causes around human rights, consumer protection, and environmental contributions, just to name a few. Socially responsible investing typically includes the avoidance of companies that are involved with "unethical" products or practices such as alcohol or alcohol production, gambling, and tobacco. As seen in the image below (source: MSCI ESG Research), ESG has a wide range of practices that it evaluates from climate change, to labor standards, pay, and natural capital. ESG names typically come from consumer-consious sectors like Technology, Consumer Cyclical, and Healthcare, while avoiding sub-sectors such as defense names, gun stocks, and tobacco companies.
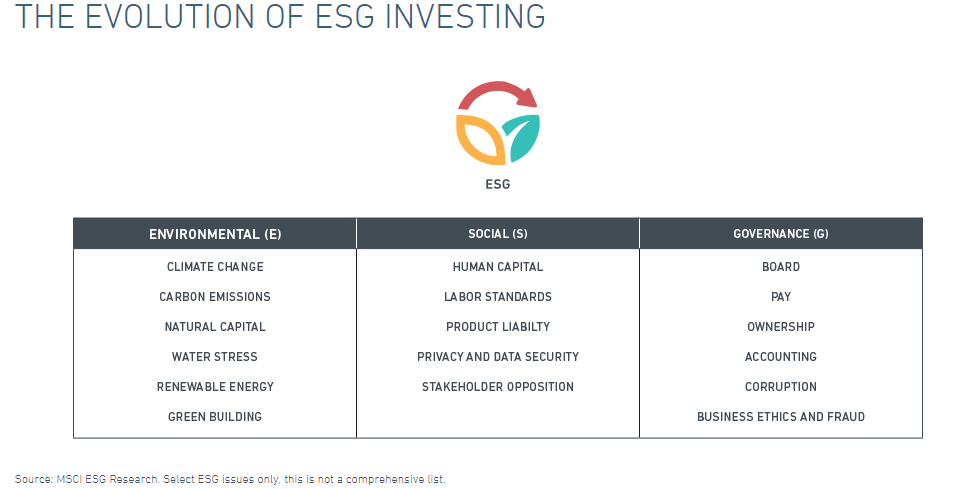
(Image Source: MSCI ESG Research)
ESG Research and Info:
- Assets - "According to the Global Sustainable Investment Review 2016(hereafter GSIR, 2016), which reported the results of market studies performed by members of the Global Sustainable Investment Alliance (GSIA),2 US$22.9 trillion of assets were being professionally managed at the start of 2016 under SRI strategies, 26% of total global assets under professional management. Since 2014, when the GSIA last reported this number, these assets have grown 25%, from US$18.3 trillion." (Source: ETF.com)
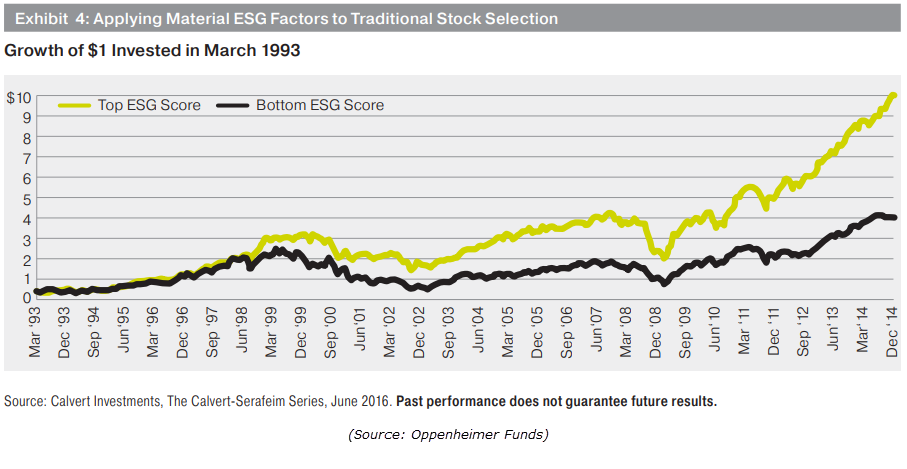
- Opportunity - In the chart below, you can see the opportunity that exsists in the ESG space. Based on a study by Calvert Investments found in an Oppenheimer Research piece titled, Understanding ESG Investing, stocks with high ESG ratings are more likely to perform better than companies with low ESG ratings. According to the study, "The green line represents the companies who rank among the top 10% for ESG factors deemed material for each company’s industry and the black line represents the companies who rank among the bottom 10% for their industry’s relevant ESG factors." (Source: Oppenheimer Funds)
- Social Responsibility Fund Group - For those looking to track the ESG category on the Dorsey Wright system, use the Social Responsibility fund group available in TeamBuilder and Asset Class Group Scores. The group is comprised of funds from the ESG and social responsibility category. Currently, the average fund score of Social Responsibility fund is around 3.35.
- For more research, explore these different papers and posts on ESG Investing:
- What is ESG investing? - Invesco
- Finding Alpha in ESG - Credit Suisse
- Understanding ESG Investing: Answers to advisors' and investors' most pressing questions about ESG - Oppenheimer Funds
- Assessing Risk through Environmental, Social and Governance Exposures - AQR
- ESG Indexes Factsheet - MSCI
ESG Opportunity:
Over the past few weeks, we’ve witnessed many non-socially responsible sectors start to break down (think guns, tobacco, defense), which brought our attention back to this growing space. After doing some digging, we found that there are about 50+ ESG ETFs that are trading in the US. So how can investors actually go about exposure to this growing area of the market? Using the DWA system, we were able to identify an attractive ESG-related fund, review the fund’s technical health, and screen the holdings for individual ideas, all of which you will find below.
One socially responsible fund that we came across is the iShares MSCI ESG Select ETF SUSA. SUSA offers investors the ability to participate in this area of the market as the fund, “seeks to track the investment results of an index composed of U.S. companies that have positive environmental, social and governance characteristics as identified by the index provider.” (ishares.com) Comprised of 101 companies, SUSA has managed to come across our radar for its triangle formation and the fact that many of its holdings have come across our technical screens. Additionally, SUSA has a solid fund score above the 3-threshold. Of course, you can take a diversified approach and consider SUSA on its own, or you can consider buying some of SUSA’s holdings, giving you a more focused take on this area of the market. Before we examine SUSA for individual ideas, let’s take a look at its holdings using three tools on the DWA research platform - ETF holdings, Portfolio breakdown, and the RS matrix.
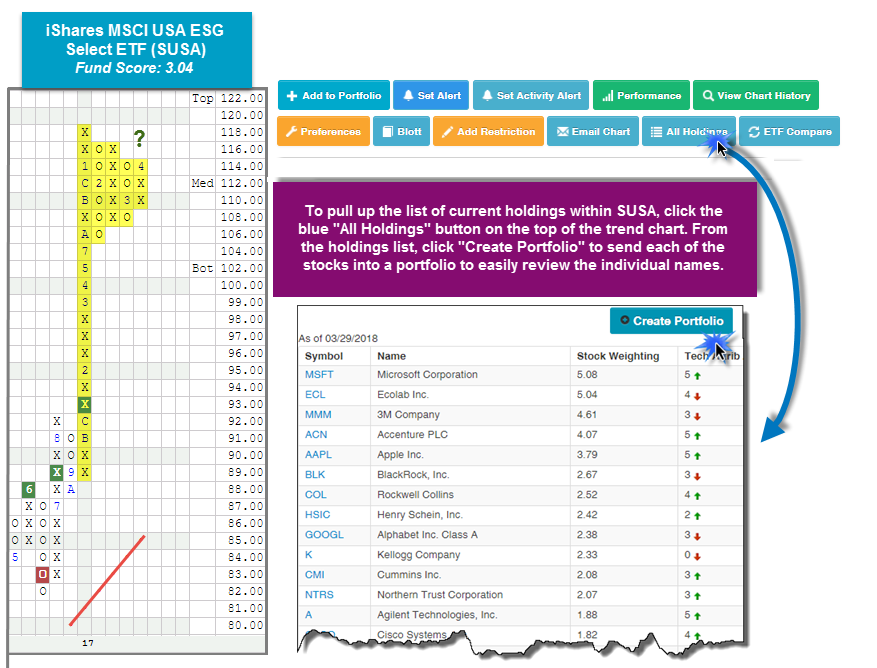
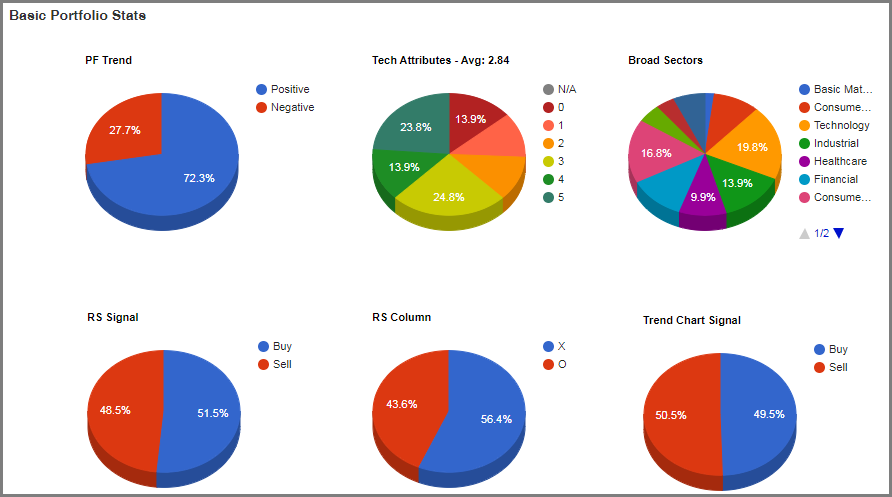
To begin our review of the fund's holdings, we first need to add the individual stocks to a portfolio. Directly off of the trend chart, simply click the blue “All Holdings” button. This populates a list of the current holdings. From here, click the “Create Portfolio” button. You have now created a portfolio of all of the holdings within the fund and we can now begin our analysis. From the portfolio, simply click the “Evaluation” tab to generate the pie charts in the image below. Generally speaking, SUSA offers a fairly healthy, technically sound portfolio. In total, roughly 51.5% of the portfolio is on a Market RS Buy Signal and 56.40% are in Xs versus the Market, as well. Additionally, 72% of the stocks are trading in an overall positive trend and 62.5% have technical attribute readings of 3 or higher. From a sector perspective, SUSA has an overweight to the strongest RS sectors with a 20% overweight to the Technology sector, followed by a 17% weighing to the Consumer Cyclical sector.
ESG Leadership
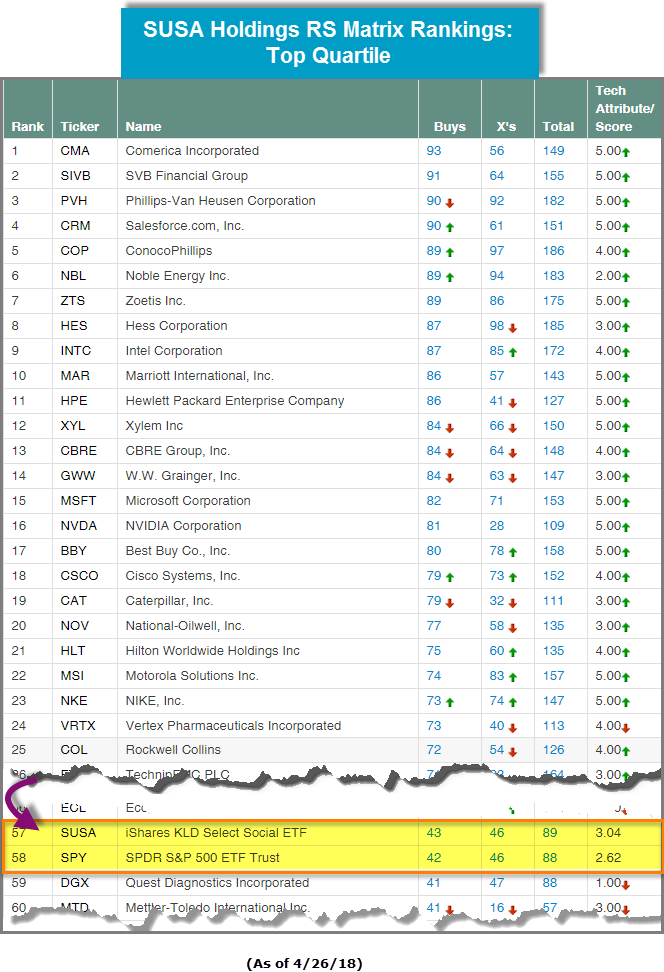
An efficient way to find the leaders within the ESG space is to run the current SUSA holdings through a relative strength Matrix screening. This will compare each of the holdings on a relative strength basis to one another. From the portfolio created earlier, click on “Portfolio Actions” and “Create Matrix”. Note that the matrix tool is able to compare 100 tickers at a time, so for today’s example we’ve weeded out Campbell Soup Company CPB, the Procter & Gamble Company PG, and General Mills GIS from the list due to their extreme technical weakness. Once the RS Matrix has been calculated and ranked, you are left with an objective ranking of SUSA’s stocks, ordered by their respective relative strength. In the image below, we have provided you with a ranking of SUSA’s holdings, along with two benchmarks, the SUSA itself and the broader market (SPY), which are both highlighted in yellow. At the top of the matrix, you are provided with the elite ESG names, at least from a relative strength standpoint while the stocks at the bottom of the matrix have experienced some sort of technical breach, causing them to rank low on a relative strength basis.
Individual ESG Ideas
Focusing on the top quartile of the matrix, we find CRM. CRM’s long term trend of outperformance has pushed it up to the fourth position on the SUSA matrix. In addition to its high ranking, it has all 5 technical attributes in its favor, speaking to its long and short term strength versus the market and its peers. Looking to the trend chart below, notice how CRM has given six consecutive buy signals since June 2017, confirming that demand is in control. Additionally, we see that with recent action, CRM has formed a triangle pattern on the chart after a period of consolidation over the past month. With yesterday’s (4/26) market action, CRM reversed up into Xs at $122 and is now two boxes away from completing a bullish triangle pattern on the chart.
While CRM has maintained a market RS buy signal since 2013, CSCO, ranked in 18th place on the matrix and well above SUSA, recently experienced a notable market RS buy signal for the first time since moving to a sell signal on August 31st, 2010. CSCO has maintained a positive trend since September 2012 and has given three consecutive buy signals since July 2016. CSCO, which "designs, manufactures, and sells Internet Protocol (IP) based networking and other products related to the communications and information technology industry worldwide" (source: Yahoo Finance), is rated a 4 for 5'er and with today’s (4/27) intraday action, printed another X at $45, sitting just two boxes away from a buy signal as well as a new 18-year high. At this time, both CRM and CSCO are trading in the middle of their trading bands with OBOS% readings of +9%, and +8%, respectively. Given these levels, these two positions are actionable here. CRM has support between the $112 and $116 levels, while the long-term trend line can be found at $96. Support for CSCO can be found at $41, followed by $38.

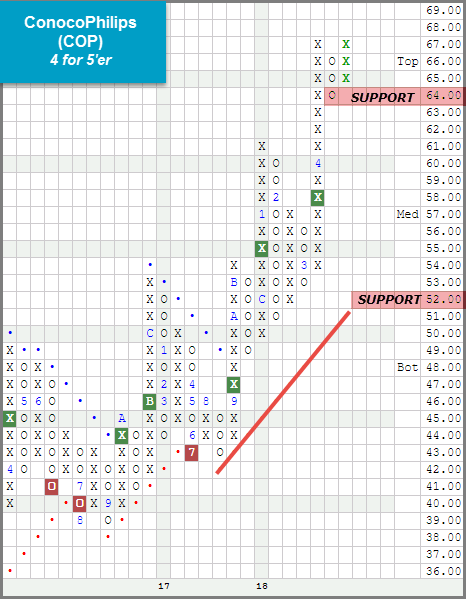
Another attractive ESG name from the top quartile of the matrix above is COP. COP, which ranks fifth, is a strong 4 for 5’er within the favored Oil sector. As seen on the chart below, COP completed a bullish triangle pattern in March after a period of consolidation which was then followed by a strong rally to $67. Earlier this month, COP exhaled slightly to $64 and, with yesterday’s (4/26) action, reversed up into Xs where it has formed a double top at $67. From here, a move to $68 would complete a fourth consecutive buy signal and mark a new multi-year high. At this juncture, COP is 104% overbought so those looking to initiate new positions would best be served on a pullback to the lower $60's. Support for COP lies at $64, while the bullish support line is at $52.
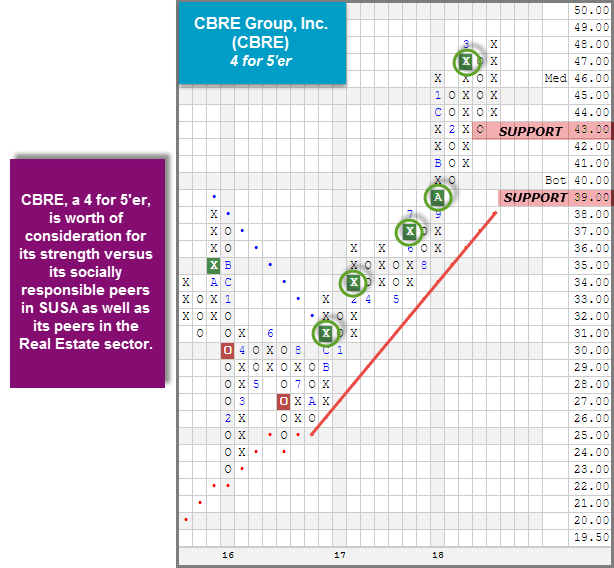
Similar to COP, CBRE is a 4 for 5’er that ranks in the top quartile of the SUSA matrix (13th). In December 2016, CBRE experienced a positive trend change and has given five consecutive buy signals since as demand has remained in control. CBRE offers a healthy technical picture and is currently just one box away from a new all-time high on the chart. CBRE is worthy of consideration for its strength versus its socially responsible peers in SUSA as well as its peers in the Real Estate sector, which is Unfavored. For those looking to initiate new positions, CBRE has an OBOS% reading of -23%, so you may look to scale in current levels. The first sign of trouble from here would occur at $42, a double bottom sell signal, while a move to $38 would violate the long term trend line.