
Most Requested Symbols


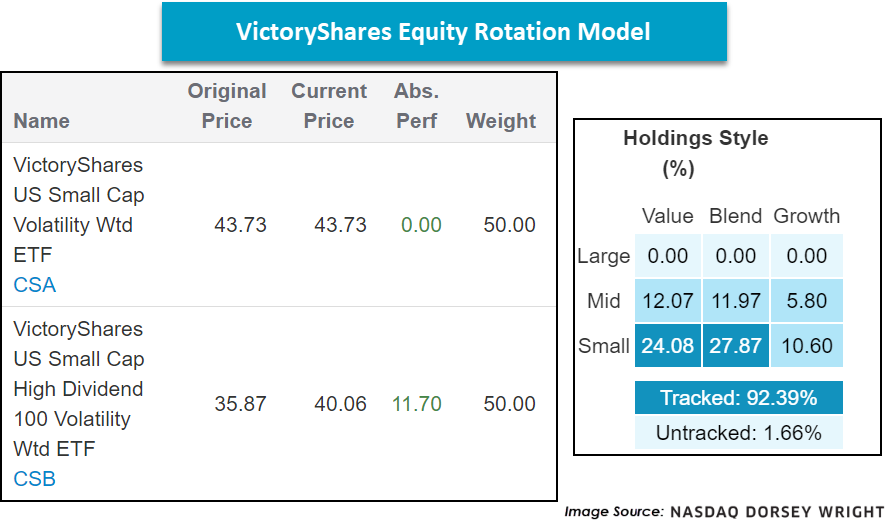
Beginning with the VictoryShares (VS) Equity Rotation Model, the strategy sold the VictoryShares Dividend Accelerator ETF VSDA because it fell out of the top two positions in the model’s relative strength matrix and purchased the VictoryShares US Small Cap Volatility Wtd ETF CSA as it was the next highest ranking fund not currently in the model. We observe a notable tailwind behind small cap equities, present in CSA as well given its acceptable fund score of 3.20 and strongly positive score direction of 2.70. The VS Equity Rotation Model maintains a heavily tilt toward domestic equities yet leans toward small cap value and small cap blend exposure. This marks the model’s fifth trade this year.
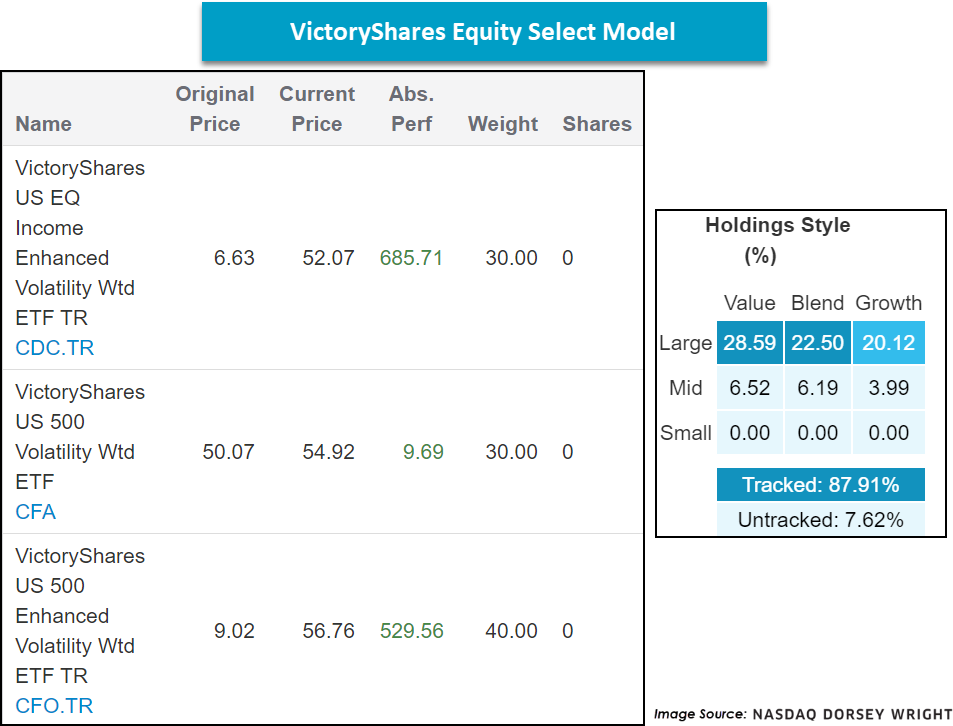
As for the VictoryShares Equity Select Model, we also note a change as the VictoryShares US EQ Income Enhanced Volatility Wtd ETF CDC.TR fell out of the number one ranked position in the matrix, causing it to lose its 40% overweight. As a result, the VictoryShares US 500 Enhanced Volatility Wtd ETF CFO now carries the 40% overweight, with the other two funds each carrying a weighting of 30%. Like the VS Equity Rotation Model, the VS Equity Select Model also maintains a heavy overweight to domestic equities but instead leans toward the large cap space. This is only the second month this year that ushered changes for this strategy.

This weekly overview is designed to be used as a "radar" screen to bring your attention to potentially important technical changes that may require your attention and potential action. When evaluating the Fund Score, the strongest issues have scores of 4 or higher while those ETFs with scores below a 3 are no longer considered solid citizens.
Symbol
Name
Price
Fund Score
PnF Signal
RS Col.
PnF Trend
Weekly Mom
CDC
VictoryShares US EQ Income Enhanced Volatility Wtd ETF
48.33
4.56
Sell
O
Negative
+4W
CDL
VictoryShares US Large Cap High Div Vol Wtd ETF
41.41
2.94
Buy
O
Positive
+4W
CEY
VictoryShares Emerging Market High Dividend Volatility Wtd ETF
18.56
0.23
Buy
O
Positive
+3W
CEZ
VictoryShares Emerging Market Volatility Wtd ETF
22.65
0.96
Buy
O
Positive
-13W
CFA
VictoryShares US 500 Volatility Wtd ETF
54.92
3.27
Buy
O
Positive
-1W
CFO
VictoryShares US 500 Enhanced Volatility Wtd ETF
54.95
4.64
Buy
O
Positive
-1W
CID
VictoryShares International High Div Volatility Wtd ETF
25.27
0.37
Buy
O
Negative
-9W
CIL
VictoryShares International Volatility Wtd ETF
35.69
2.01
Buy
O
Positive
-10W
CIZ
VictoryShares Developed Enhanced Volatility Wtd ETF
26.95
0.90
Buy
O
Negative
-8W
CSA
VictoryShares US Small Cap Volatility Wtd ETF
43.73
3.21
Buy
O
Positive
+4W
CSB
VictoryShares US Small Cap High Dividend 100 Volatility Wtd ETF
40.06
3.20
Buy
O
Positive
+4W
CSF
VictoryShares US Discovery Enhanced Volatility Wtd ETF
41.81
3.76
Buy
X
Positive
+4W
UEVM
VictoryShares USAA MSCI Emerging Markets Value Momentum ETF
39.48
2.22
Buy
O
Positive
+4W
UITB
VictoryShares USAA Core Intermediate-Term Bond ETF
53.93
3.89
Buy
O
Positive
-13W
UIVM
VictoryShares USAA MSCI International Value Momentum ETF
39.60
2.26
Sell
O
Positive
-9W
ULVM
VictoryShares USAA MSCI USA Value Momentum ETF
48.60
2.92
Buy
O
Positive
-2W
USTB
VictoryShares USAA Core Short-Term Bond ETF
51.77
4.10
O
-18W
USVM
VictoryShares USAA MSCI USA Small Cap Value Momentum ETF
50.03
3.87
Buy
O
Positive
-1W
VSDA
VictoryShares Dividend Accelerator ETF
36.10
4.58
Buy
X
Positive
-2W
VSMV
VictoryShares US Multi-Factor Minimum Volatility ETF
31.11
3.25
Sell
O
Positive
-2W
This section of the report categorizes all of the Victory Mutual Funds by their respective broad group. Along with each group, you can view the Average Group Score, which is an average of the scores of all funds represented in that particular group. Those Victory Mutual Funds that meet or exceed the Average Group Score will be highlighted in green in order to easily view those Victory Mutual Funds that have superior strength within their respective group. You want to focus on those Victory Mutual Funds that exhibit superior strength when looking to add new exposure to a particular group.
| Small Cap Funds | Symbol | Name | Score |
|---|---|---|---|
| Average Group Score: 3.8 | RSEGX | Victory RS Small Cap Growth A | 5.72 |
| GPSCX | Victory RS Small Cap Equity A | 5.34 | |
| SSGSX | Victory Sycamore Small Company Opp A | 4.03 | |
| VSCVX | Victory Integrity Small-Cap Value A | 3.05 |
| Large Cap Funds | Symbol | Name | Score |
|---|---|---|---|
| Average Group Score: 3.8 | VFGAX | Victory NewBridge Large Cap Growth A | 5.48 |
| CUHCX | Victory US 500 Enhanced Volatility Wtd Index Fund | 4.62 | |
| MUXYX | Victory S&P 500 Index Y | 4.21 | |
| SSVSX | Victory Special Value A | 4.01 | |
| SRVEX | Victory Diversified Stock A | 3.98 | |
| VBFGX | Victory Strategic Allocation R | 3.03 |
| Global Funds | Symbol | Name | Score |
|---|---|---|---|
| Average Group Score: 3.5 | MAEMX | Victory Trivalent Emerging Mkts Sm-Cp A | 5.21 |
| MISAX | Victory Trivalent International Sm-Cp A | 4.05 | |
| MAICX | Victory Trivalent Intl Fd-Core Eq A | 2.46 |
| Mid Cap Funds | Symbol | Name | Score |
|---|---|---|---|
| Average Group Score: 3.5 | GETGX | Victory Sycamore Established Value R | 5.25 |
| MGOYX | Victory Munder Mid-Cap Core Growth Y | 3.81 | |
| MAIMX | Victory Integrity Mid-Cap Value A | 3.22 | |
| MAISX | Victory Integrity Small/Mid-Cap Value A | 3.10 |
| Sector Funds | Symbol | Name | Score |
|---|---|---|---|
| Average Group Score: 3.2 | RSIFX | Victory RS Science and Technology A | 5.67 |
| MNNAX | Victory Munder Multi-Cap A | 4.72 | |
| RSNRX | Victory Global Natural Resources A | 4.54 |

The distribution curve places each ETF on a bell curve according to their respective degrees of overbought or oversold status using a 10-week distribution. ETFs that are statistically oversold will appear on the left-hand side of the bell curve, while those that have become statistically overbought will appear on the right-hand side of the bell curve. Perhaps the most useful attribute of this feature is that it displays the entire universe on the curve at one time to give us a general picture of whether the Victory ETF universe is generally overbought on a near-term basis, or generally oversold. Our best opportunities are to buy strong relative strength ETFs that have regressed back toward mean conditions based on market weakness, or have become oversold based upon extreme market weakness. Weekly Distribution is a short-term gauge that is most helpful in timing entry and exit points, while the longer-term information of trend and relative strength is a more controlling factor in the decision of whether to buy or sell.
Average Level
-30.15
VictoryShares ETF Models
The VictoryShares ETF Models are designed to identify major themes in the US equity marketplace through the use of the Point & Figure relative strength tools. For more information on the portfolio construction and backtesting, see the model info file on the models page.
Weekly Changes:
| ETF Name | Symbol | DWA Suggested Weighting | Yield | Date Added |
|---|---|---|---|---|
| VictoryShares US Small Cap Volatility Wtd ETF TR | CSA.TR | 50.000% | 1.5683 | 11/02/2020 |
| VictoryShares US Small Cap High Dividend 100 Volatility Wtd ETF TR | CSB.TR | 50.000% | 4.4815 | 06/01/2020 |
* Dates prior to 09/04/2018, which is when the VictoryShares Rotation Model became available on the Dorsey Wright Research Platform are representative of when the position was added to the backtested model
| ETF Name | Symbol | DWA Suggested Weighting | Yield | Date Added |
|---|---|---|---|---|
| VictoryShares US EQ Income Enhanced Volatility Wtd ETF TR | CDC.TR | 30.000% | 2.8269 | 11/30/2009 |
| VictoryShares US 500 Volatility Wtd ETF TR | CFA.TR | 30.000% | 1.4092 | 03/04/2019 |
| VictoryShares US 500 Enhanced Volatility Wtd ETF TR | CFO.TR | 40.000% | 1.0494 | 11/30/2009 |
* Dates prior to 09/04/2018, which is when the VictoryShares Select Model became available on the Dorsey Wright Research Platform are representative of when the position was added to the backtested model.
VictoryShares Report (Tues.)
Loading, Please Wait...
