
Most Requested Symbols


Although rates have risen recently, they continue to trade at historically low levels, making it difficult for investors to generate income through traditional sources like fixed income. Said differently, with the 10-Year US Treasury Yield Index (TNX) hovering around 1.175%, the current environment is not one that is particularly favorable to investors with a requirement for steady income. As a result, we can look to equity market products like the US EQ Income Enhanced Volatility Wtd ETF (CDC) and US Small Cap High Dividend 100 Volatility Wtd ETF (CSB), each from VictoryShares.
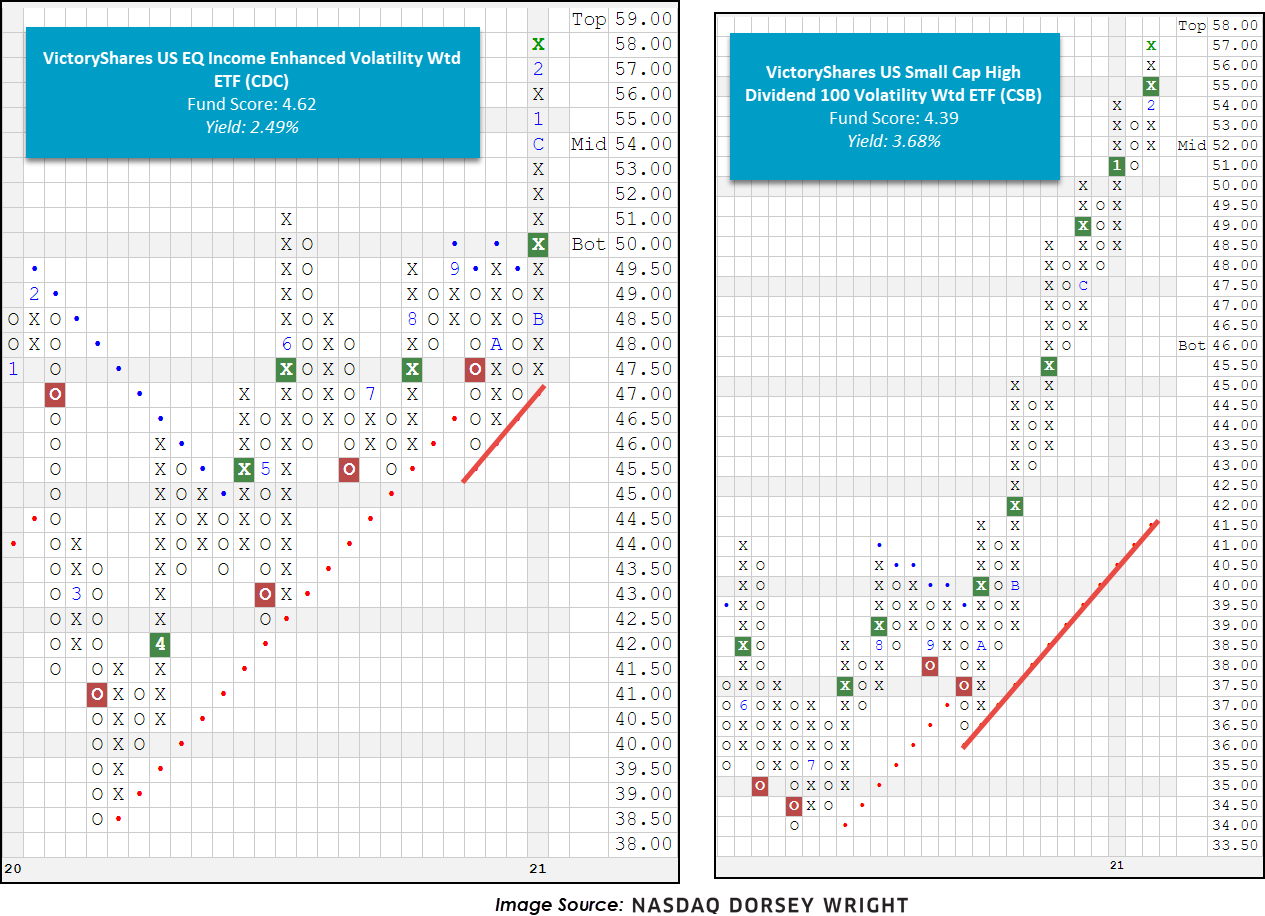
CDC seeks to provide income, along with capital appreciation and preservation, by investing in the highest 100 dividend-yielding stocks in the Nasdaq Victory US Large Cap 500 Volatility Weighted Index. To be included in the index, companies must clear profitability hurdles and meet certain market capitalization requirements but once constructed, the index weights stocks based on their respective risk/volatility. CDC also employs a tactical cash-raising strategy, further outlined here. From a technical perspective, CDC appears favorable with an optimal fund score of 4.62, a strong score direction of 1.39, and a recent flip to positive weekly momentum. In addition, CDC trades on a Point and Figure buy signal and printed a fresh all-time high yesterday (2/22) at $58. The weight of the evidence is positive yet those looking to add new exposure may consider entering on a pullback or dollar-cost-averaging in at current levels as the stock is nearing the top of its trading band. Note initial support is not offered until $47. CDC currently offers a yield of 2.5%.
As for CSB, it employs a very similar index construction and weighting schema to CDC but instead primarily allocates to small cap securities. That said, with the increasing demand for smaller sizes across the capital markets, CSB offers a way to generate income while still allocating toward areas of highest relative strength. Like CDC, CSB carries a stellar fund score of 4.39 and a positive score direction of 2.30 but is also nearing overbought territory as it printed a fresh all-time high yesterday (2/22). Those looking to build new positions here may wish to enter on a pullback or dollar-cost-averaging at current levels. Initial support is offered around $51. CSB currently offers a yield of 3.68%.

This weekly overview is designed to be used as a "radar" screen to bring your attention to potentially important technical changes that may require your attention and potential action. When evaluating the Fund Score, the strongest issues have scores of 4 or higher while those ETFs with scores below a 3 are no longer considered solid citizens.
Symbol
Name
Price
Fund Score
PnF Signal
RS Col.
PnF Trend
Weekly Mom
CDC
VictoryShares US EQ Income Enhanced Volatility Wtd ETF
57.93
4.62
Buy
O
Positive
+1W
CDL
VictoryShares US Large Cap High Div Vol Wtd ETF
50.78
2.92
Buy
O
Positive
+1W
CEY
VictoryShares Emerging Market High Dividend Volatility Wtd ETF
23.31
2.92
Buy
O
Positive
-9W
CEZ
VictoryShares Emerging Market Volatility Wtd ETF
28.01
3.08
Buy
O
Positive
-3W
CFA
VictoryShares US 500 Volatility Wtd ETF
64.64
3.07
Buy
O
Positive
-9W
CFO
VictoryShares US 500 Enhanced Volatility Wtd ETF
64.70
4.40
Buy
O
Positive
-9W
CID
VictoryShares International High Div Volatility Wtd ETF
31.12
2.77
Buy
O
Positive
-10W
CIL
VictoryShares International Volatility Wtd ETF
42.63
2.95
Buy
O
Positive
-10W
CIZ
VictoryShares Developed Enhanced Volatility Wtd ETF
32.34
2.42
Buy
O
Positive
-10W
CSA
VictoryShares US Small Cap Volatility Wtd ETF
61.71
4.43
Buy
X
Positive
-6W
CSB
VictoryShares US Small Cap High Dividend 100 Volatility Wtd ETF
56.98
4.39
Buy
X
Positive
-9W
CSF
VictoryShares US Discovery Enhanced Volatility Wtd ETF
57.55
4.75
Buy
X
Positive
-5W
UEVM
VictoryShares USAA MSCI Emerging Markets Value Momentum ETF
48.43
3.25
Buy
O
Positive
-3W
UITB
VictoryShares USAA Core Intermediate-Term Bond ETF
53.71
2.00
Buy
O
Positive
-10W
UIVM
VictoryShares USAA MSCI International Value Momentum ETF
47.54
2.95
Buy
O
Positive
-6W
ULVM
VictoryShares USAA MSCI USA Value Momentum ETF
59.41
3.18
Buy
O
Positive
-2W
USTB
VictoryShares USAA Core Short-Term Bond ETF
51.87
2.80
O
-1W
USVM
VictoryShares USAA MSCI USA Small Cap Value Momentum ETF
67.88
4.48
Buy
X
Positive
-2W
VSDA
VictoryShares Dividend Accelerator ETF
39.53
3.78
Buy
X
Positive
-11W
VSMV
VictoryShares US Multi-Factor Minimum Volatility ETF
34.40
2.61
Buy
O
Positive
-5W
This section of the report categorizes all of the Victory Mutual Funds by their respective broad group. Along with each group, you can view the Average Group Score, which is an average of the scores of all funds represented in that particular group. Those Victory Mutual Funds that meet or exceed the Average Group Score will be highlighted in green in order to easily view those Victory Mutual Funds that have superior strength within their respective group. You want to focus on those Victory Mutual Funds that exhibit superior strength when looking to add new exposure to a particular group.
| Small Cap Funds | Symbol | Name | Score |
|---|---|---|---|
| Average Group Score: 4.7 | GPSCX | Victory RS Small Cap Equity A | 5.45 |
| RSEGX | Victory RS Small Cap Growth A | 5.38 | |
| SSGSX | Victory Sycamore Small Company Opp A | 5.00 | |
| VSCVX | Victory Integrity Small-Cap Value A | 4.31 |
| Mid Cap Funds | Symbol | Name | Score |
|---|---|---|---|
| Average Group Score: 4.0 | GETGX | Victory Sycamore Established Value R | 5.48 |
| MAISX | Victory Integrity Small/Mid-Cap Value A | 4.51 | |
| MGOYX | Victory Munder Mid-Cap Core Growth Y | 4.42 | |
| MAIMX | Victory Integrity Mid-Cap Value A | 4.17 |
| Large Cap Funds | Symbol | Name | Score |
|---|---|---|---|
| Average Group Score: 3.9 | VFGAX | Victory NewBridge Large Cap Growth A | 4.41 |
| CUHCX | Victory US 500 Enhanced Volatility Wtd Index Fund | 4.34 | |
| VBFGX | Victory Strategic Allocation R | 4.26 | |
| MUXYX | Victory S&P 500 Index Y | 4.09 | |
| SRVEX | Victory Diversified Stock A | 4.08 | |
| SSVSX | Victory Special Value A | 3.98 |
| Sector Funds | Symbol | Name | Score |
|---|---|---|---|
| Average Group Score: 3.8 | RSNRX | Victory Global Natural Resources A | 5.97 |
| RSIFX | Victory RS Science and Technology A | 5.87 | |
| MNNAX | Victory Munder Multi-Cap A | 4.09 |
| Global Funds | Symbol | Name | Score |
|---|---|---|---|
| Average Group Score: 3.7 | MAEMX | Victory Trivalent Emerging Mkts Sm-Cp A | 4.75 |
| MISAX | Victory Trivalent International Sm-Cp A | 4.36 | |
| MAICX | Victory Trivalent Intl Fd-Core Eq A | 3.28 |

The distribution curve places each ETF on a bell curve according to their respective degrees of overbought or oversold status using a 10-week distribution. ETFs that are statistically oversold will appear on the left-hand side of the bell curve, while those that have become statistically overbought will appear on the right-hand side of the bell curve. Perhaps the most useful attribute of this feature is that it displays the entire universe on the curve at one time to give us a general picture of whether the Victory ETF universe is generally overbought on a near-term basis, or generally oversold. Our best opportunities are to buy strong relative strength ETFs that have regressed back toward mean conditions based on market weakness, or have become oversold based upon extreme market weakness. Weekly Distribution is a short-term gauge that is most helpful in timing entry and exit points, while the longer-term information of trend and relative strength is a more controlling factor in the decision of whether to buy or sell.
Average Level
46.06
VictoryShares ETF Models
The VictoryShares ETF Models are designed to identify major themes in the US equity marketplace through the use of the Point & Figure relative strength tools. For more information on the portfolio construction and backtesting, see the model info file on the models page.
Weekly Changes:
| ETF Name | Symbol | DWA Suggested Weighting | Yield | Date Added |
|---|---|---|---|---|
| VictoryShares US Small Cap Volatility Wtd ETF TR | CSA.TR | 50.000% | 1.2824 | 11/02/2020 |
| VictoryShares US Small Cap High Dividend 100 Volatility Wtd ETF TR | CSB.TR | 50.000% | 3.6768 | 06/01/2020 |
* Dates prior to 09/04/2018, which is when the VictoryShares Rotation Model became available on the Dorsey Wright Research Platform are representative of when the position was added to the backtested model
| ETF Name | Symbol | DWA Suggested Weighting | Yield | Date Added |
|---|---|---|---|---|
| VictoryShares US EQ Income Enhanced Volatility Wtd ETF TR | CDC.TR | 30.000% | 2.4888 | 11/30/2009 |
| VictoryShares US 500 Volatility Wtd ETF TR | CFA.TR | 30.000% | 1.2099 | 03/04/2019 |
| VictoryShares US 500 Enhanced Volatility Wtd ETF TR | CFO.TR | 40.000% | 0.8946 | 11/30/2009 |
* Dates prior to 09/04/2018, which is when the VictoryShares Select Model became available on the Dorsey Wright Research Platform are representative of when the position was added to the backtested model.
VictoryShares Report (Tues.)
Loading, Please Wait...
