
Most Requested Symbols


As of March 30th, we will no longer publish the weekly VictoryShares ETF report. Additionally, the VictoryShares Equity Rotation Model (VSROTATION) and VictoryShares Equity Select Model (VSSELECT) will no longer exist on the NDW Research Platform. The models successfully remained on our platform for over two years and were designed to seek a variety of outcomes, including maximum diversification, dividend income, and downside mitigation, so for those currently following or seeking to follow either of the strategies, see below for an outlined review of the underlying methodology.
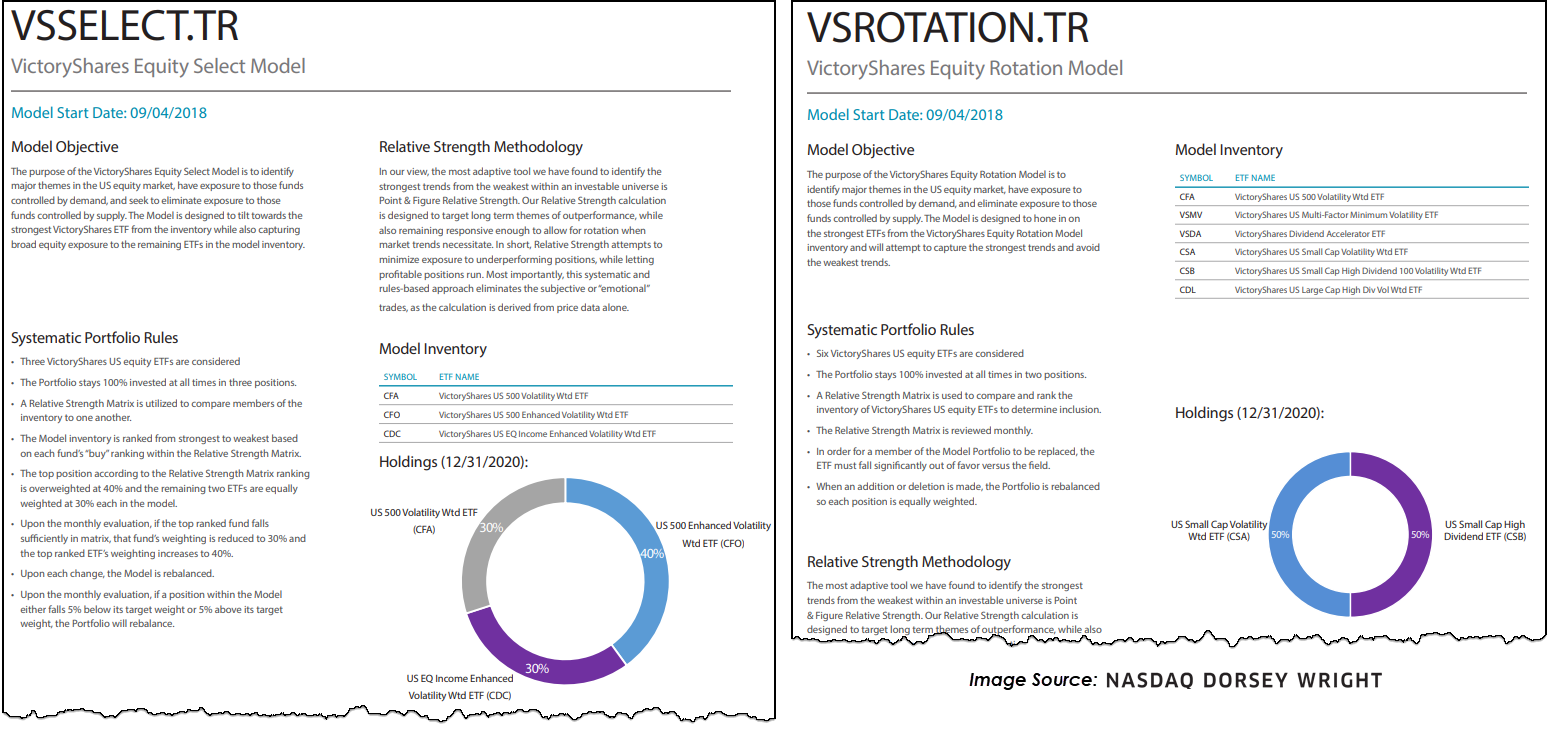
VSROTATION always seeks to identify major themes in the US equity market by staying fully invested in two of the six VictoryShares ETFs. A relative strength matrix (2.00 scale) is used to compare and rank the inventory of ETFs to determine inclusion. The strategy is reviewed at the beginning of every month and positions are only sold when they fall sufficiently out of favor (third or lower). The last trade for this portfolio happened in November of 2020, where the VictoryShares US Small Cap Volatility Wtd ETF (CSA) reentered the model to join the VictoryShares US Small Cap High Dividend 100 Volatility Wtd ETF (CSB). VSROTATION returned just shy of 28% in 2020, outperforming SPX by about 9.5%. VSROTATION is also off to a strong start in 2021 with a YTD return of 23.45% (through 3/15). Click here for the full info file.
VSSELECT also seeks to identify major themes in the US equity market by staying fully invested in three VictoryShares ETFs. A relative strength matrix is used to rank the inventory members, but unlike VSROTATION, VSSELECT overweights the top position at 40% and the remaining two receive an equal weighting of 30%. Upon a monthly evaluation, if a position within the model falls or appreciates more than 5% beyond its target weight, the portfolio will rebalance. The last trade for this strategy happened in November of 2020 when the VictoryShares US 500 Enhanced Volatility Wtd ETF (CFO) received the overweight. VSSELECT returned 13.73% in 2020 and currently posts a YTD return of 9.91%, outpacing the S&P 500 (SPX) by over 3.5%. Click here for the full info file.
If you have any questions or concerns on these models, please give us a call at 804-320-8511 or email us at dwa@dorseywright.com.

This weekly overview is designed to be used as a "radar" screen to bring your attention to potentially important technical changes that may require your attention and potential action. When evaluating the Fund Score, the strongest issues have scores of 4 or higher while those ETFs with scores below a 3 are no longer considered solid citizens.
Symbol
Name
Price
Fund Score
PnF Signal
RS Col.
PnF Trend
Weekly Mom
CDC
VictoryShares US EQ Income Enhanced Volatility Wtd ETF
61.79
4.59
Buy
O
Positive
+3W
CDL
VictoryShares US Large Cap High Div Vol Wtd ETF
54.20
3.54
Buy
O
Positive
+3W
CEY
VictoryShares Emerging Market High Dividend Volatility Wtd ETF
23.93
3.15
Buy
O
Positive
-12W
CEZ
VictoryShares Emerging Market Volatility Wtd ETF
28.00
2.99
Buy
O
Positive
-6W
CFA
VictoryShares US 500 Volatility Wtd ETF
66.93
3.45
Buy
O
Positive
-12W
CFO
VictoryShares US 500 Enhanced Volatility Wtd ETF
67.02
4.28
Buy
O
Positive
-1W
CID
VictoryShares International High Div Volatility Wtd ETF
32.15
3.08
Buy
O
Positive
+3W
CIL
VictoryShares International Volatility Wtd ETF
42.79
2.99
Buy
O
Positive
-13W
CIZ
VictoryShares Developed Enhanced Volatility Wtd ETF
32.57
2.57
Buy
O
Positive
-13W
CSA
VictoryShares US Small Cap Volatility Wtd ETF
66.05
4.59
Buy
X
Positive
-1W
CSB
VictoryShares US Small Cap High Dividend 100 Volatility Wtd ETF
61.46
4.51
Buy
X
Positive
+3W
CSF
VictoryShares US Discovery Enhanced Volatility Wtd ETF
61.62
4.53
Buy
X
Positive
+3W
UEVM
VictoryShares USAA MSCI Emerging Markets Value Momentum ETF
48.30
3.20
Buy
O
Positive
-6W
UITB
VictoryShares USAA Core Intermediate-Term Bond ETF
52.94
1.58
Buy
O
Positive
-13W
UIVM
VictoryShares USAA MSCI International Value Momentum ETF
48.08
3.11
Buy
O
Positive
-9W
ULVM
VictoryShares USAA MSCI USA Value Momentum ETF
62.07
3.60
Buy
O
Positive
-5W
USTB
VictoryShares USAA Core Short-Term Bond ETF
51.71
2.60
O
-4W
USVM
VictoryShares USAA MSCI USA Small Cap Value Momentum ETF
70.95
4.55
Buy
X
Positive
-5W
VSDA
VictoryShares Dividend Accelerator ETF
41.12
3.94
Buy
X
Positive
+3W
VSMV
VictoryShares US Multi-Factor Minimum Volatility ETF
35.17
2.79
Buy
O
Positive
-8W
This section of the report categorizes all of the Victory Mutual Funds by their respective broad group. Along with each group, you can view the Average Group Score, which is an average of the scores of all funds represented in that particular group. Those Victory Mutual Funds that meet or exceed the Average Group Score will be highlighted in green in order to easily view those Victory Mutual Funds that have superior strength within their respective group. You want to focus on those Victory Mutual Funds that exhibit superior strength when looking to add new exposure to a particular group.
| Small Cap Funds | Symbol | Name | Score |
|---|---|---|---|
| Average Group Score: 4.6 | SSGSX | Victory Sycamore Small Company Opp A | 5.27 |
| VSCVX | Victory Integrity Small-Cap Value A | 4.73 | |
| GPSCX | Victory RS Small Cap Equity A | 3.92 | |
| RSEGX | Victory RS Small Cap Growth A | 3.75 |
| Mid Cap Funds | Symbol | Name | Score |
|---|---|---|---|
| Average Group Score: 3.8 | GETGX | Victory Sycamore Established Value R | 5.70 |
| MAISX | Victory Integrity Small/Mid-Cap Value A | 4.83 | |
| MAIMX | Victory Integrity Mid-Cap Value A | 4.65 | |
| MGOYX | Victory Munder Mid-Cap Core Growth Y | 4.46 |
| Sector Funds | Symbol | Name | Score |
|---|---|---|---|
| Average Group Score: 3.6 | RSNRX | Victory Global Natural Resources A | 5.97 |
| RSIFX | Victory RS Science and Technology A | 4.48 | |
| MNNAX | Victory Munder Multi-Cap A | 4.46 |
| Large Cap Funds | Symbol | Name | Score |
|---|---|---|---|
| Average Group Score: 3.6 | CUHCX | Victory US 500 Enhanced Volatility Wtd Index Fund | 4.24 |
| SRVEX | Victory Diversified Stock A | 3.58 | |
| SSVSX | Victory Special Value A | 3.36 | |
| MUXYX | Victory S&P 500 Index Y | 3.30 | |
| VBFGX | Victory Strategic Allocation R | 3.14 | |
| VFGAX | Victory NewBridge Large Cap Growth A | 2.87 |
| Global Funds | Symbol | Name | Score |
|---|---|---|---|
| Average Group Score: 3.4 | MAEMX | Victory Trivalent Emerging Mkts Sm-Cp A | 4.61 |
| MISAX | Victory Trivalent International Sm-Cp A | 3.54 | |
| MAICX | Victory Trivalent Intl Fd-Core Eq A | 3.27 |

The distribution curve places each ETF on a bell curve according to their respective degrees of overbought or oversold status using a 10-week distribution. ETFs that are statistically oversold will appear on the left-hand side of the bell curve, while those that have become statistically overbought will appear on the right-hand side of the bell curve. Perhaps the most useful attribute of this feature is that it displays the entire universe on the curve at one time to give us a general picture of whether the Victory ETF universe is generally overbought on a near-term basis, or generally oversold. Our best opportunities are to buy strong relative strength ETFs that have regressed back toward mean conditions based on market weakness, or have become oversold based upon extreme market weakness. Weekly Distribution is a short-term gauge that is most helpful in timing entry and exit points, while the longer-term information of trend and relative strength is a more controlling factor in the decision of whether to buy or sell.
Average Level
48.81
VictoryShares ETF Models
The VictoryShares ETF Models are designed to identify major themes in the US equity marketplace through the use of the Point & Figure relative strength tools. For more information on the portfolio construction and backtesting, see the model info file on the models page.
Weekly Changes:
| ETF Name | Symbol | DWA Suggested Weighting | Yield | Date Added |
|---|---|---|---|---|
| VictoryShares US Small Cap Volatility Wtd ETF TR | CSA.TR | 50.000% | 1.2273 | 11/02/2020 |
| VictoryShares US Small Cap High Dividend 100 Volatility Wtd ETF TR | CSB.TR | 50.000% | 3.5655 | 06/01/2020 |
* Dates prior to 09/04/2018, which is when the VictoryShares Rotation Model became available on the Dorsey Wright Research Platform are representative of when the position was added to the backtested model
| ETF Name | Symbol | DWA Suggested Weighting | Yield | Date Added |
|---|---|---|---|---|
| VictoryShares US EQ Income Enhanced Volatility Wtd ETF TR | CDC.TR | 30.000% | 2.3880 | 11/30/2009 |
| VictoryShares US 500 Volatility Wtd ETF TR | CFA.TR | 30.000% | 1.1820 | 03/04/2019 |
| VictoryShares US 500 Enhanced Volatility Wtd ETF TR | CFO.TR | 40.000% | 0.8773 | 11/30/2009 |
* Dates prior to 09/04/2018, which is when the VictoryShares Select Model became available on the Dorsey Wright Research Platform are representative of when the position was added to the backtested model.
VictoryShares Report (Tues.)
Loading, Please Wait...
