Most Requested Symbols


*No changes this week. The next evaluation will occur on Thursday, August 1st.
**In October 2018, Invesco announced the acquisition of OppenheimerFunds. As a result, the Oppenheimer US Revenue Model is now the Invesco US Revenue Model with the same NDW symbol (OPPREV). Effective August 1st, the OPPREV model will be maintained in the Invesco ETF Report, which is published each Monday morning at 9:30 am. The model rules will remain the same. If you have any questions, please call our research team at 804-320-8511.
The Invesco US Revenue Model OPPREV seeks to provide overweight exposure to the strongest fund within an inventory of four members of Invesco's revenue line-up that each provide broad exposure to one of the three capitalization categories, as well as a dividend-focused inventory, but do so with a weighting scheme based on top-line revenue, as opposed to market capitalization. For example, the Invesco Large Cap Revenue ETF RWL provides broad exposure to the S&P 500 universe but does so by providing greater exposure to lower valuation companies than the market-cap benchmark.

| Ticker | Name | Report |
|---|---|---|
| RWJ | Invesco S&P Small Cap 600 Revenue ETF | Sell Signal Report |
| RWJ | Invesco S&P Small Cap 600 Revenue ETF | Daily Breakout Report |
| REFA | Oppenheimer International Revenue ETF | Stocks Whose Price Has Crossed Below The 200 Day Moving Average |
| ESGF | Oppenheimer Global ESG Revenue ETF | Stocks Whose Daily Momentum Has Changed From Positive To Negative |
| ESGL | Oppenheimer ESG Revenue ETF | Stocks Whose Daily Momentum Has Changed From Positive To Negative |
| OQAL | Oppenheimer Russell 1000 Quality Factor ETF | Stocks Whose Daily Momentum Has Changed From Positive To Negative |
| OVLU | Oppenheimer Russell 1000 Value Factor ETF | Stocks Whose Daily Momentum Has Changed From Positive To Negative |
| REFA | Oppenheimer International Revenue ETF | Stocks Whose Daily Momentum Has Changed From Positive To Negative |
| RGLB | Oppenheimer Global Revenue ETF | Stocks Whose Daily Momentum Has Changed From Positive To Negative |
| RWK | Invesco S&P Mid Cap 400 Revenue ETF | Stocks Whose Daily Momentum Has Changed From Positive To Negative |
| RWL | Invesco S&P 500 Revenue ETF | Stocks Whose Daily Momentum Has Changed From Positive To Negative |
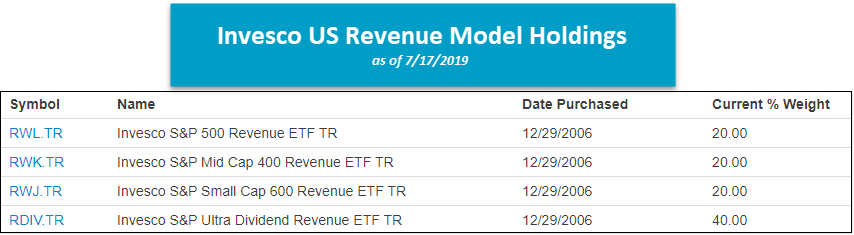
| Group | Symbol | Percent | |
|---|---|---|---|
| Cash | CASH$ | 0.00% | |
| Invesco S&P Mid Cap 400 Revenue ETF TR | All US Mid Cap | RWK.TR | 19.99% |
| Invesco S&P Small Cap 600 Revenue ETF TR | All US Small Cap | RWJ.TR | 20.01% |
| Invesco S&P 500 Revenue ETF TR | Growth-Domestic | RWL.TR | 19.99% |
| Invesco S&P Ultra Dividend Revenue ETF TR | Growth & Income | RDIV.TR | 40.01% |

| Symbol | Name | Price | Fund Score | Month Score Change | PnF Signal | RS Col. | PnF Trend | Weekly Mom |
|---|---|---|---|---|---|---|---|---|
| ESGF | Oppenheimer Global ESG Revenue ETF | 29.51 | 1.44 | -0.13 | Sell | O | Negative | +5W |
| ESGL | Oppenheimer ESG Revenue ETF | 31.89 | 4.54 | 0.20 | Buy | X | Positive | +5W |
| OMFL | Oppenheimer Russell 1000 Dynamic Multifactor ETF | 30.23 | 3.92 | 0.16 | Buy | O | Positive | +5W |
| OMFS | Oppenheimer Russell 2000 Dynamic Multifactor ETF | 26.70 | 3.76 | -0.24 | Sell | O | Negative | +4W |
| OMOM | Oppenheimer Russell 1000 Momentum Factor ETF | 29.06 | 3.86 | 0.25 | Buy | O | Positive | +5W |
| OQAL | Oppenheimer Russell 1000 Quality Factor ETF | 29.42 | 4.38 | 1.24 | Buy | O | Positive | +5W |
| OSIZ | Oppenheimer Russell 1000 Size Factor ETF | 28.35 | 3.58 | 1.04 | Buy | O | Positive | +5W |
| OVLU | Oppenheimer Russell 1000 Value Factor ETF | 27.17 | 3.83 | 1.18 | Sell | O | Negative | +5W |
| OVOL | Oppenheimer Russell 1000 Low Volatility Factor ETF | 29.40 | 5.58 | -0.05 | Buy | O | Positive | +5W |
| OYLD | Oppenheimer Russell 1000 Yield Factor ETF | 27.06 | 4.23 | -0.13 | Buy | O | Positive | +5W |
| RDIV | Invesco S&P Ultra Dividend Revenue ETF | 37.33 | 2.35 | -0.67 | Buy | O | Positive | +5W |
| REEM | Oppenheimer Emerging Markets Revenue ETF | 25.16 | 1.19 | -0.20 | O | +5W | ||
| REFA | Oppenheimer International Revenue ETF | 24.55 | 0.58 | -0.04 | Sell | O | Negative | +5W |
| RGLB | Oppenheimer Global Revenue ETF | 26.15 | 1.32 | 0.00 | Sell | O | Negative | +5W |
| RWJ | Invesco S&P Small Cap 600 Revenue ETF | 61.40 | 0.14 | -0.11 | Sell | O | Negative | +4W |
| RWK | Invesco S&P Mid Cap 400 Revenue ETF | 59.75 | 2.40 | -0.09 | Sell | O | Positive | +5W |
| RWL | Invesco S&P 500 Revenue ETF | 54.18 | 4.39 | 0.54 | Buy | O | Positive | +5W |
| RWW | Oppenheimer S&P Financials Revenue ETF | 68.16 | 4.39 | -0.16 | Buy | X | Positive | +4W |
Score change monthly period began 06/18/2019
Oppenheimer (Thurs.)
Loading, Please Wait...
