Most Requested Symbols

Over the past several years, betting on the market broadening beyond mega cap growth names has generally meant leaving upside on the table—until recently. Will the average stock fall behind again, or will this time truly be different?
As we typically do each quarter, today we revisit the debate between active and passive management by looking at how passive indices have fared across several different markets.
Weekly Rundown Video – Feb 11, 2026
Weekly rundown with NDW analyst team covering all major asset classes.
Weekly rundown with NDW analyst team covering all major asset classes.
Over the past several years, betting on the market broadening beyond mega cap growth names has generally meant leaving upside on the table—until recently. The Nasdaq-100 (NDX) has outperformed the S&P 500 Equal Weight (SPXEWI)—representing the average S&P 500 stock—by a cumulative 86.8% since the start of 2023. In contrast, SPXEWI has outperformed NDX by 11% since the end of October, highlighting the abnormality of recent market behavior. Given these developments, will the average stocks fall behind again, or will this time truly be different?

One sign of optimism comes from the performance of the average stock versus the Nasdaq-100 and the Invesco QQQ Trust (QQQ) fund that tracks it. The S&P 500 equal weight regained near-term relative strength over QQQ for the first time since the summer of 2024, underscoring the resurgence of the “average Joes” compared to growth stock giants.

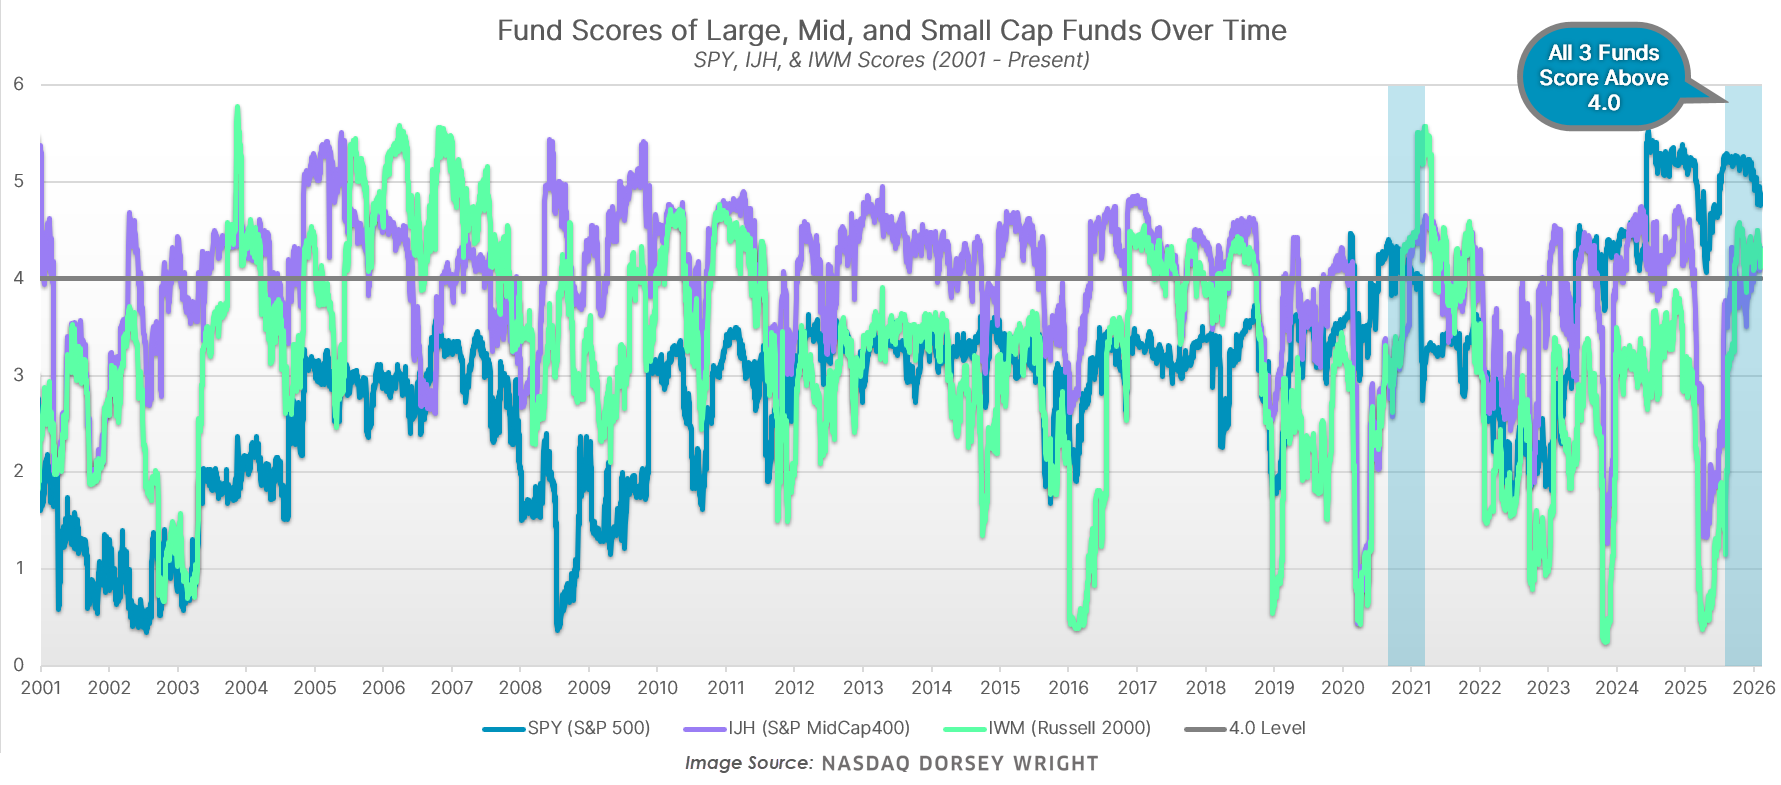
Moreover, recent gains have been sharpest outside of large caps. The iShares S&P MidCap 400 Index Fund (IJH) and iShares Russell 2000 ETF (IWM) are both handily beating the S&P 500’s 8.9% gain over the last six months, rising 14.9% and 20.3%, respectively. Sustained broad-based strength has resulted in SPY, IJH, and IWM all scoring above 4.0 for just the second time this century, with late 2020 being the only other recent instance.
Market broadening has also pushed participation within domestic equities to its highest levels in recent memory. Currently, the Bullish Percent for NYSE stocks (^BPNYSE) sits around 62%—its highest reading since late 2024. With more stocks and groups contributing to gains, market fragility should decrease as performance becomes less dependent on a handful of the largest names.

Strength has broadened not only across company sizes but also across the sectors leading the market. As noted in Monday’s report, only three of the eleven major sector SPDR funds managed to beat SPX the last three years. Conversely, recent gains have been driven by sectors beyond technology and communication services. Over the last three months, SPX has been roughly flat, yet eight of the eleven major sector SPDR funds have managed to beat the index.
Lastly, strength has broadened beyond just the US stocks market. Domestic equities sit several signals behind international equities in DALI’s asset class rankings, with commodities and fixed income also delivering solid performances over the trailing year. With so many different sizes, sectors, and asset classes pushing markets higher, continued broadening appears to be a defining theme of early 2026.
Given the widespread strength of financial markets, there appears to be less need for concentrated exposure in single groups like US mega cap growth—unlike recent years. Additionally, broader participation typically benefits trend‑following strategies, which can capitalize on more segments outperforming the benchmark, boding well for momentum as we look ahead to the rest of the year.

As we typically do each quarter, today we revisit the debate between active and passive management by looking at how passive indices have fared across several different markets – US large cap equity, US small cap equity, international developed equity, emerging market equity, and US fixed income – over both the short- and long-term.
2025 provided us with a good opportunity to evaluate active vs passive management as we experienced a major drawdown and subsequent recovery. One of the arguments in favor of active management is that active managers will outperform in down markets. The tariffs that were a major contributor to the downturn had been anticipated for some time, potentially allowing managers to position their portfolios accordingly.
The key determinant of which style, active or passive, is superior is market efficiency. Market efficiency describes the degree to which asset prices quickly and rationally adjust to reflect new information. In highly efficient markets, new information is quickly incorporated into prices, and therefore it is not possible to consistently achieve above-average risk-adjusted returns in these markets. Therefore, due to their lower cost, investors are better off utilizing passive strategies in highly efficient markets. In less efficient markets, on the other hand, the opportunity exists for skilled active managers to outperform passive strategies, thereby adding value for clients.
The active vs. passive debate often focuses on large-cap U.S. equities, which is a natural starting point for the discussion – the large-cap U.S. equity market is composed of the most well-known companies in the world and represents a large portion of many retirement portfolios. However, if we stop there, we ignore what should be an obvious and fundamental element of the discussion – the various markets around the globe are unlikely to all be equally efficient. The very fact that U.S. large-cap companies are the most visible and researched firms in the world suggests that the U.S. large-cap equity market is likely to be more efficient than its less well-known counterparts! It is because of the variation in efficiency that the merits of active versus passive management should be evaluated on a market-by-market basis.
On the surface, the debate between active and passive may seem academic. However, it has practical implications for advisors. Most importantly, you want to do what is in the best interest of your client. If your client is best served by using low-cost passive funds because active management truly doesn’t add value, then so be it. However, utilizing only passive funds eliminates one of your value propositions as an advisor – evaluating and selecting funds – and removes any possibility of outperformance, so, from a business perspective, it is probably preferable to keep at least some active management in the mix.
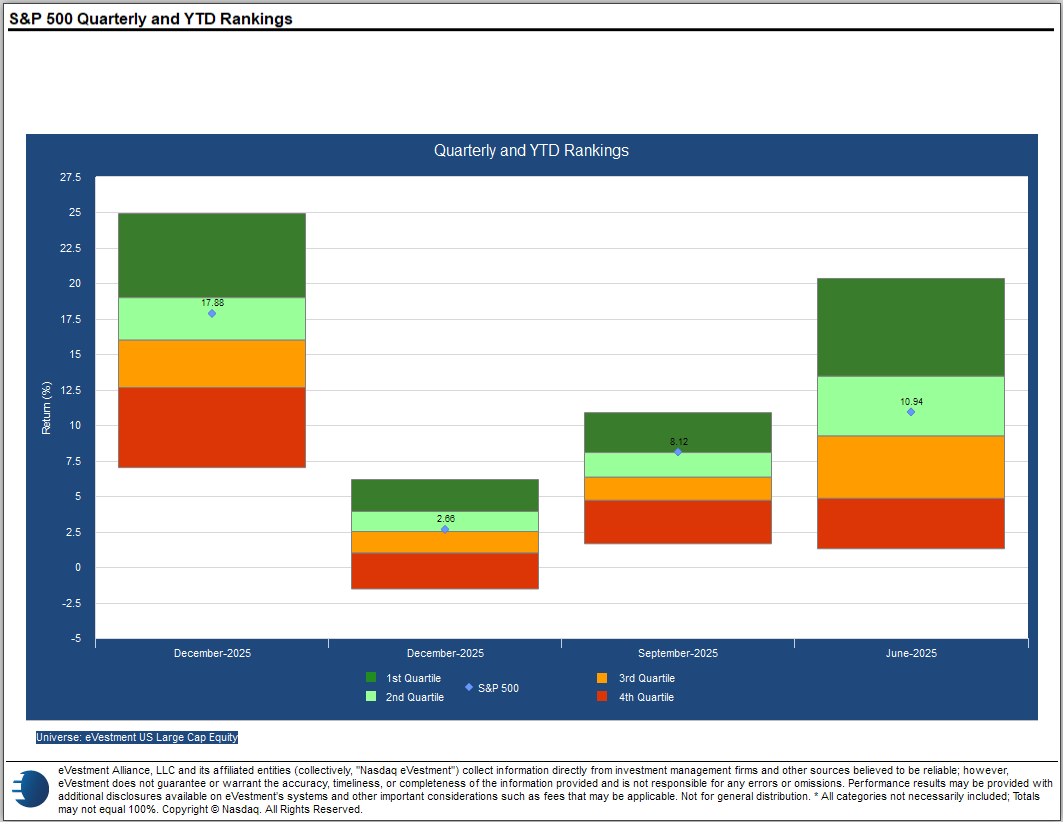
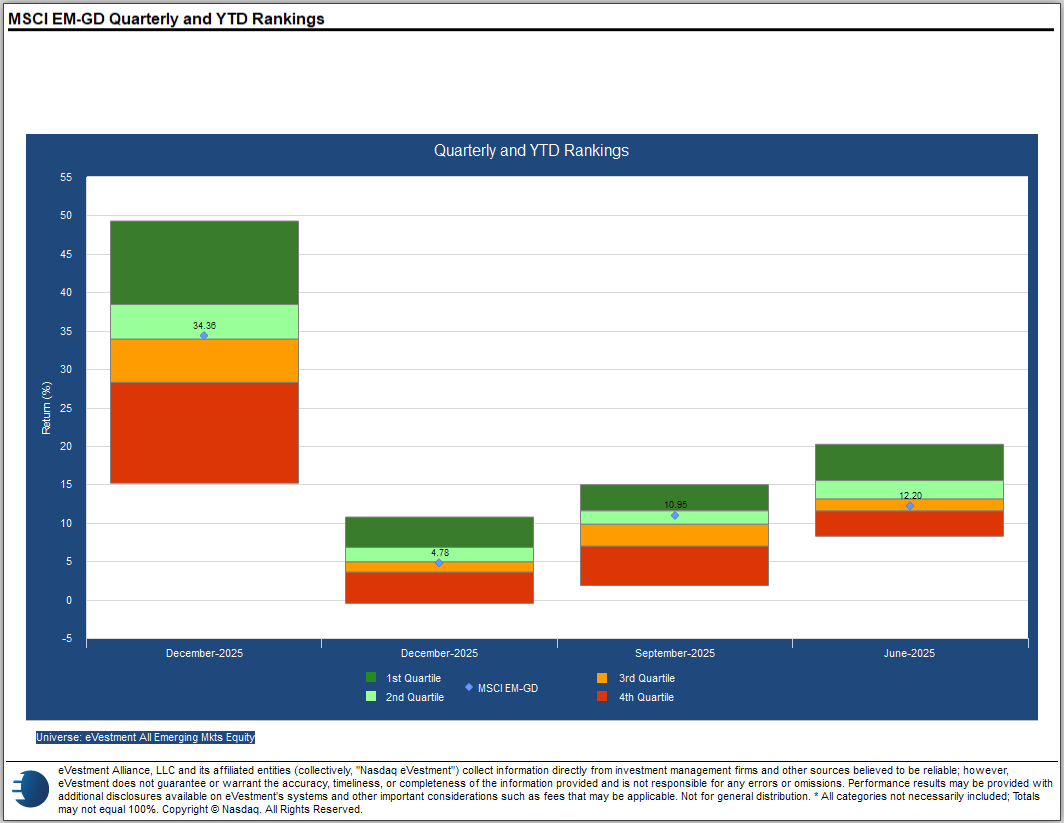
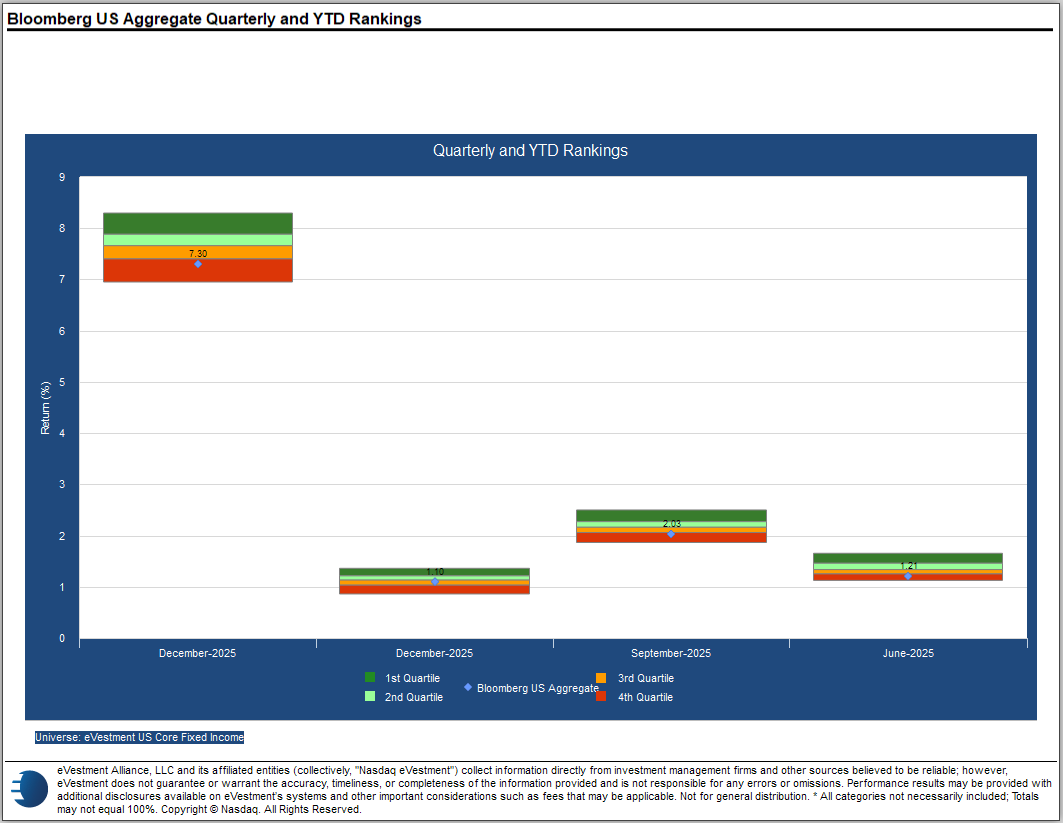
The tables below show the quarterly, year-to-date, and rolling five-year return rankings of several well-known indices (representing passive management). If the index ranks in the top two quartiles, then it outperformed most managers within the peer group during that period. Conversely, if the index ranks below the 50th percentile, then most active managers in that universe outperformed the benchmark. Looking at the rankings over time, we can get a feel for which markets are the most efficient, and thus are likely to favor passive management, and which are the least efficient, offering the greatest opportunity for active managers.
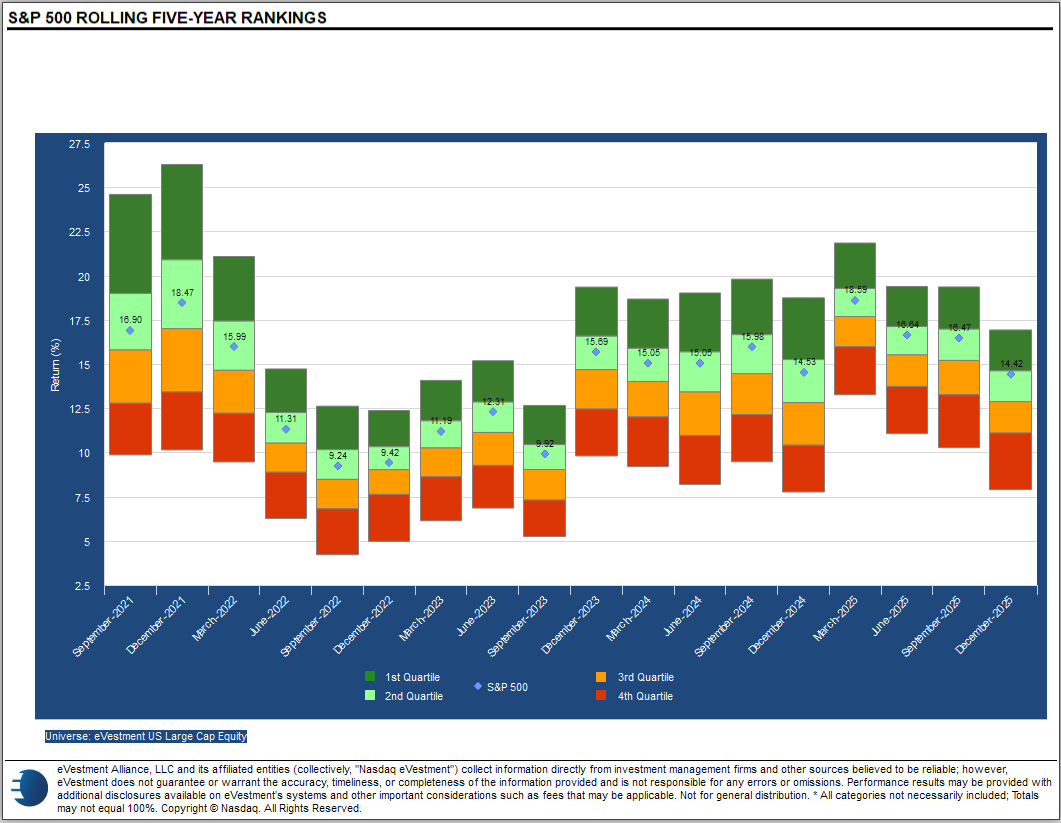
The earliest five-year period in our long-term rankings began in September 2016 and the most recent period ended December 31, 2025. During that time, we have experienced several different market environments and market-shaping events from the calm of 2017 to the volatility of 2020 and the tariff-driven drawdown last year. So, we have a good cross-section of market states upon which to base our conclusions.
US Large Cap Equities
The S&P 500 finished 2025 in the second quartile of our rankings, outperforming most active managers in the space. This is in keeping with what we have seen over the long-term as the S&P has finished above the 50th percentile in every rolling five-year period in our lookback window. This does not preclude the possibility that some active managers may have consistently outperformed the benchmark, but over the last decade the S&P 500 has been a difficult hurdle.
US Small Cap Equities
Like its large counterpart, the Russell 2000 finished 2025 the second quartile of our rankings. However, unlike large caps, outperformance by the benchmark as been the exception rather than the rule; the Russell 2000 has finished below the 50th percentile in every rolling five-year period in our lookback window, suggesting that active management has been additive in small caps.


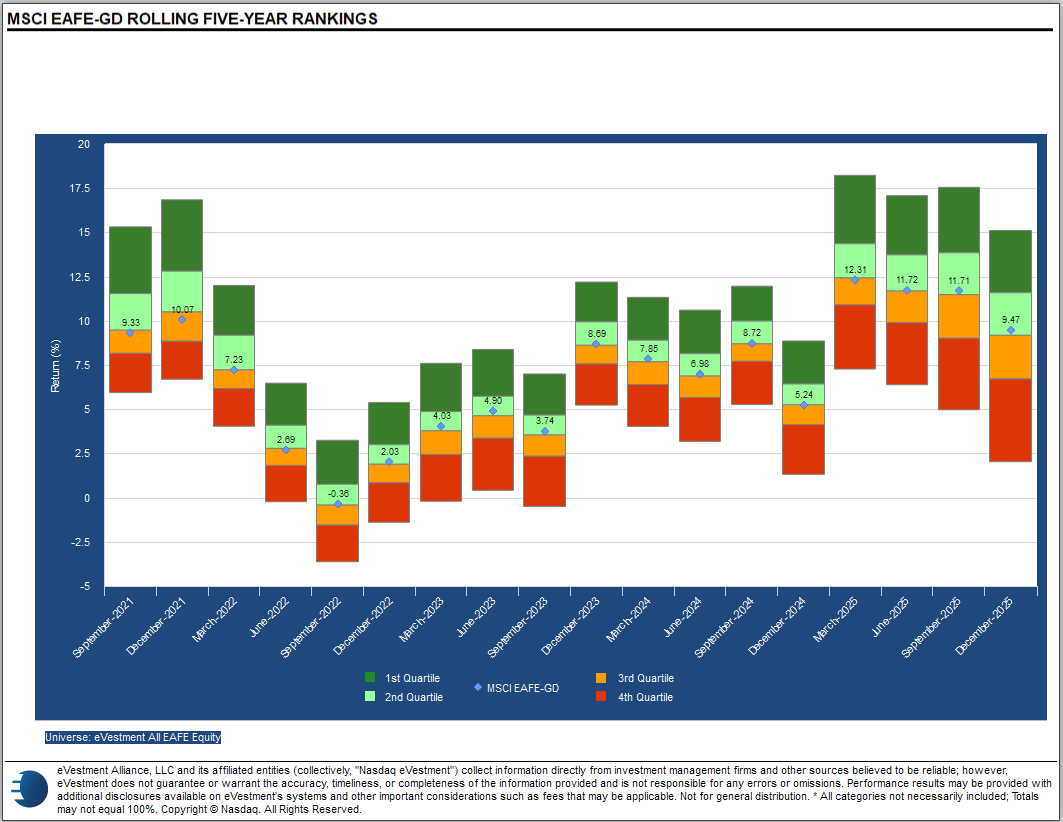
Developed International Equities
The MSCI EAFE Index finished 2025 right around the 50th percentile of our rankings. This is in line with the longer-term trend as the index has hovered around the middle of the rankings in most rolling five-year periods, offering no clear indication of an advantage for active or passive management.

Emerging Market Equities
Like the EAFE index, the MSCI Emerging Markets Index finished 2025 near the middle of our rankings. However, over the longer-term the rankings indicate an advantage for active management as the index has finished below the 50th percentile in each of the last 14 rolling five-year periods.

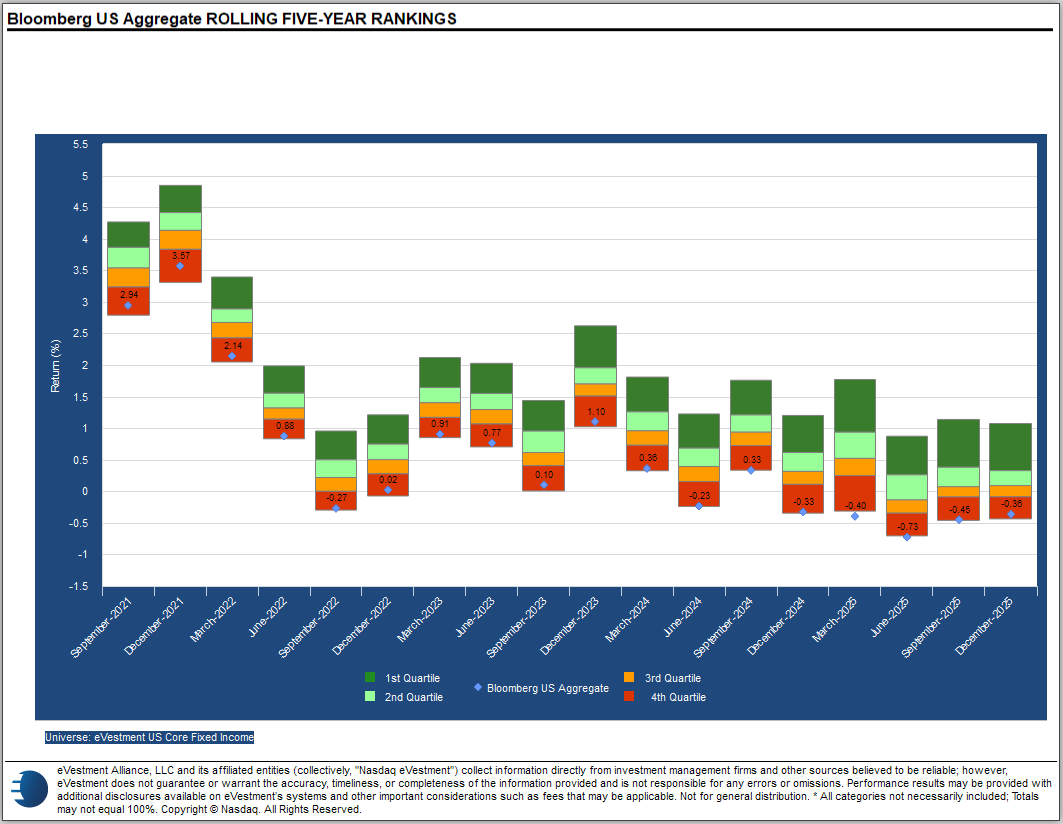
US Fixed Income
As regular readers of this report know, fixed income has provided the most reliable advantage for active management. 2025 was no exception as the Bloomberg US Aggregate Bond Index finished in the bottom quartile of the rankings. In the long-term rankings, the index has finished in the bottom quartile of our rankings in every rolling five-year period in our lookback window.
Average Level
42.12
| < - -100 | -100 - -80 | -80 - -60 | -60 - -40 | -40 - -20 | -20 - 0 | 0 - 20 | 20 - 40 | 40 - 60 | 60 - 80 | 80 - 100 | 100 - > |
|---|---|---|---|---|---|---|---|---|---|---|---|
|
Sell signalief
|
|||||||||||
|
Buy signalshy
|
|||||||||||
|
Sell signallqd
|
Buy signalgsg
|
||||||||||
|
Buy signalhyg
|
Buy signalrsp
|
||||||||||
|
Buy signaltlt
|
Buy signalijr
|
Buy signalVOOV
|
Buy signaldvy
|
||||||||
|
Buy signalXLG
|
Sell signalONEQ
|
Buy signalagg
|
Buy signalgcc
|
Buy signalfxe
|
Buy signalIJH
|
Buy signalGLD
|
Buy signalEEM
|
||||
|
Sell signaldx/y
|
Sell signalVOOG
|
Buy signalQQQ
|
Buy signalSPY
|
Buy signaliwm
|
Buy signaldia
|
Buy signaluso
|
Buy signalicf
|
Buy signalefa
|
|||
| < - -100 | -100 - -80 | -80 - -60 | -60 - -40 | -40 - -20 | -20 - 0 | 0 - 20 | 20 - 40 | 40 - 60 | 60 - 80 | 80 - 100 | 100 - > |
| AGG | iShares US Core Bond ETF |
| USO | United States Oil Fund |
| DIA | SPDR Dow Jones Industrial Average ETF |
| DVY | iShares Dow Jones Select Dividend Index ETF |
| DX/Y | NYCE U.S.Dollar Index Spot |
| EFA | iShares MSCI EAFE ETF |
| FXE | Invesco CurrencyShares Euro Trust |
| GLD | SPDR Gold Trust |
| GSG | iShares S&P GSCI Commodity-Indexed Trust |
| HYG | iShares iBoxx $ High Yield Corporate Bond ETF |
| ICF | iShares Cohen & Steers Realty ETF |
| IEF | iShares Barclays 7-10 Yr. Tres. Bond ETF |
| LQD | iShares iBoxx $ Investment Grade Corp. Bond ETF |
| IJH | iShares S&P 400 MidCap Index Fund |
| ONEQ | Fidelity Nasdaq Composite Index Track |
| QQQ | Invesco QQQ Trust |
| RSP | Invesco S&P 500 Equal Weight ETF |
| IWM | iShares Russell 2000 Index ETF |
| SHY | iShares Barclays 1-3 Year Tres. Bond ETF |
| IJR | iShares S&P 600 SmallCap Index Fund |
| SPY | SPDR S&P 500 Index ETF Trust |
| TLT | iShares Barclays 20+ Year Treasury Bond ETF |
| GCC | WisdomTree Continuous Commodity Index Fund |
| VOOG | Vanguard S&P 500 Growth ETF |
| VOOV | Vanguard S&P 500 Value ETF |
| EEM | iShares MSCI Emerging Markets ETF |
| XLG | Invesco S&P 500 Top 50 ETF |

| Symbol | Company | Sector | Current Price | Action Price | Target | Stop | Notes |
|---|---|---|---|---|---|---|---|
| JPM | J.P. Morgan Chase & Co. | Banks | $310.82 | lo 300s - mid 320s | 380 | 256 | 5 TA rating, top 25% of favored BANK sector matrix, LT RS buy, LT pos trend, buy-on-pullback |
| EWBC | East West Bancorp, Inc. | Banks | $119.10 | mid 100s - mid 110s | 157 | 92 | 4 for 5'er, top third of favored BANK sector matrix, LT pos peer RS, one box from mkt RS buy, spread quad top |
| ULTA | Ulta Beauty, Inc. | Retailing | $683.05 | 632 - hi 600s | 840 | 568 | 4 TA rating, top 10% of RETA sector matrix, LT RS buy, consec buy signals |
| APTV | Aptiv PLC | Autos and Parts | $83.76 | hi 70s - low 80s | 100 | 69 | 5 for 5'er, top half of AUTO sector matrix, successful trend line test |
| GS | Goldman Sachs Group, Inc. | Wall Street | $944.59 | mid-800s - mid-900s | 1416 | 736 | 5 TA rating, top 10% of WALL sector matrix, LT RS buy, LT pos trend, buy-on-pullback |
| PHM | PulteGroup, Inc. | Building | $139.32 | hi 120s - mid 130s | 168 | 110 | 4 for 5'er, top half of BUIL sector matrix, LT pos peer & mkt RS, bullish catapult |
| META | Meta Platform Inc. | Internet | $668.69 | 650s - 690s | 1040 | 552 | 4 for 5'er, top 20% of INET sector matrix, LT pos peer & mkt RS, triple top, buy on pullback |
| ATO | Atmos Energy Corp | Gas Utilities | $175.97 | 170s | 202 | 148 | 4 for 5'er. top 20% of GUTI sector matrix, LT pos peer RS, 3.3% yield |
| CBOE | CBOE Global Markets Inc. | Wall Street | $268.64 | lo 260s - mid 280s | 332 | 228 | 5 TA rating, top 25% of WALL sector matrix, LT RS buy, LT pos trend, buy-on-pullback |
| Symbol | Company | Sector | Current Price | Action Price | Target | Stop | Notes |
|---|
| Symbol | Company | Sector | Current Price | Action Price | Target | Stop | Notes |
|---|---|---|---|---|---|---|---|
| BFH | Bread Financial Holdings Inc. | Business Products | $76.03 | 64 | Moved to a sell signal. Current exposure can maintain $64 stop. |
| Comment | |||||||
|---|---|---|---|---|---|---|---|
|
|
|||||||
CBOE CBOE Global Markets Inc. ($271.95) R - Wall Street - CBOE has a 5 for 5 TA rating and sits in the top quartile of the wall street sector RS matrix. The stock has also been on an RS buy signal against the market and maintained a positive trend since 2023. After completing a shakeout pattern earlier this month at a new all-time high, CBOE has retracted back toward the middle of its trading band, offering a more opportune entry point. Exposure can be considered in the low $260s to mid-$280s. Our initial stop will be positioned at $228, which would violate multiple support levels and move the stock to a negative trend. The bullish price objective of $332 will serve as our price target.
| 25 | 26 | ||||||||||||||||||||||||||||
| 280.00 | X | 280.00 | |||||||||||||||||||||||||||
| 276.00 | X | 2 | X | 276.00 | |||||||||||||||||||||||||
| 272.00 | X | O | X | O | X | 272.00 | |||||||||||||||||||||||
| 268.00 | X | O | X | O | X | 268.00 | |||||||||||||||||||||||
| 264.00 | X | O | O | X | 264.00 | ||||||||||||||||||||||||
| 260.00 | X | 1 | O | X | Mid | 260.00 | |||||||||||||||||||||||
| 256.00 | X | O | X | O | 256.00 | ||||||||||||||||||||||||
| 252.00 | 8 | B | O | X | 252.00 | ||||||||||||||||||||||||
| 248.00 | X | O | X | X | C | 248.00 | |||||||||||||||||||||||
| 244.00 | X | O | X | O | X | 244.00 | |||||||||||||||||||||||
| 240.00 | X | O | X | O | X | 240.00 | |||||||||||||||||||||||
| 236.00 | X | 7 | O | X | A | X | • | 236.00 | |||||||||||||||||||||
| 232.00 | X | X | O | X | X | 9 | O | • | 232.00 | ||||||||||||||||||||
| 228.00 | 4 | O | X | O | X | O | X | • | 228.00 | ||||||||||||||||||||
| 224.00 | X | O | 5 | O | X | O | X | • | Bot | 224.00 | |||||||||||||||||||
| 220.00 | X | X | X | O | X | O | X | 6 | • | 220.00 | |||||||||||||||||||
| 216.00 | A | X | O | X | 3 | O | X | O | X | O | • | 216.00 | |||||||||||||||||
| 212.00 | O | X | O | X | O | X | O | X | O | X | O | X | • | 212.00 | |||||||||||||||
| 208.00 | O | X | O | X | C | 2 | O | X | O | X | O | X | • | 208.00 | |||||||||||||||
| 204.00 | 9 | B | X | O | X | O | O | O | • | 204.00 | |||||||||||||||||||
| 200.00 | O | X | O | X | • | 200.00 | |||||||||||||||||||||||
| 198.00 | O | X | O | X | • | 198.00 | |||||||||||||||||||||||
| 196.00 | O | O | X | • | 196.00 | ||||||||||||||||||||||||
| 194.00 | O | X | • | 194.00 | |||||||||||||||||||||||||
| 192.00 | O | X | • | 192.00 | |||||||||||||||||||||||||
| 190.00 | 1 | X | • | 190.00 | |||||||||||||||||||||||||
| 188.00 | O | • | 188.00 | ||||||||||||||||||||||||||
| 25 | 26 |
| AEP American Electric Power Company, Inc. ($127.92) - Utilities/Electricity - AEP broke a double top at $126 for a third buy signal and to mark a new all-time chart high. The stock has been a 3 for 5'er since July 2025 and currently ranks within the top third of the Electric Utilities sector matrix. The stock maintains a yield north of 3% and monthly momentum has flipped back to positive. Okay to consider on a pullback into the lower $120 to upper $110 range. Intial support lies at $114, while additional may be found in the mid $100s. |
| AMT American Tower REIT ($188.19) - Real Estate - Shares of AMT broke a double top at $184, in addition to moving back to a positive trend. AMT should now be a 1 for 5'er. but remains in sell territory given its lack of relative strength. From here, initial resistance lies at $194 and $198 |
| AXP American Express Company ($343.50) - Finance - AXP shares moved lower today to complete a bearish catapult and mark their third consecutive sell signal. This 5 for 5'er has been in a positive trend since November 2023 and on an RS buy signal versus the market since February 2022. AXP shares are trading below the middle of their ten-week trading band with a weekly overbought/oversold reading of -36%. From here, support is offered at $336. |
| CRK Comstock Resources ($19.08) - Oil - CRK fell to a sell signal Thursday after unsuccessfully testing its bearish resistance line once again. Thursday's move adds to an already unfavorable technical picture as CRK is a 2 for 5'er and ranks 55th of 55 names in the oil sector matrix. From here, the next level of support sits at $17. |
| CROX Crocs, Inc. ($100.42) - Textiles/Apparel - CROX reversed into Xs and broke a double top at $89 for a second buy signal as shares rallied to $100, marking their highest level since August 2025. After seeing the trend flip back to positive earlier this month, this breakout will bring both the peer and market RS charts into Xs and increase the stock to a 3 for 5'er. The rally places the stock in an extended position, so those seeking exposure are best to look for price consolidation in the upper to mid $90s along with a normalization of the 10-week trading band before considering. Prior resistance in the lower $90s may be seen as near-term support, while the bullish support line resides at $83. |
| DIS The Walt Disney Company ($102.38) - Media - Like clockwork, chart action above $100 has continued to give shares of DIS fits over the last few years. Action on 2/12 saw the media giant post its third consecutive sell signal off 2025 highs, testing support from the end of last year. Despite the strong technical attribute score, be careful at/around current levels. A violation of support here would leave us within striking distance of the positive trend line below. Take this now 4th instance of poor participation above $100 as a word of caution for next time. |
| MS Morgan Stanley ($169.67) - Wall Street - MS shares moved lower today to break a double bottom at $172 to mark its third consecutive sell signal. This 5 for 5'er has been in a positive trend since May 2025 and on an RS buy signal versus the market since June 2013. MS shares are trading below the middle of their ten-week trading band with a weekly overbought/oversold reading of -20%. From here, support is offered at $156. |
| ROST Ross Stores, Inc. ($195.33) - Retailing - ROST broke a double top at $196 for a fifth consecutive buy signal since July 2025 and to mark a new all-time chart high. The stock has been a 5 for 5'er since November 2025 and current ranks within the top quintile of the Retailing sector matrix. Okay to consider here on the breakout or on a pullback to $190 on the chart. Initial support lies at $186, while additional can be found around $160. |
| THC Tenet Healthcare Corporation ($229.58) - Healthcare - THC reversed back into Xs and completed a double top break at $208, marking its second consecutive buy signal and a new intraday all-time high above $232. The 5 for 5'er has been on an RS buy signal since 2020 and ranks in the top fourth of the healthcare sector matrix. The weekly OBOS indicates that the stock is in overbought territory, so wait for the 10-week trading band to normalize before considering. Strong support can be seen between $186-$188. |
| W Wayfair Inc. ($80.23) - Retailing - W broke a double bottom at $84 for a third sell signal as shares fell to $80. The move violates the bullish support line, which following the reversal in Xs and RS sell signal on the market RS chart earlier this month, will bring the stock down to a 1 for 5'er trading in a negative trend. From here, support lies at $79, while additional may be found at $74, the October 2025 chart low. |

| Name | Option Symbol | Action | Stop Loss |
|---|---|---|---|
| The Charles Schwab Corporation - $95.59 | SCHW2615E97.5 | Buy the May 97.50 calls at 5.90 | 89.00 |
| Name | Option | Action |
|---|---|---|
| Cisco Systems, Inc. ( CSCO) | Mar. 77.50 Calls | Stopped at 8.15 (CP: 1.22) |
| Bank of America ( BAC) | Apr. 52.50 Calls | Stopped at 3.25 (CP: 2.70) |
| Hilton Worldwide Holdings Inc ( HLT) | Mar. 300.00 Calls | Stopped at 26.60 (CP: 24.80) |
| Name | Option Symbol | Action | Stop Loss |
|---|---|---|---|
| The Southern Company - $93.05 | SO2615Q92.5 | Buy the May 92.50 puts at 3.80 | 102.00 |
| Name | Option | Action |
|---|---|---|
| Paypal Holdings Inc ( PYPL) | Mar. 60.00 Puts | Raise the option stop loss to 18.35 (CP: 20.35) |
| Name | Option Sym. | Call to Sell | Call Price | Investment for 500 Shares | Annual Called Rtn. | Annual Static Rtn. | Downside Protection |
|---|---|---|---|---|---|---|---|
| Target Corporation $ 114.61 | TGT2615E115 | May. 115.00 | 7.50 | $ 53,357.55 | 26.60% | 23.40% | 5.57% |
| Name | Action |
|---|---|
| Alcoa Inc. ( AA) - 63.15 | Sell the March 60.00 Calls. |
| Intel Corporation ( INTC) - 48.29 | Sell the May 49.00 Calls. |
| The Gap, Inc. ( GAP) - 27.46 | Sell the March 29.00 Calls. |
| Dollar General Corp. ( DG) - 147.16 | Sell the May 150.00 Calls. |
| Fortinet Inc. ( FTNT) - 87.82 | Sell the May 90.00 Calls. |
| Enphase Energy Inc ( ENPH) - 48.23 | Sell the April 50.00 Calls. |
| Name | Covered Write |
|---|---|
| Freeport-McMoRan Inc. ( FCX - 65.46 ) | March 65.00 covered write. |
Daily Equity & Market Analysis
LISTEN TO PODCAST
Feb 12, 2026
NDW MORNING UPDATE
Feb 12, 2026
Loading, Please Wait...
