Most Requested Symbols


There are no changes to the Oppenheimer Revenue Model this week. This month is updated on a monthly basis. The next evaluation will occur within Thursday, December 6th's Report.
Most of you are familiar with our fund scoring process. Every Mutual Fund and ETF in the Dorsey Wright system is assigned a fund score between 0.00 and 6.00, with six being the best score possible. The composition of the score can be broken down into three components: Trend, Relative Strength vs. the Market, and Relative Strength vs. Peers. Two of the potential points are based on the trending characteristics of the fund, two of the potential points are given towards relative strength characteristics versus the broad market, and the remaining two potential points are based on relative strength characteristics versus its peers. The higher the score, the better the overall technical picture for the fund that you’re analyzing. Generally speaking, we consider anything with a score of four or higher to fall within the "buyable" range, and anything with a score of three or higher is okay to hold. When a current holding falls below the three threshold, you will want evaluate whether to continue to hold or to begin weeding the position out of the portfolio.
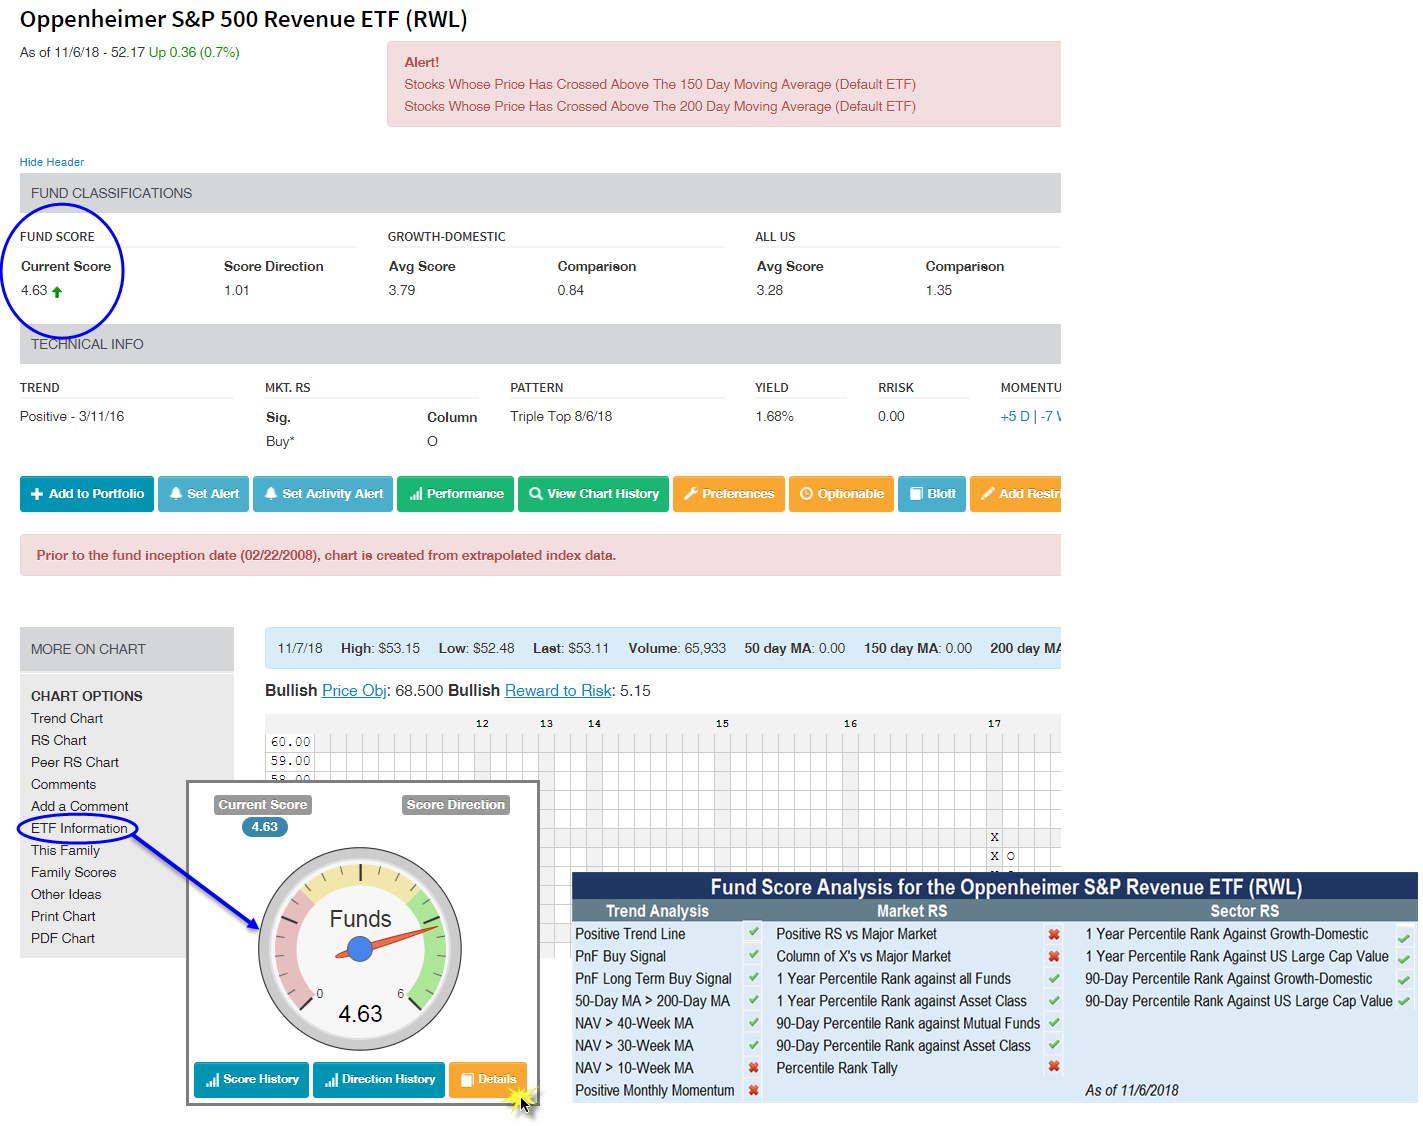
Typically, we use the Point & Figure chart to evaluate trend, signal, support levels, momentum, etc. as it helps provide color into that sell or hold decision. One area of the site you may not be aware of is the “ETF Information” link under the “More On Chart” section to the left of any ETF trend chart. From there, click on "ETF Information," you will see an orange “Details” button under the "Fund Score Details" section. This orange "Details" button will take you to a summarized analysis of which components are positive versus negative for the fund score calculation for the particular ETF. We have complied this data for the Oppenheimer S&P Revenue ETF RWL in the image below.
The Oppenheimer S&P 500 Revenue ETF continues to trade in a long term positive trend. Although the RWL sold off with the broader market in the month of October, the Fund remained above levels of support it had established earlier in the year. After a low of $49.50 on the chart last month, the RWL has rebounded nicely, and currently resides in a column of X’s at $53.
More to the point of this article, the RWL’s fund score is a solid 4.63 (as of 11/6), with a positive score direction of 1.01 over the past six months. As seen below, the majority of the underlying fund score components are positive, though there are still some areas that RWL could improve on.
Instructions for Accessing Fund Score Analysis on ETFs:

| Symbol | Name | Price | Score | Month Score Change | Signal | RS Col. | Trend | Weekly Mom |
| ESGF | Oppenheimer Global ESG Revenue ETF | 29.33 | 1.61 | -0.21 | Sell | O | -4W | |
| ESGL | Oppenheimer ESG Revenue ETF | 31.56 | 4.82 | -0.25 | X | -7W | ||
| OMFL | Oppenheimer Russell 1000 Dynamic Multifactor ETF | 28.42 | 2.75 | 0.04 | Buy | O | Positive | -7W |
| OMFS | Oppenheimer Russell 2000 Dynamic Multifactor ETF | 26.68 | 3.86 | -0.44 | Buy | O | Positive | -7W |
| OMOM | Oppenheimer Russell 1000 Momentum Factor ETF | 27.12 | 2.25 | -0.50 | O | -6W | ||
| OQAL | Oppenheimer Russell 1000 Quality Factor ETF | 26.79 | 3.74 | -0.71 | O | -6W | ||
| OSIZ | Oppenheimer Russell 1000 Size Factor ETF | 26.11 | 2.06 | -0.54 | Buy | O | Positive | -6W |
| OVLU | Oppenheimer Russell 1000 Value Factor ETF | 25.81 | 2.60 | -0.73 | O | -6W | ||
| OVOL | Oppenheimer Russell 1000 Low Volatility Factor ETF | 27.11 | 4.29 | 1.76 | O | -10W | ||
| OYLD | Oppenheimer Russell 1000 Yield Factor ETF | 25.88 | 3.19 | 0.69 | O | -7W | ||
| RDIV | Oppenheimer S&P Ultra Dividend Revenue ETF | 38.20 | 4.49 | 0.70 | Buy | O | Positive | -7W |
| REEM | Oppenheimer Emerging Markets Revenue ETF | 24.37 | 0.45 | -0.10 | O | +1W | ||
| REFA | Oppenheimer International Revenue ETF | 24.82 | 0.41 | -0.30 | Sell | O | Negative | -5W |
| RGLB | Oppenheimer Global Revenue ETF | 25.87 | 0.56 | -1.33 | O | -5W | ||
| RWJ | Oppenheimer S&P Small Cap 600 Revenue ETF | 70.37 | 3.65 | 0.18 | Sell | X | Positive | -9W |
| RWK | Oppenheimer S&P Mid Cap 400 Revenue ETF | 60.29 | 3.48 | -1.06 | Sell | X | Positive | -10W |
| RWL | Oppenheimer S&P 500 Revenue ETF | 53.11 | 4.75 | -0.06 | Buy | O | Positive | -7W |
| RWW | Oppenheimer S&P Financials Revenue ETF | 65.95 | 2.85 | -1.45 | Sell | X | Positive | -7W |
Score change monthly period began 10/08/2018
| Links to Additional Summaries |
| Ticker | Name | Report |
|---|---|---|
| ESGL | Oppenheimer ESG Revenue ETF | Indicator Column Change |
| OMOM | Oppenheimer Russell 1000 Momentum Factor ETF | Indicator Column Change |
| RDIV | Oppenheimer S&P Ultra Dividend Revenue ETF | Indicator Column Change |
| RWK | Oppenheimer S&P Mid Cap 400 Revenue ETF | Buy Signal Report |
| RWK | Oppenheimer S&P Mid Cap 400 Revenue ETF | Buy Signal Report |
| RWK | Oppenheimer S&P Mid Cap 400 Revenue ETF | Daily Breakout Report |
| RWK | Oppenheimer S&P Mid Cap 400 Revenue ETF | Daily Breakout Report |
| ESGL | Oppenheimer ESG Revenue ETF | Stocks/Funds Trend Chart Column Reversed To X's |
| OMOM | Oppenheimer Russell 1000 Momentum Factor ETF | Stocks/Funds Trend Chart Column Reversed To X's |
| RDIV | Oppenheimer S&P Ultra Dividend Revenue ETF | Stocks/Funds Trend Chart Column Reversed To X's |
| ESGL | Oppenheimer ESG Revenue ETF | Stocks Whose Price Has Crossed Above The 200 Day Moving Average |
| OMOM | Oppenheimer Russell 1000 Momentum Factor ETF | Stocks Whose Price Has Crossed Above The 200 Day Moving Average |
| ESGL | Oppenheimer ESG Revenue ETF | Stocks Whose Price Has Crossed Above The 150 Day Moving Average |
| OYLD | Oppenheimer Russell 1000 Yield Factor ETF | Stocks Whose Price Has Crossed Above The 150 Day Moving Average |
| OMFL | Oppenheimer Russell 1000 Dynamic Multifactor ETF | Stocks Whose Price Has Crossed Above The 50 Day Moving Average |
| OYLD | Oppenheimer Russell 1000 Yield Factor ETF | Stocks Whose Monthly Momentum Has Changed From Negative To Positive |
| RWL | Oppenheimer S&P 500 Revenue ETF | Stocks Whose Monthly Momentum Has Changed From Negative To Positive |

| Group | Symbol | Percent | |
|---|---|---|---|
| Cash | CASH$ | 0.00% | |
| Oppenheimer S&P Mid Cap 400 Revenue ETF TR | All US Mid Cap | RWK.TR | 20.00% |
| Oppenheimer S&P Small Cap 600 Revenue ETF TR | All US Small Cap | RWJ.TR | 40.00% |
| Oppenheimer S&P Ultra Dividend Revenue ETF TR | Growth & Income | RDIV.TR | 19.99% |
| Oppenheimer S&P 500 Revenue ETF TR | Growth-Domestic | RWL.TR | 20.00% |
Oppenheimer (Thurs.)
Loading, Please Wait...
