Most Requested Symbols


The Oppenheimer US Revenue Model is evaluated for changes on a monthly basis. The next evaluation will occur in Thursday, May 3rd's Report.
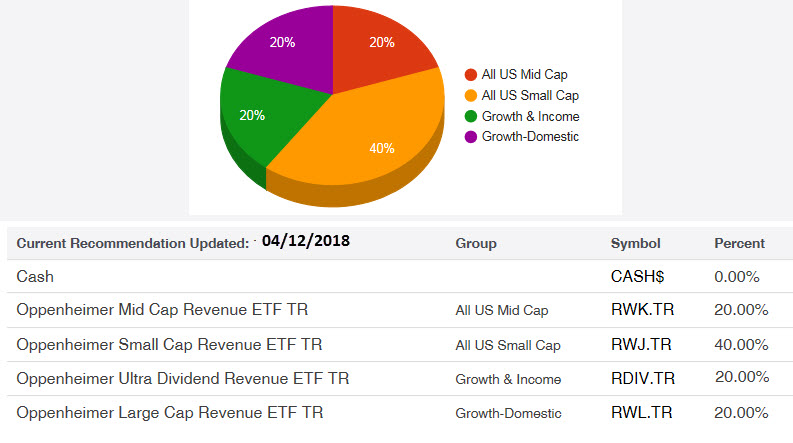
In last week’s report, we introduced the Oppenheimer US Revenue Model. This Model is designed to provide overweight exposure to the strongest fund within an inventory of four members of Oppenheimer’s Revenue line-up. With the most recent evaluation at the start of April, the Model is currently overweighted to the Oppenheimer Small Cap Revenue ETF RWJ, as it resides at the top of the Model’s Relative Strength Matrix. With that in mind, this week we would like to take a closer look at the RWJ.
The Oppenheimer Small Cap Revenue ETF seeks to provide broad exposure to the S&P 600 universe, but does so by weighting the holdings by top line revenue, instead of market capitalization. As a result, weightings among the broad sectors differ from that of the S&P 600 Index SML, with the most significant difference being the Fund’s allocation to the Consumer Discretionary sector, a top ranked sector within our Dynamic Asset Level Investing (DALI) tool. The Fund currently has an allocation of almost 28% to that sector, compared to the SML’s allocation of roughly 16%.
From a technical perspective, the RWJ has a fund score of 3.40 which is slightly above the average score for funds within the Small Cap Value category. It is currently trading in an overall positive trend, and after hitting an all-time high in January at $73, the Fund’s trading has consolidated between $65 and $71. For those following the Fund outside of the Oppenheimer US Revenue Model, a move to $64 would violate near term support while it would take a move to $58 from here in order to violate the bullish support line, which would change the overall trend of this fund to negative.

Weekly Activity:
| Ticker | Name | Report |
|---|---|---|
| RWW | Oppenheimer Financials Sector Revenue ETF | Stocks Whose Price Has Crossed Below The 150 Day Moving Average |
| RDIV | Oppenheimer Ultra Dividend Revenue ETF | Stocks Whose Price Has Crossed Below The 50 Day Moving Average |
| OMFL | Oppenheimer Russell 1000 Dynamic Multifactor ETF | Monthly Momentum Changes |
| OMFL | Oppenheimer Russell 1000 Dynamic Multifactor ETF | Stocks Whose Monthly Momentum Has Changed From Positive To Negative |
Data as of 04/11/2018

| Symbol | Name | Price | Score | Month Score Change | Signal | RS Col. | Trend | Weekly Mom |
| ESGF | Oppenheimer Global ESG Revenue ETF | 31.37 | 2.80 | -0.08 | O | -4W | ||
| ESGL | Oppenheimer ESG Revenue ETF | 30.06 | 3.94 | -0.28 | X | -10W | ||
| OMFL | Oppenheimer Russell 1000 Dynamic Multifactor ETF | 25.77 | 1.64 | -0.73 | O | -3W | ||
| OMFS | Oppenheimer Russell 2000 Dynamic Multifactor ETF | 25.38 | 0.38 | -0.30 | O | -1W | ||
| OMOM | Oppenheimer Russell 1000 Momentum Factor ETF | 25.51 | 1.68 | -0.68 | O | -3W | ||
| OQAL | Oppenheimer Russell 1000 Quality Factor ETF | 25.45 | 2.47 | -0.62 | O | -3W | ||
| OSIZ | Oppenheimer Russell 1000 Size Factor ETF | 25.58 | 1.64 | -0.36 | O | -2W | ||
| OVLU | Oppenheimer Russell 1000 Value Factor ETF | 25.55 | 3.52 | -0.59 | O | -10W | ||
| OVOL | Oppenheimer Russell 1000 Low Volatility Factor ETF | 25.34 | 1.92 | -0.13 | O | -4W | ||
| OYLD | Oppenheimer Russell 1000 Yield Factor ETF | 24.60 | 1.19 | 0.15 | O | +4W | ||
| RDIV | Oppenheimer Ultra Dividend Revenue ETF | 35.42 | 2.27 | -0.28 | Buy | O | Positive | -4W |
| REEM | Oppenheimer Emerging Markets Revenue ETF | 28.20 | 2.96 | -0.27 | X | -10W | ||
| REFA | Oppenheimer International Revenue ETF | 28.08 | 2.21 | 0.16 | O | +1W | ||
| RGLB | Oppenheimer Global Revenue ETF | 27.85 | 2.07 | -0.09 | O | -10W | ||
| RWJ | Oppenheimer Small Cap Revenue ETF | 69.41 | 3.40 | -0.55 | Sell | X | Positive | -4W |
| RWK | Oppenheimer Mid Cap Revenue ETF | 59.07 | 4.34 | -0.55 | Buy | X | Positive | -4W |
| RWL | Oppenheimer Large Cap Revenue ETF | 49.92 | 3.60 | -0.46 | Sell | O | Positive | -11W |
| RWW | Oppenheimer Financials Sector Revenue ETF | 66.65 | 4.18 | -1.04 | Sell | X | Positive | -4W |
Score change monthly period began 03/12/2018
| Links to Additional Summaries |
Oppenheimer (Thurs.)
Loading, Please Wait...
